. 2021 Mar 4:11:639665.
doi: 10.3389/fcimb.2021.639665. eCollection 2021.

Vaginal Microbiota and Cytokine Levels Predict Preterm Delivery in Asian Women

Affiliations

Vaginal Microbiota and Cytokine Levels Predict Preterm Delivery in Asian Women

Manoj Kumar et al. Front Cell Infect Microbiol. .

Abstract

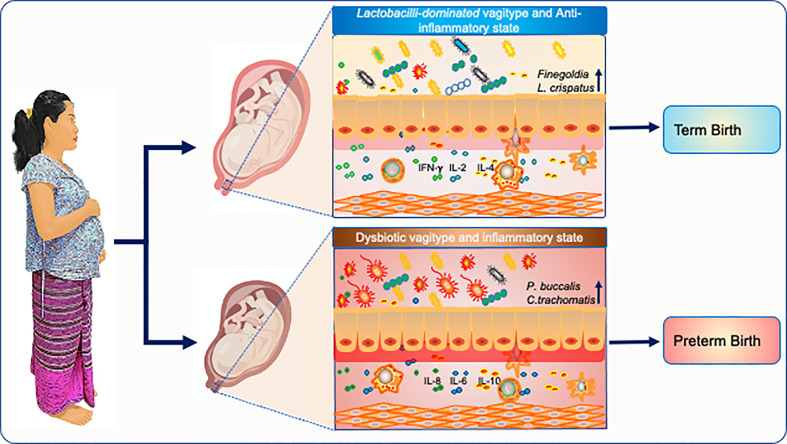
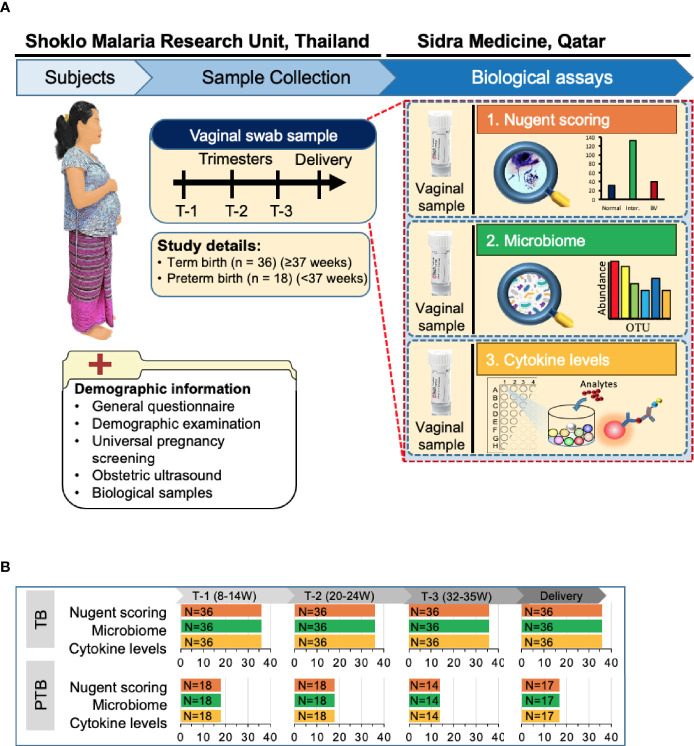
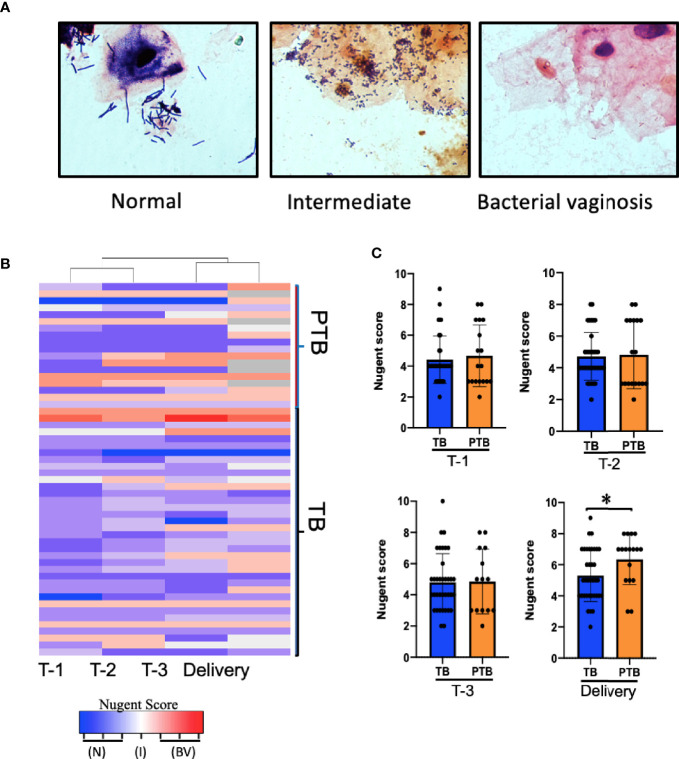
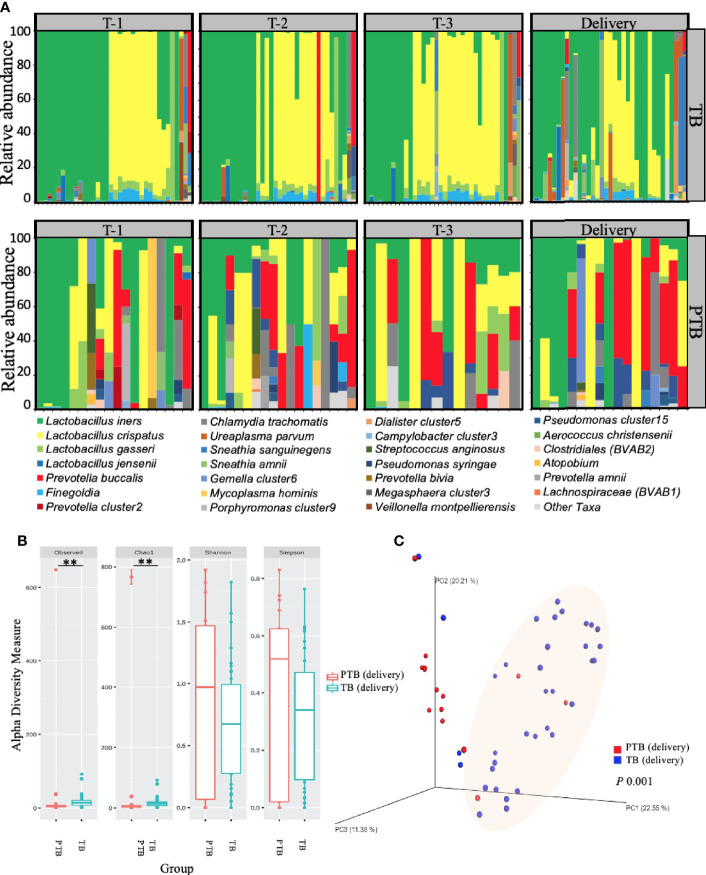
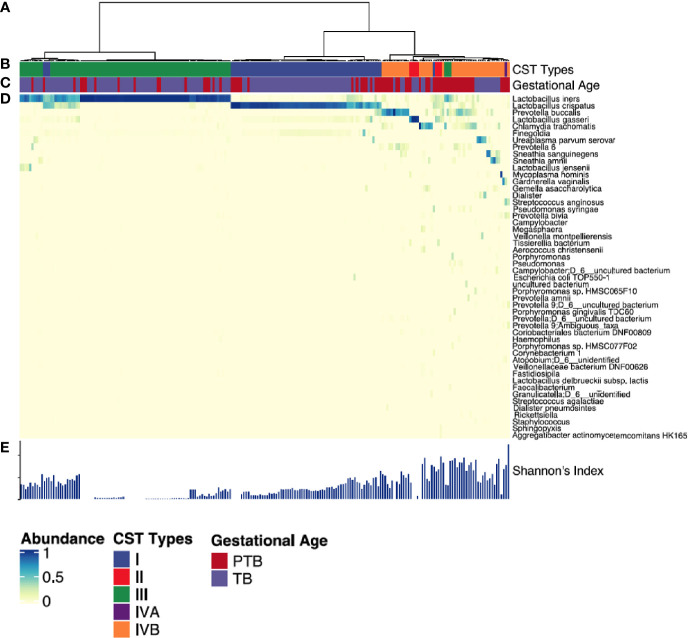
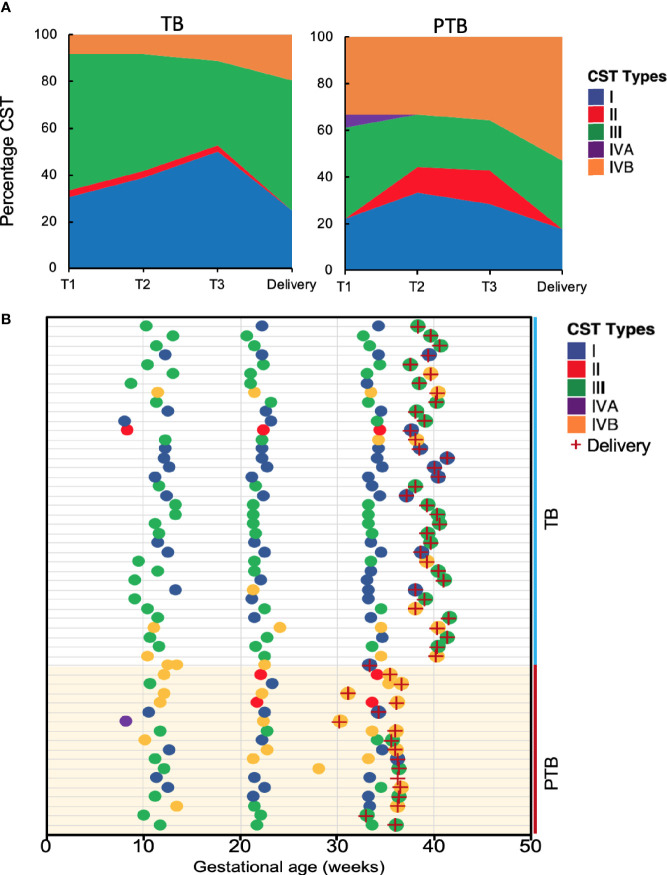
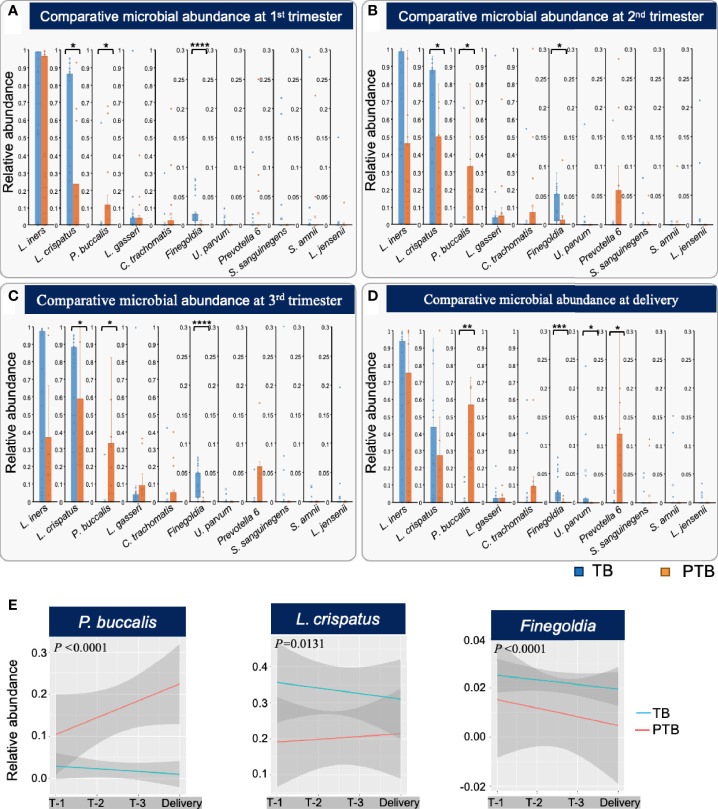
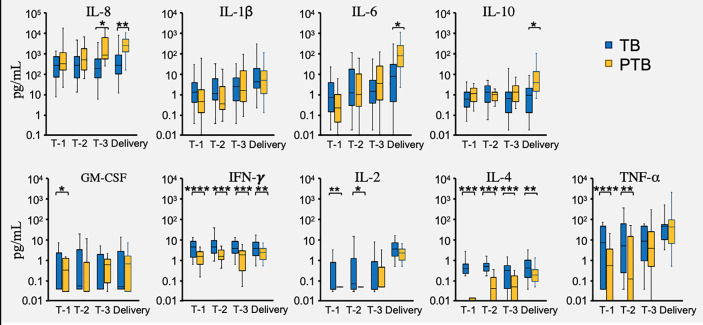
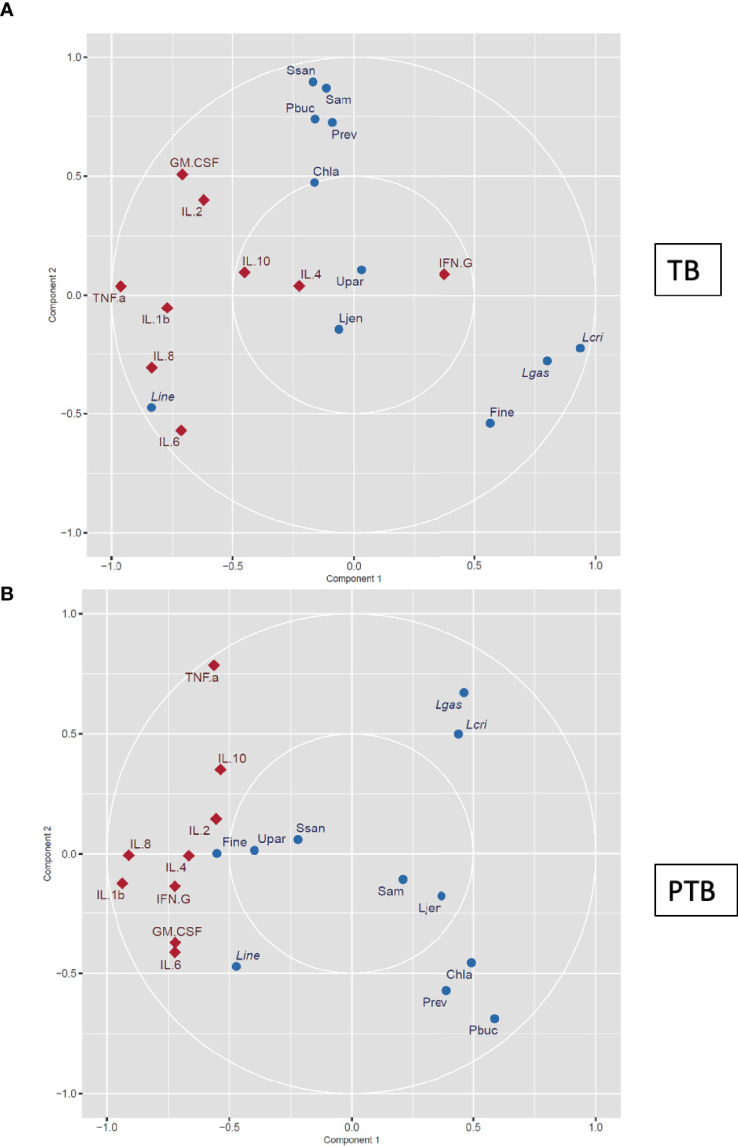
Preterm birth (PTB) is the most common cause of neonatal morbidity and mortality worldwide. Approximately half of PTBs is linked with microbial etiologies, including pathologic changes to the vaginal microbiota, which vary according to ethnicity. Globally more than 50% of PTBs occur in Asia, but studies of the vaginal microbiome and its association with pregnancy outcomes in Asian women are lacking. This study aimed to longitudinally analyzed the vaginal microbiome and cytokine environment of 18 Karen and Burman pregnant women who delivered preterm and 36 matched controls delivering at full term. Using 16S ribosomal RNA gene sequencing we identified a predictive vaginal microbiota signature for PTB that was detectable as early as the first trimester of pregnancy, characterized by higher levels of Prevotella buccalis, and lower levels of Lactobacillus crispatus and Finegoldia, accompanied by decreased levels of cytokines including IFNγ, IL-4, and TNFα. Differences in the vaginal microbial diversity and local vaginal immune environment were associated with greater risk of preterm birth. Our findings highlight new opportunities to predict PTB in Asian women in low-resource settings who are at highest risk of adverse outcomes from unexpected PTB, as well as in Burman/Karen ethnic minority groups in high-resource regions.

Keywords: 16S rRNA gene sequencing; Asian; Nugent scoring; Preterm birth; dysbiosis; microbiome; microbiota; vaginal cytokines.


Conflict of interest statement

The authors declare that the research was conducted in the absence of any commercial or financial relationships that could be construed as a potential conflict of interest.

Figures

Graphical Abstract
Graphical Abstract
Figure 1
Figure 1
Overview of the study design. (A) Of the 400 Karen and Burman women enrolled in Molecular Signature in Pregnancy (MSP) study, 18 pregnant women experienced PTB (pre-term birth) and 36 women who delivered at term (TB) were selected for this study. Vaginal swabs were taken from these women at Shoklo Malaria Research Unit (SMRU) health care clinics at each trimester of pregnancy: T-1 (8–14 weeks), T-2 (20–24 weeks), T-3 (32–35 weeks) and at delivery. Detailed demographic information was collected at the first visit. Vaginal swab samples were used for Nugent scoring to determine bacterial vaginosis status, for microbiome analysis and for assessing the levels of different cytokines. BV, bacterial vaginosis; OTU, operational taxonomic unit; W, weeks of gestation. (B) Number of samples collected from women in both groups and processed for each analysis.
Figure 2
Figure 2
Association between Nugent score and PTB. (A) Representative images of Gram-stained vaginal swabs with scoring normal, intermediate, and BV, Slides were evaluated under 1,000x magnification according to the 10-point Nugent scale. (B) Heatmap showing the Nugent scores of individual women who delivered at term (TB) and women who experienced pre-term birth (PTB). Columns represent the trimester of pregnancy. Each row represents one subject. (C) Comparison of the average Nugent score in the TB or PTB groups during pregnancy. P-value was calculated using unpaired t-test (two-tailed) with Welch’s correction for difference in Nugent score between TB and PTB groups. *p < 0.05. T-1: Trimester-1, T-2: Trimester-2; T-3: Trimester-3; N, Normal; I, Intermediate; BV, Bacterial Vaginosis.
Figure 3
Figure 3
Vaginal microbiome composition in women with TB and PTB. (A) Stacked bar plots showing the relative abundance (%) of each microbial species in vaginal swabs from women who had full term birth (TB) and women who experienced preterm birth (PTB). Each vertical bar represents one woman. (B) Alpha diversity of the microbiome at delivery was compared between the two groups by the number of operational taxonomic units (OTUs) observed and by the Chao1, Shannon and Simpson diversity indices. The asterisks indicate a significant difference in diversity of microbial communities between the two groups (**P < 0.01). (C) Beta diversity plot showing microbial communities clustered using Principle Coordinates Analysis (PCoA) based on Bray–Curtis dissimilarities between vaginal microbiomes. Statistical significance of the alpha diversity measures was calculated using the Kruskal-Wallis test for non-parametric data, while analysis of similarities method (ANOSIM) was used for calculation of the distance matrix difference between the TB and PTB groups using unweighted beta diversity parameters. P-values lower than 0.05 were considered statistically significant.
Figure 4
Figure 4
Vaginal microbiota profiles of women who had PTB and TB deliveries. (A) Hierarchical clustering of Euclidean distance matrices with Ward linkage on relative abundances of reads for each OTU within individual vaginal swab samples collected at all time points. (B) Community state types (CST) identified across all the study subjects. Each CST is represented by a different color according to the key shown underneath. (C) Gestational age category (PTB shown in red, TB shown in blue). (D) Heatmap of relative abundances of bacterial species within the vaginal microbiota of each woman. Each column represents a woman’s vaginal microbiota profile, and each row represents a bacterial species. Only species that represent at least 0.5% of the total microbiome in at least one sample are shown. (E) Shannon diversity indices calculated for each sample. Each CST is represented by a different color: CST-I, Lactobacillus crispatus-dominated; CST-II, Lactobacillus gasseri-dominated; CST-III, Lactobacillus iners-dominated; CST-IVA, lower abundance of Lactobacillus spp together with low proportions of anaerobic bacteria such as Anaerococcus, Corynebacterium, and Streptococcus; CST-IVB: dominated by higher abundance of the genera Atopobium, Prevotella, Parvimonas, Sneathia, Gardnerella, Mobiluncus, or Peptoniphilus and several other taxa.
Figure 5
Figure 5
Vaginal community state types during the course of pregnancy. (A) Stacked area charts of community state type (CST) showing the dynamics of the vaginal microbiome in the full term birth (TB) and preterm birth (PTB) groups at the three trimesters of pregnancy (T-1, T-2, T-3) and at delivery. X-axis represents the gestational age T-1: Trimester-1; T-2: Trimester-2; T-3: Trimester-3, y-axis represents the percentage of each CST in the samples from each group. (B) Profiles of community state type (CST) for pregnant women who delivered at term (TB) and those who had preterm birth (PTB) as a function of gestational age. Delivery is indicated by a red cross.
Figure 6
Figure 6
Different bacterial taxa associated with TB and PTB. (A) Differences in relative abundance of the top 11 microbial taxa found between full term birth (TB) and preterm birth (PTB) groups in the first trimester; (B) second trimester; (C) third trimester, and (D) at the time of delivery. Blue bars represent the TB group, while orange bars represent PTB. The asterisks indicate a significant difference between two groups (*P < 0.05, **P < 0.01, ***P < 0.001, ****P < 0.0001). (E) Longitudinal trends in relative abundance of the statistically significant microbial taxa identified by comparing TB and PTB groups, analyzed using ggplots. Blue lines represent the TB group and red lines the PTB group. The P-values were calculated using the unpaired t-test (two-tailed) with Welch’s correction for difference in proportional microbial abundance between TB and PTB groups.
Figure 7
Figure 7
Vaginal cytokine levels during PTB and TB pregnancies. Cytokines were measured in fluid used to elute vaginal swabs from full term birth (TB) and preterm birth (PTB) women in the three trimesters of pregnancy (T-1, T-2, T-3) and at delivery. Blue bars represent the cytokine levels measured in the TB group, while the orange bars represent the cytokine levels in the PTB group. P-values were calculated using the unpaired t-test with Welch’s correction. The Y axis represent the cytokine levels in log scale. The asterisks indicate a significant difference in cytokine levels between the two groups (*P < 0.05, **P < 0.01, ***P < 0.001 and ****P < 0.0001).
Figure 8
Figure 8
Canonical correlation analysis of vaginal microbial signature and cytokine levels. The vaginal microbial taxonomic profiles and cytokine levels in samples collected from women who experienced (A) TB and (B) PTB at the first trimester (8–14 weeks) were log-transformed and co-integrated using canonical correlation analysis. Cytokines are represented as red diamonds, and bacteria are represented as blue circles. Positively correlated variables are grouped together, while negatively correlated variables are positioned on opposite sides of the plot origin. Thus cytokines or microbial taxa that are clustered tightly are highly correlated, and factors that are distant from each other are not correlated. Pbuc, Prevotella buccalis; Fine, Finegoldia; Chla, Chlamydia trachomatis; Lcri, Lactobacillus crispatus; Line, Lactobacillus iners; Lgas, Lactobacillus gasseri; Ljen, Lactobacillus jensenii; Prev, Prevotella 6; Ssan, Sneathia sanguinegens; Upar, Ureaplasma parvum; Sam, Sneathia amnii.

Similar articles

Cited by

References

    1. Amabebe E., Anumba D. O. C. (2018). The Vaginal Microenvironment: The Physiologic Role of Lactobacilli. Front. Med. (Lausanne) 5, 181. 10.3389/fmed.2018.00181 - DOI - PMC - PubMed
    1. Andrews S. (2010). FastQC: a quality control tool for high throughput sequence data. Available at: http://www.bioinformatics.babraham.ac.uk/projects/fastqc.
    1. Beck S., Wojdyla D., Say L., Betran A. P., Merialdi M., Requejo J. H., et al. . (2010). The worldwide incidence of preterm birth: a systematic review of maternal mortality and morbidity. Bull. World Health Organ 88, 31–38. 10.2471/BLT.08.062554 - DOI - PMC - PubMed
    1. Blencowe H., Cousens S., Oestergaard M. Z., Chou D., Moller A. B., Narwal R., et al. . (2012). National, regional, and worldwide estimates of preterm birth rates in the year 2010 with time trends since 1990 for selected countries: a systematic analysis and implications. Lancet 379, 2162–2172. 10.1016/S0140-6736(12)60820-4 - DOI - PubMed
    1. Bolger A. M., Lohse M., Usadel B. (2014). Trimmomatic: a flexible trimmer for Illumina sequence data. Bioinformatics (Oxford England) 30, 2114–2120. 10.1093/bioinformatics/btu170 - DOI - PMC - PubMed

Publication types

Supplementary concepts

LinkOut - more resources