. 2021 Mar 4:9:599525.
doi: 10.3389/fcell.2021.599525. eCollection 2021.

Evolution of Reproductive Division of Labor - Lessons Learned From the Social Amoeba Dictyostelium discoideum During Its Multicellular Development

Affiliations

Evolution of Reproductive Division of Labor - Lessons Learned From the Social Amoeba Dictyostelium discoideum During Its Multicellular Development

Ranjani Dhakshinamoorthy et al. Front Cell Dev Biol. .

Abstract

The origin of multicellular life from unicellular beings is an epochal step in the evolution of eukaryotes. There are several factors influencing cell fate choices during differentiation and morphogenesis of an organism. Genetic make-up of two cells that unite and fertilize is the key factor to signal the formation of various cell-types in due course of development. Although ploidy of the cell-types determines the genetics of an individual, the role of ploidy in cell fate decisions remains unclear. Dictyostelium serves as a versatile model to study the emergence of multicellular life from unicellular life forms. In this work, we investigate the role played by ploidy status of a cell on cell fate commitments during Dictyostelium development. To answer this question, we created Dictyostelium cells of different ploidy: haploid parents and derived isogenic diploids, allowing them to undergo development. The diploid strains used in this study were generated using parasexual genetics. The ploidy status of the haploids and diploids were confirmed by microscopy, flow cytometry, and karyotyping. Prior to reconstitution, we labeled the cells by two methods. First, intragenic expression of red fluorescent protein (RFP) and second, staining the amoebae with a vital, fluorescent dye carboxyfluorescein succinimidyl ester (CFSE). RFP labeled haploid cells allowed us to track the haploids in the chimeric aggregates, slugs, and fruiting bodies. The CFSE labeling method allowed us to track both the haploids and the diploids in the chimeric developmental structures. Our findings illustrate that the haploids demonstrate sturdy cell fate commitment starting from the aggregation stage. The haploids remain crowded at the aggregation centers of the haploid-diploid chimeric aggregates. At the slug stage haploids are predominantly occupying the slug posterior, and are visible in the spore population in the fruiting bodies. Our findings show that cell fate decisions during D. discoideum development are highly influenced by the ploidy status of a cell, adding a new aspect to already known factors Here, we report that ploidy status of a cell could also play a crucial role in regulating the cell fate commitments.

Keywords: Dictyostelium discoideum; aggregation multicellularity; cell fate choices; division multicellularity; ploidy; reproductive division of labor.


Conflict of interest statement

The authors declare that the research was conducted in the absence of any commercial or financial relationships that could be construed as a potential conflict of interest.

Figures

FIGURE 1
FIGURE 1
Confirmation of Ax2IR150 diploid. (A) Schematic representation of diploid generation: Pure parent strains are grown in control flasks as indicated and in test flask both the parents, Ax2 and IR150thy mixed in equal ratio and grown in medium that supports their growth. After overnight incubation at 22°C/140 rpm, cultures in control flasks shifted to Petri dishes labeled positive and negative controls and test flask culture shifted to test plate. Positive control plates contain media that supports parent strains growth, media in negative control and test plates allow only diploid formation. Growth medium used and the expected outcomes are summarized in the table below. (B) Morphology of haploids and diploids: Axenically grown haploid and diploid amoebae allowed to adhere to Petri dishes and imaged under upright microscope (top panels), scale = 5 μm. Haploid and diploid amoebae subjected to development. After 48 h, spores harvested from haploid and diploid fruiting bodies and visualized under upright microscope (bottom panels), scale = 10 μm. (C) Karyotyping: Haploid parents and their isogenic diploid amoebae stained with giemsa and imaged under high resolution microscope, five images for each haploid strain and eight comparative images for diploid strain are displayed, scale = 5 μm. (D) Flow cytometry analysis of haploid parents and their isogenic diploid: Vegetative amoebae (top panels) and spores (bottom panels) were fixed with ice-cold methanol before flow cytometry analyses. The panels displayed indicate DNA content in the haploid and diploid strains. Ax2pTXRFP is the wild type Ax2 strain transfected with RFP reporter and used for reconstitution experiments.
FIGURE 2
FIGURE 2
Intracellular characteristics of haploids and diploids. (A) Heaviness of haploid and diploid amoebae: Haploid and diploid amoebae grown in axenic medium fortified with glucose and without glucose, 10 ml culture of each strain was centrifuged at 2 × 10⁶ cells/ml density and washed with KK2 buffer. Pellets dried for about 20 min at 60°C and their dry weights measured and represented in grams (g). One-way ANOVA, Tukey’s multiple comparison test was performed to ascertain statistical significance, p < 0.05, ∗∗∗p < 0.001, ****p < 0.0001, and n = 5. (B) Glucose quantification: Vegetative amoebae were grown as described earlier, followed by cell lyses and glucose quantification as suggested by the manufacturer. Glucose concentration in each strain is derived after normalizing with the total protein concentration.
FIGURE 3
FIGURE 3
Aberrant developmental phenotypes of IR150thy. (A) Abnormal slugs and fruiting bodies of IR150thy: Arrowheads (black) depict migrating slugs of IR150thy displaying thick and long slime sheaths (top, left panels), which later become fruiting bodies with extended stalks (top, right panels). High resolution images of IR150thy migrating slugs (bottom panels). Arrowheads (black) indicate stout, extended slime sheaths, Scale = 100 μm. (B) Ax2: IR150thy chimeric slugs: Ax2 and IR150thy amoebae mixed at 1:1 ratio and deposited on KK2 agar plates for slug formation. Before mixing, either Ax2 or IR150thy stained with CFSE. Appropriate controls, Ax2 and IR150thy slugs stained with CFSE are also represented. Green color indicates location of CFSE stained population, Scale = 100 μm. (C) IR150thy spore morphology: Spores obtained from Ax2, IR150thy, and Ax2IR150 fruiting bodies are depicted. Arrowheads (black) denote IR150thy spores, (D) Spore formation efficiency (SFE) quantification: The number of spores obtained after plating 3.2 × 10⁶ amoebae for the strains Ax2, Ax2pTXRFP, IR150thy, RtoA-, and Ax2IR150 are represented. One-way ANOVA, Tukey’s multiple comparison tests were performed to determine statistical significance. p < 0.05, ***p < 0.001, and n = 3.
FIGURE 4
FIGURE 4
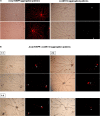
Ax2pTXRFP: Ax2IR150 aggregation patterns. Haploid parent, Ax2pTXRFP mixed with its isogenic diploid, Ax2IR150 in various ratios (B) 1:1, 2:8, and 1:9; deposited on KK2 agar plates and incubated at 22°C. After eighth hour of development, chimeric aggregates visualized under stereo zoom microscope. Aggregates of appropriate controls (A), Ax2pTXRFP and Ax2IR150 are also displayed. Red color represents Ax2pTXRFP, asterisks (black and white) mark the aggregation centers, scale = 100 μm.
FIGURE 5
FIGURE 5
Ax3-CFSE: Ax3IR110 aggregation patterns. Ax3 amoebae stained with CFSE, washed and mixed with Ax3IR110 amoebae in different ratios 1:1 (B), 2:8 (C), and 1:9 (D), deposited on KK2 agar for development, and imaged at aggregation stage. Appropriate controls (A)- Ax3-CFSE and Ax3IR110 aggregation patterns are also displayed. Green color represents Ax3-CFSE, asterisks (black and white) mark the aggregation centers, scale = 100 μm.
FIGURE 6
FIGURE 6
Chimeric slugs of RFP marked haploids: unmarked diploids. Axenically grown Ax2pTXRFP and/or Ax3pTXRFP haploid amoebae mixed with Ax2IR150 and/or Ax3IR110 diploid amoebae in different ratios (2:8 and 1:9) and imaged under stereo zoom microscope at slug stage (D–G). Respective pure and self-mixing controls slugs are also displayed (A–C), n ≥ 30 slugs. Red color indicates haploids; arrowheads (white) denote haploids at the signaling tip, and arrows (black) indicate slug directions, scale = 100 μm.
FIGURE 7
FIGURE 7
Chimeric slugs of CFSE marked haploids: unmarked diploid. Axenically grown Ax2-CFSE and/or Ax3-CFSE haploid amoebae mixed with Ax2IR150 and/or Ax3IR110 diploid amoebae in different ratios (2:8 and 1:9) and imaged under stereo zoom microscope at slug stage (B,D). Respective control slugs are also displayed (A,C). n ≥ 30 slugs. Arrows indicate slug direction, scale = 100 μm.
FIGURE 8
FIGURE 8
Chimeric slugs of Ax3pTXRFP: Ax3IR110.CFSE stained diploid. Axenically grown Ax3pTXRFP mixed with Ax3IR110.CFSE stained amoebae at different ratios 1:1 (A), 2:8 (B), 1:9 (C), 8:2 (D), and 9:1 (E) and imaged under stereo zoom microscope at slug stage. n ≥ 30 slugs. Red indicates the location of Ax3pTXRFP haploids, green represents the location of Ax3IR110.CFSE diploids, and orange color represents the merge locations of Ax3pTXRFP and Ax3IR110.CFSE. Arrowheads (white) indicate haploids at the signaling tip. scale = 100 μm.
FIGURE 9
FIGURE 9
Chimeric fruiting bodies of Ax2pTXRFP: Ax2IR150. (A). Haploid parent, Ax2pTXRFP amoebae mixed with its isogenic diploid, Ax2IR150 in different ratios- 1:1, 2:8, and 1:9) and deposited on KK2 agar plates. After 48 h incubation at 22°C, fruiting bodies imaged under stereo zoom microscope. Appropriate controls, Ax2pTXRFP and Ax2IR150 fruiting bodies are also displayed. Red represents Ax2pTXRFP haploid localization in the chimeric fruiting bodies. Arrowheads (white) indicate Ax2pTXRFP at basal disks of chimeric fruiting bodies. n ≥ 30 fruiting bodies, scale = 100 μm. (B) Ax3pTXRFP: Ax3IR110 chimeric fruiting bodies. Haploid parent, Ax3pTXRFP amoebae mixed with its isogenic diploid, Ax3IR110 in different ratios (1:1, 2:8, and 1:9) and allowed forming fruiting bodies as described above and chimeric fruiting bodies imaged under stereo zoom microscope. Appropriate controls, Ax3pTXRFP and Ax3IR110 fruiting bodies are also displayed. Red represents Ax3pTXRFP haploid localization in fruiting bodies. Arrowheads (white) indicate Ax3pTXRFP visualized at the basal disks of the chimeric fruiting bodies. n ≥ 30 fruiting bodies, scale = 100 μm.
FIGURE 10
FIGURE 10
Fluorescence quantification in the slugs of Ax2 and Ax3 (haploid: diploid) strains. (A,B) Fluorescence quantification: Fluorescence across the slugs examined using ImageJ. Bars in the control (Ax2pTXRFP/Ax3pTXRFP) represent 100% fluorescence. Bars in 1:1, 2:8, and 1:9 represent percentage fluorescence observed at slug posterior. Around 15 slugs were quantified for each chimeric mix and for the controls. Dunn’s multiple comparisons test was performed to determine statistical significances. p < 0.05, **p < 0.01 (1:1, 2:8), and ***p < 0.001.

Similar articles

Cited by

References

    1. Aerts R. J., Durston A. J., Konijn T. M. (1987). Cytoplasmic pH at the onset of development in Dictyostelium. J. Cell Sci. 87 423–430. - PubMed
    1. Aerts R. J., Durston A. J., Moolenaar W. H. (1985). Cytoplasmic pH and the regulation of the Dictyostelium cell cycle. Cell 43(3 Pt 2), 653–657. 10.1016/0092-8674(85)90237-5 - DOI - PubMed
    1. Ambros V. (1999). Cell cycle-dependent sequencing of cell fate decisions in Caenorhabditis elegans vulva precursor cells. Development 126 1947–1956. - PubMed
    1. Araki T., Nakao H., Takeuchi I., Maeda Y. (1994). Cell-cycle-dependent sorting in the development of Dictyostelium cells. Dev. Biol. 162 221–228. 10.1006/dbio.1994.1080 - DOI - PubMed
    1. Aversano R., Ercolano M. R., Caruso I., Fasano C., Rosellini D., Carputo D. (2012). Molecular tools for exploring polyploidy genomes in plants. Int. J. Mol. Sci. 13 10316–10335. 10.3390/ijms130810316 - DOI - PMC - PubMed