. 2021 Mar 4:9:639952.
doi: 10.3389/fcell.2021.639952. eCollection 2021.

SARAF and Orai1 Contribute to Endothelial Cell Activation and Angiogenesis

Affiliations

SARAF and Orai1 Contribute to Endothelial Cell Activation and Angiogenesis

Isabel Galeano-Otero et al. Front Cell Dev Biol. .

Erratum in

Abstract

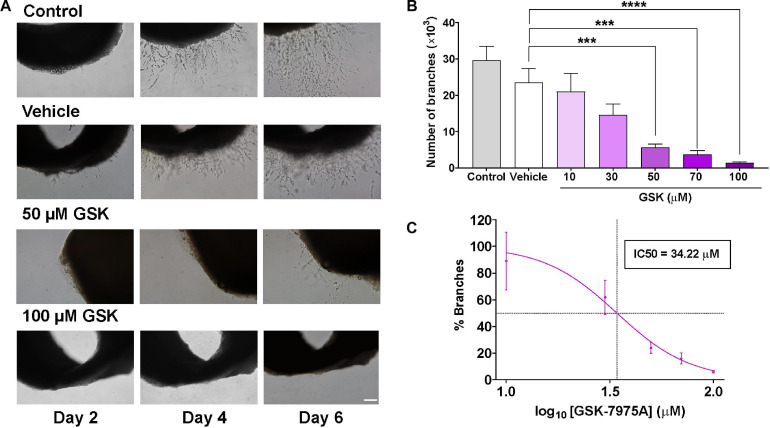
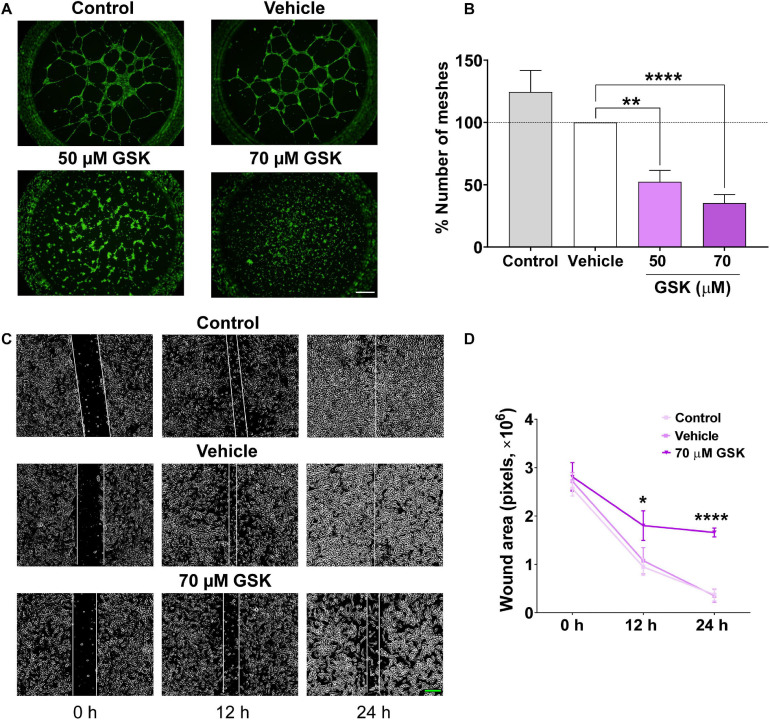
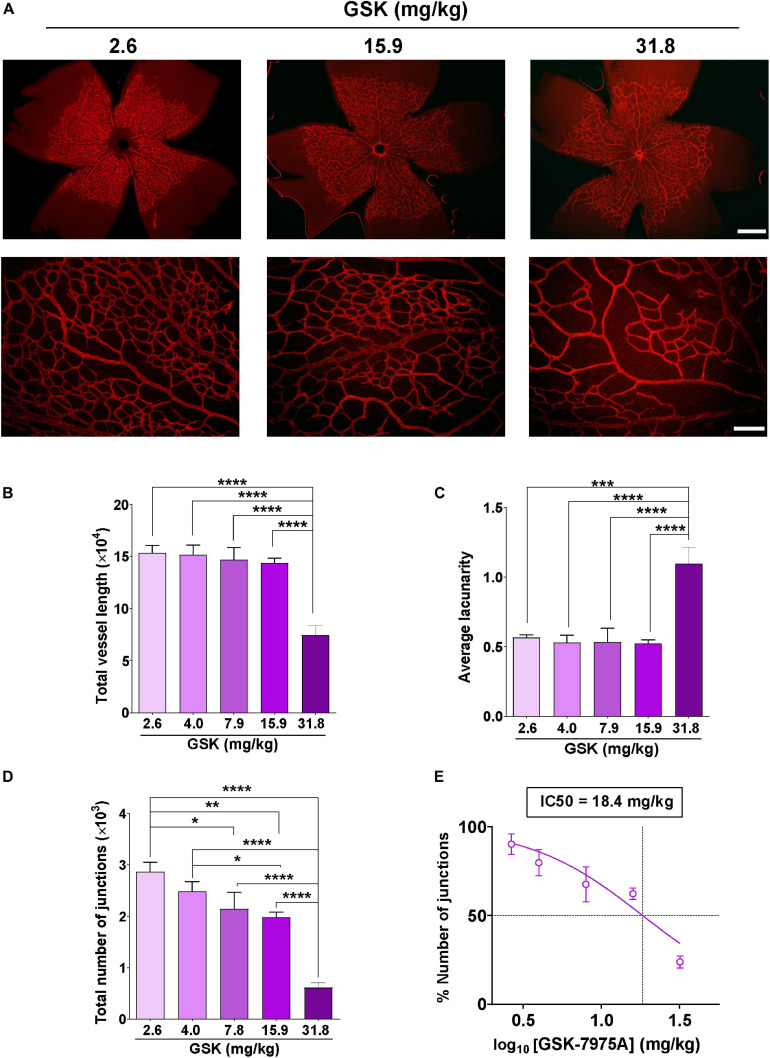
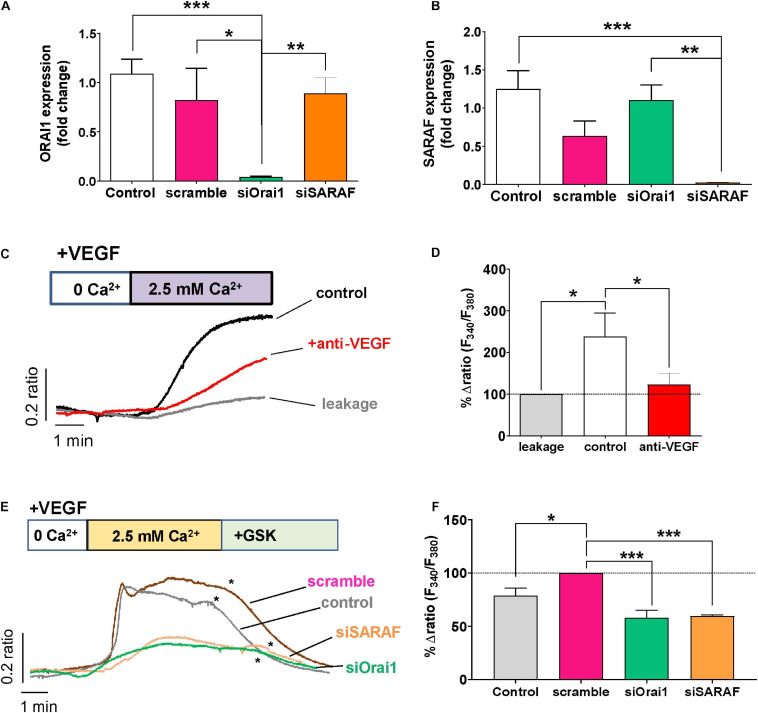
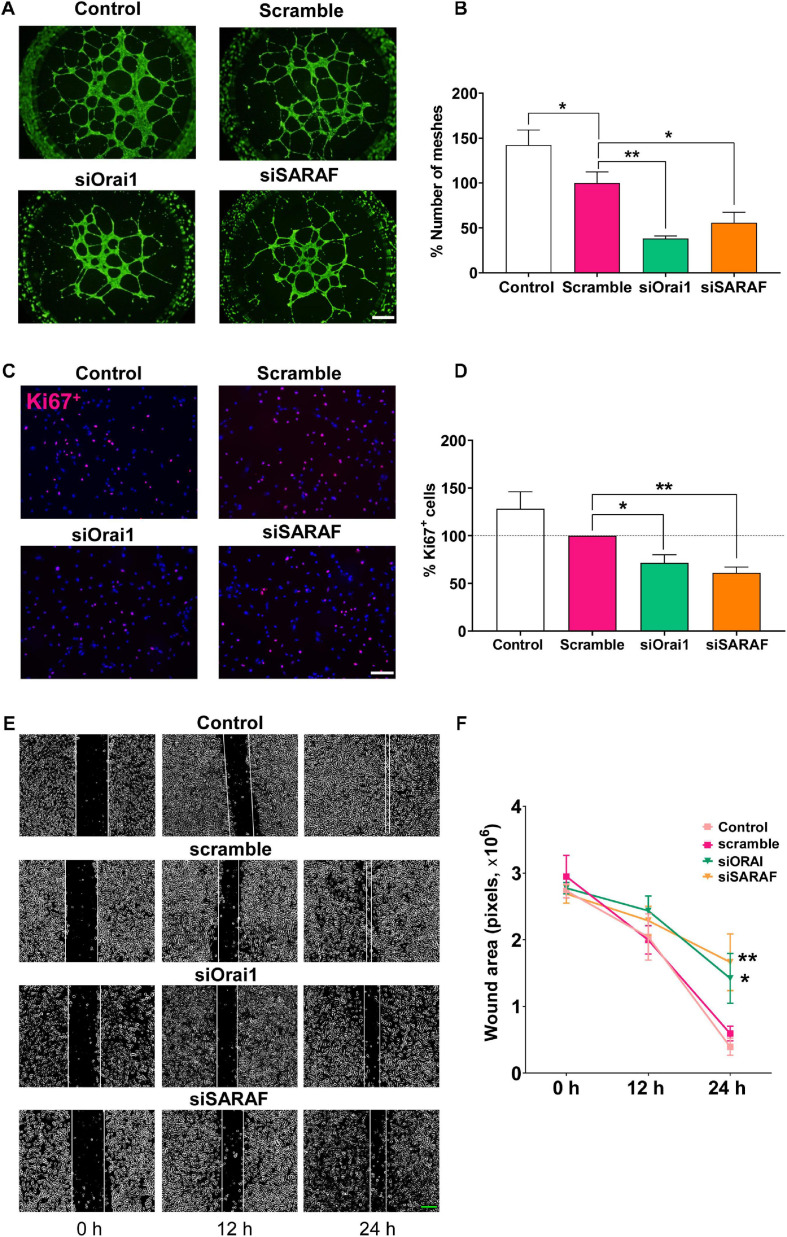
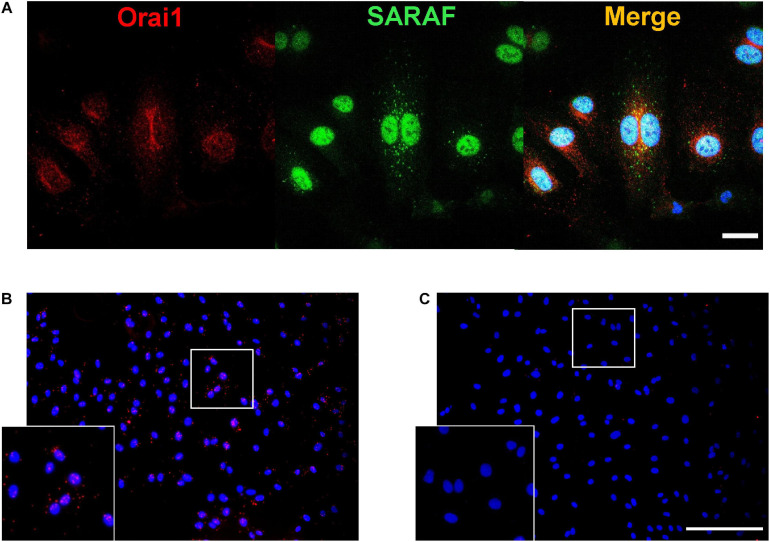
Angiogenesis is a multistep process that controls endothelial cells (ECs) functioning to form new blood vessels from preexisting vascular beds. This process is tightly regulated by pro-angiogenic factors, such as vascular endothelial growth factor (VEGF), which promote signaling pathways involving the increase in the intracellular Ca2+ concentration ([Ca2+]i). Recent evidence suggests that store-operated calcium entry (SOCE) might play a role in angiogenesis. However, little is known regarding the role of SARAF, SOCE-associated regulatory factor, and Orai1, the pore-forming subunit of the store-operated calcium channel (SOCC), in angiogenesis. Here, we show that SOCE inhibition with GSK-7975A blocks aorta sprouting, as well as human umbilical vein endothelial cell (HUVEC) tube formation and migration. The intraperitoneal injection of GSK-7975A also delays the development of retinal vasculature assessed at postnatal day 6 in mice, since it reduces vessel length and the number of junctions, while it increases lacunarity. Moreover, we find that SARAF and Orai1 are involved in VEGF-mediated [Ca2+]i increase, and their knockdown using siRNA impairs HUVEC tube formation, proliferation, and migration. Finally, immunostaining and in situ proximity ligation assays indicate that SARAF likely interacts with Orai1 in HUVECs. Therefore, these findings show for the first time a functional interaction between SARAF and Orai1 in ECs and highlight their essential role in different steps of the angiogenesis process.

Keywords: HUVEC; Orai1; SARAF; SOCE; angiogenesis.


Conflict of interest statement

The authors declare that the research was conducted in the absence of any commercial or financial relationships that could be construed as a potential conflict of interest.

Figures

FIGURE 1
FIGURE 1
SOCC inhibition by GSK-7975A reduces aorta sprouting. Aorta was cultured in the endothelial cell culture medium (EGM-2) enriched with growth factors. (A) Phase-contrast imaging (×10 objective; scale bar = 200 μm) shows sprouting of aorta rings on day 2, 4, and 6 in untreated aorta (control), in aortic ring treated with DMSO (Vehicle), and in aortic rings incubated with GSK at 0, 50, and 100 μM. (B) Bar graph shows the number of branches in control rat aorta rings (gray) and in aorta treated with vehicle (DMSO; white) and with 10, 30, 50, 70, and 100 μM of GSK (purple) (n = 6). (C) Curve shows the dose-dependent inhibition of % branches mediated by GSK-7975A in the rat aorta ring assay. IC50 = 34.22 μM. The fit was done using Hill equation as described in Methods (Hill slope: −2.443, 95% CI IC50 22.86 to 44.85, R2 = 0.5762). Values are presented as means ± S.E.M. (***), and (****) indicate significance with p < 0.01, and p < 0.0001, respectively.
FIGURE 2
FIGURE 2
GSK-7975A decreases HUVEC tube formation and migration. (A) Fluorescence images (×4 objective; scale bar = 500 μm) are from HUVECs (control, vehicle, 50 and 70 μM of GSK) incubated with Calcein-AM and seeded on Matrigel. (B) Bar graph shows normalized means of the percentage of meshes to the number in HUVECs treated with vehicle (gray). Bars are for untreated HUVECs, for HUVECs treated with vehicle (white), and with 50 or 70 μM of GSK (n = 6). (C) Phase-contrast imaging (×10 objective; green scale bar = 200 μm) of the HUVEC wound healing assay. HUVEC was cultured in the endothelial cell culture medium (EGM-2) enriched with growth factors. Images are from control cells and for those treated with vehicle and 70 μM of GSK, taken at 0, 12, and 24 h. (D) Graph shows summary data of the evolution of the wound area (n = 6 per group). Values are presented as the means ± S.E.M. (*), (**), and (****) indicate significance with p < 0.05, p < 0.01, and p < 0.0001, respectively.
FIGURE 3
FIGURE 3
GSK-7975A alters the vascularization of the retina. (A) Representative images of retinal blood vessels stained with Isolectin B4. Retina was isolated from P6 mouse injected with 2.6, 15.9, and 31.8 mg/kg of GSK. Fluorescence images were taken with objectives ×4 (top; scale bar = 500 μm) and ×20 (bottom; scale bar = 100 μm). (B–D) Bar graphs show summary data of total vessel length (B), the average of lacunarity (C), and the total number of junctions (D) of mouse retina vessels injected with 2.6, 4.0, 7.9, 15.9, and 31.8 mg/kg of GSK (n = 4 to 8). (E) Curve shows the dose-dependent inhibition of % number of junctions affected by GSK-7975A IC50 = 18.4 mg/kg. The fit was done using the Hill equation (Hill slope: -1.185, 95% CI IC50 14.50 to 24.66, R2 = 0.6480). Values are presented as the means ± S.E.M. (*), (**), (***), and (****) indicate significance with p < 0.05, p < 0.01, p < 0.001, and p < 0.0001, respectively.
FIGURE 4
FIGURE 4
Role of Orai1 and SARAF in VEGF-induced Ca2+ entry. (A,B) Bar graphs show levels of mRNA expression (log fold change) of Orai1 (A) and SARAF (B) in control HUVECs (white, n = 8) and in cells transfected with scramble (pink, n = 4), siRNA Orai1 (green, n = 5), and siRNA SARAF (orange, n = 5). (C) Representative recordings of VEGF-induced changes in the [Ca2+]i expressed as fluorescence ratio (F340/F380). HUVECs were incubated with 30 ng/ml VEGF (control) and with anti-VEGF (+ anti-VEGF) for 5 min in a free Ca2+ solution; 2.5 mM Ca2+ was re-added as indicated. Gray trace shows representative recording of non-specific Ca2 + entry in non-treated HUVECs after Ca2+ addition. (D) Bar graph shows the percentage of delta ratio increase after and before adding Ca2+ normalized to leakage (gray, n = 164) in cells treated with VEGF (white, n = 200) and in those incubated with VEGF + anti-VEGF (red, n = 255). (E) Representative recordings of VEGF (30 ng/ml)-induced changes in [Ca2+]i in control HUVECs and those transfected with scramble siRNA or with Orai1 and SARAF siRNA. (*) indicates the addition of GSK-7975A (10 μM) at the end of each experiment. (F) Bar graph shows the percentage of delta ratio increase normalized to scramble (pink, n = 168 cells) after and before adding Ca2+ into non-transfected control cells (gray, n = 236 cells) and in cells transfected with siRNA Orai1 (green, n = 168 cells) and SARAF (orange, n = 115 cells). Values are presented as the means ± S.E.M. Significance is indicated by (*) for p < 0.05, (**) for p < 0.01, and (***) for p < 0.001.
FIGURE 5
FIGURE 5
siRNA-mediated inhibition of Orai1 and SARAF attenuates HUVEC tube formation, proliferation, and migration. (A) Fluorescence images (×4 objective; scale bar = 500 μm) and (B) summary data (% of meshes number normalized to scramble) obtained from HUVECs embedded on Matrigel and stained with Calcein-AM of control (white) and transfected with scramble (pink), siRNA Orai1 (green), and siRNA SARAF (orange) (n = 5 to 6). (C) Merged representative images (×20 objective; scale bar = 100 μm) of HUVECs stained with Ki67+ (red) and DAPI (blue) in control and in cells transfected with scramble, or siRNA Orai1 and SARAF (n = 5). (D) Bar graph shows the percentage of Ki67+ control (white bar) and transfected HUVECs with siOrai1 and siSARAF, normalized to scramble. (E) Phase-contrast imaging (×10 objective; scale bar = 200 μm) of the HUVEC wound healing assay modified with ImageJ. Images were taken at 0, 12, and 24 h after the scratch from control HUVECs and form cells transfected with scramble siRNA, and siRNA against Orai1 and SARAF. (F) Graph shows summary data of the evolution of the wound area in experiments as in (E) (n = 4). Values are presented as the means ± S.E.M. Significance is indicated by (*) and (**) for p < 0.05 and p < 0.01, respectively.
FIGURE 6
FIGURE 6
SARAF and Orai1 colocalization in HUVECs. (A) Representative images with immunofluorescence (×40 objective with ×2 zoom; scale bar = 25 μm) using specific antibodies show localization of SARAF (green) and Orai1 (red) in HUVECs stained with anti-rabbit SARAF and anti-mouse Orai1. Blue channel corresponds to DAPI. Merge image shows possible colocalization of SARAF with Orai1 as indicated by yellow color. (B,C) Representative images of fluorescence (20×; scale bar = 100 μm) in HUVECs using primary antibodies against Orai1 and SARAF (B: both; C: only Orai1) conjugated with the appropriate proximity ligation assay (PLA) probes. The bottom box is a zoom of (B and C) original images (20×). Red puncta indicate that proteins are in close proximity (<40 nm). HUVECs were cultured in the endothelial cell culture medium (EGM-2) enriched with growth factors, and nuclei are shown in blue as stained by DAPI.

Similar articles

Cited by

References

    1. Abdullaev I. F., Bisaillon J. M., Potier M., Gonzalez J. C., Motiani R. K., Trebak M. (2008). Stim1 and orai1 mediate crac currents and store-operated calcium entry important for endothelial cell proliferation. Circ. Res. 103 1289–1299. 10.1161/01.RES.0000338496.95579.56 - DOI - PMC - PubMed
    1. Adair T. H., Montani J. P. (2010). Overview of Angiogenesis. San Rafael, CA: Morgan & Claypool Life Sciences. - PubMed
    1. Albarran L., Lopez J. J., Amor N. B., Martin-Cano F. E., Berna-Erro A., Smani T., et al. (2016a). Dynamic interaction of SARAF with STIM1 and orai1 to modulate store-operated calcium entry. Sci. Rep. 6 1–11. 10.1038/srep24452 - DOI - PMC - PubMed
    1. Albarran L., Lopez J. J., Woodard G. E., Salido G. M., Rosado J. A. (2016b). Store-operated Ca2+ entry-associated regulatory factor (SARAF) plays an important role in the regulation of arachidonate-regulated Ca2+ (ARC) channels. J. Biol. Chem. 291 6982–6988. 10.1074/jbc.M115.704940 - DOI - PMC - PubMed
    1. Antigny F., Girardin N., Frieden M. (2012). Transient receptor potential canonical channels are required for in vitro endothelial tube formation. J. Biol. Chem. 287 5917–5927. 10.1074/jbc.M111.295733 - DOI - PMC - PubMed