Multi-Omics Analysis of Anlotinib in Pancreatic Cancer and Development of an Anlotinib-Related Prognostic Signature
- PMID: 33748143
- PMCID: PMC7969999
- DOI: 10.3389/fcell.2021.649265
Multi-Omics Analysis of Anlotinib in Pancreatic Cancer and Development of an Anlotinib-Related Prognostic Signature
Abstract
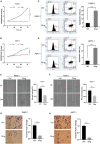
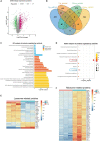
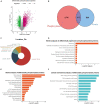
Aberrant regulation of angiogenesis involves in the growth and metastasis of tumors, but angiogenesis inhibitors fail to improve overall survival of pancreatic cancer patients in previous phase III clinical trials. A comprehensive knowledge of the mechanism of angiogenesis inhibitors against pancreatic cancer is helpful for clinical purpose and for the selection of patients who might benefit from the inhibitors. In this work, multi-omics analyses (transcriptomics, proteomics, and phosphoproteomics profiling) were carried out to delineate the mechanism of anlotinib, a novel angiogenesis inhibitor, against pancreatic cancer cells. The results showed that anlotinib exerted noteworthy cytotoxicity on pancreatic cancer cells. Multi-omics analyses revealed that anlotinib had a profound inhibitory effect on ribosome, and regulated cell cycle, RNA metabolism and lysosome. Based on the multi-omics results and available data deposited in public databases, an anlotinib-related gene signature was further constructed to identify a subgroup of pancreatic cancer patients who had a dismal prognosis and might be responsive to anlotinib.
Keywords: anlotinib; ingenuity pathway analysis; pancreatic cancer; phosphoproteomics; proteomics; transcriptomics.
Copyright © 2021 Zhang, Liu, Zhang, Tan, Zhang, Ou, Li and Song.
Conflict of interest statement
The authors declare that the research was conducted in the absence of any commercial or financial relationships that could be construed as a potential conflict of interest.
Figures


Similar articles
-
Anlotinib, a novel small molecular tyrosine kinase inhibitor, suppresses growth and metastasis via dual blockade of VEGFR2 and MET in osteosarcoma.Int J Cancer. 2019 Aug 15;145(4):979-993. doi: 10.1002/ijc.32180. Epub 2019 Feb 15. Int J Cancer. 2019. PMID: 30719715
-
Integration of transcriptomics and metabolomics reveals anlotinib-induced cytotoxicity in colon cancer cells.Gene. 2021 Jun 20;786:145625. doi: 10.1016/j.gene.2021.145625. Epub 2021 Mar 30. Gene. 2021. PMID: 33798683
-
Multi-omics study on the molecular mechanism of anlotinib in regulating tumor metabolism.Eur J Pharmacol. 2024 Jul 15;975:176639. doi: 10.1016/j.ejphar.2024.176639. Epub 2024 May 9. Eur J Pharmacol. 2024. PMID: 38729415
-
China National Medical Products Administration approval summary: anlotinib for the treatment of advanced non-small cell lung cancer after two lines of chemotherapy.Cancer Commun (Lond). 2019 Jun 20;39(1):36. doi: 10.1186/s40880-019-0383-7. Cancer Commun (Lond). 2019. PMID: 31221221 Free PMC article. Review.
-
Anlotinib: First Global Approval.Drugs. 2018 Jul;78(10):1057-1062. doi: 10.1007/s40265-018-0939-x. Drugs. 2018. PMID: 29943374 Review.
Cited by
-
A real-world study of anlotinib combined with GS regimen as first-line treatment for advanced pancreatic cancer.Front Endocrinol (Lausanne). 2023 Jan 20;14:1110624. doi: 10.3389/fendo.2023.1110624. eCollection 2023. Front Endocrinol (Lausanne). 2023. PMID: 36742383 Free PMC article.
-
Domestication and feedback: bidirectional hijacking in pancreatic ductal adenocarcinoma microenvironment.Front Immunol. 2025 Aug 11;16:1585858. doi: 10.3389/fimmu.2025.1585858. eCollection 2025. Front Immunol. 2025. PMID: 40861469 Free PMC article. Review.
-
Anlotinib plus tislelizumab for recurrent metastatic pancreas ductal adenocarcinoma with germline BRCA2 mutation: A case report.Exp Ther Med. 2024 Mar 1;27(5):178. doi: 10.3892/etm.2024.12466. eCollection 2024 May. Exp Ther Med. 2024. PMID: 38515651 Free PMC article.
-
Machine learning‑based construction of damage‑associated molecular patterns related score identifies subtypes of pancreatic adenocarcinoma with distinct prognosis.Oncol Lett. 2025 Mar 24;29(5):246. doi: 10.3892/ol.2025.14992. eCollection 2025 May. Oncol Lett. 2025. PMID: 40177138 Free PMC article.
-
First-line penpulimab (an anti-PD1 antibody) and anlotinib (an angiogenesis inhibitor) with nab-paclitaxel/gemcitabine (PAAG) in metastatic pancreatic cancer: a prospective, multicentre, biomolecular exploratory, phase II trial.Signal Transduct Target Ther. 2024 Jun 7;9(1):143. doi: 10.1038/s41392-024-01857-6. Signal Transduct Target Ther. 2024. PMID: 38844468 Free PMC article. Clinical Trial.
References
LinkOut - more resources
Full Text Sources
Other Literature Sources
Molecular Biology Databases

