Exploration of a Robust and Prognostic Immune Related Gene Signature for Cervical Squamous Cell Carcinoma
- PMID: 33748188
- PMCID: PMC7967036
- DOI: 10.3389/fmolb.2021.625470
Exploration of a Robust and Prognostic Immune Related Gene Signature for Cervical Squamous Cell Carcinoma
Abstract
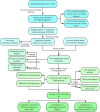
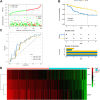
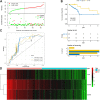
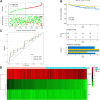
Background: Cervical squamous cell carcinoma (CESC) is one of the most frequent malignancies in women worldwide. The level of immune cell infiltration and immune-related genes (IRGs) can significantly affect the prognosis and immunotherapy of CESC patients. Thus, this study aimed to identify an immune-related prognostic signature for CESC. Methods: TCGA-CESC cohorts, obtained from TCGA database, were divided into the training group and testing group; while GSE44001 dataset from GEO database was viewed as external validation group. ESTIMATE algorithm was applied to evaluate the infiltration levels of immune cells of CESC patients. IRGs were screened out through weighted gene co-expression network analysis (WGCNA). A multi-gene prognostic signature based on IRGs was constructed using LASSO penalized Cox proportional hazards regression, which was validated through Kaplan-Meier, Cox, and receiver operating characteristic curve (ROC) analyses. The abundance of immune cells was calculated using ssGSEA algorithm in the ImmuCellAI database, and the response to immunotherapy was evaluated using immunophenoscore (IPS) analysis and the TIDE algorithm. Results: In TCGA-CESC cohorts, higher levels of immune cell infiltration were closely associated with better prognoses. Moreover, a prognostic signature was constructed using three IRGs. Based on this given signature, Kaplan-Meier analysis suggested the significant differences in overall survival (OS) and the ROC analysis demonstrated its robust predictive potential for CESC prognosis, further confirmed by internal and external validation. Additionally, multivariate Cox analysis revealed that the three IRGs signature served as an independent prognostic factor for CESC. In the three-IRGs signature low-risk group, the infiltrating immune cells (B cells, CD4/8 + T cells, cytotoxic T cells, macrophages and so on) were much more abundant than that in high-risk group. Ultimately, IPS and TIDE analyses showed that low-risk CESC patients appeared to present with a better response to immunotherapy and a better prognosis than high-risk patients. Conclusion: The present prognostic signature based on three IRGs (CD3E, CD3D, LCK) was not only reliable for survival prediction but efficient to predict the clinical response to immunotherapy for CESC patients, which might assist in guiding more precise individual treatment in the future.
Keywords: cervical squamous cell carcinoma; immune cells infiltration; immunotherapy sensitivity; prognosis; weighted gene co-expression network analysis.
Copyright © 2021 Zuo, Xiong, Zeng, Jiang, Xiong, Tao and Guo.
Conflict of interest statement
The authors declare that the research was conducted in the absence of any commercial or financial relationships that could be construed as a potential conflict of interest.
Figures




Similar articles
-
A Novel Prognostic Risk Model for Cervical Cancer Based on Immune Checkpoint HLA-G-Driven Differentially Expressed Genes.Front Immunol. 2022 Jul 18;13:851622. doi: 10.3389/fimmu.2022.851622. eCollection 2022. Front Immunol. 2022. PMID: 35924232 Free PMC article.
-
A prognostic signature based on immune-related genes for cervical squamous cell carcinoma and endocervical adenocarcinoma.Int Immunopharmacol. 2020 Nov;88:106884. doi: 10.1016/j.intimp.2020.106884. Epub 2020 Aug 11. Int Immunopharmacol. 2020. PMID: 32795900
-
Identification and validation of an immune prognostic signature in colorectal cancer.Int Immunopharmacol. 2020 Nov;88:106868. doi: 10.1016/j.intimp.2020.106868. Epub 2020 Aug 6. Int Immunopharmacol. 2020. PMID: 32771948
-
Comprehensive FGFR3 alteration-related transcriptomic characterization is involved in immune infiltration and correlated with prognosis and immunotherapy response of bladder cancer.Front Immunol. 2022 Jul 26;13:931906. doi: 10.3389/fimmu.2022.931906. eCollection 2022. Front Immunol. 2022. PMID: 35958598 Free PMC article.
-
Constructing and validating a risk model based on neutrophil-related genes for evaluating prognosis and guiding immunotherapy in colon cancer.J Gene Med. 2024 Apr;26(4):e3684. doi: 10.1002/jgm.3684. J Gene Med. 2024. PMID: 38618694 Review.
Cited by
-
Tertiary lymphoid structure patterns predicted anti-PD1 therapeutic responses in gastric cancer.Chin J Cancer Res. 2022 Aug 30;34(4):365-382. doi: 10.21147/j.issn.1000-9604.2022.04.05. Chin J Cancer Res. 2022. PMID: 36199531 Free PMC article.
-
Integrated Analysis of Stemness-Related LncRNAs Helps Predict the Immunotherapy Responsiveness of Gastric Cancer Patients.Front Cell Dev Biol. 2021 Sep 13;9:739509. doi: 10.3389/fcell.2021.739509. eCollection 2021. Front Cell Dev Biol. 2021. PMID: 34589496 Free PMC article.
-
A Novel Prognostic Risk Model for Cervical Cancer Based on Immune Checkpoint HLA-G-Driven Differentially Expressed Genes.Front Immunol. 2022 Jul 18;13:851622. doi: 10.3389/fimmu.2022.851622. eCollection 2022. Front Immunol. 2022. PMID: 35924232 Free PMC article.
-
Characterization of Exosome-Related Gene Risk Model to Evaluate the Tumor Immune Microenvironment and Predict Prognosis in Triple-Negative Breast Cancer.Front Immunol. 2021 Oct 1;12:736030. doi: 10.3389/fimmu.2021.736030. eCollection 2021. Front Immunol. 2021. PMID: 34659224 Free PMC article.
-
A Novel Eight-Gene Signature for Lipid Metabolism Predicts the Progression of Cervical Squamous Cell Carcinoma and Endocervical Adenocarcinoma.Reprod Sci. 2024 Feb;31(2):514-531. doi: 10.1007/s43032-023-01364-z. Epub 2023 Sep 25. Reprod Sci. 2024. PMID: 37749448
References
LinkOut - more resources
Full Text Sources
Other Literature Sources
Research Materials
Miscellaneous

