

Nicotinamide Ameliorates Dextran Sulfate Sodium-Induced Chronic Colitis in Mice through Its Anti-Inflammatory Properties and Modulates the Gut Microbiota
- PMID: 33748287
- PMCID: PMC7959969
- DOI: 10.1155/2021/5084713
Nicotinamide Ameliorates Dextran Sulfate Sodium-Induced Chronic Colitis in Mice through Its Anti-Inflammatory Properties and Modulates the Gut Microbiota
Abstract
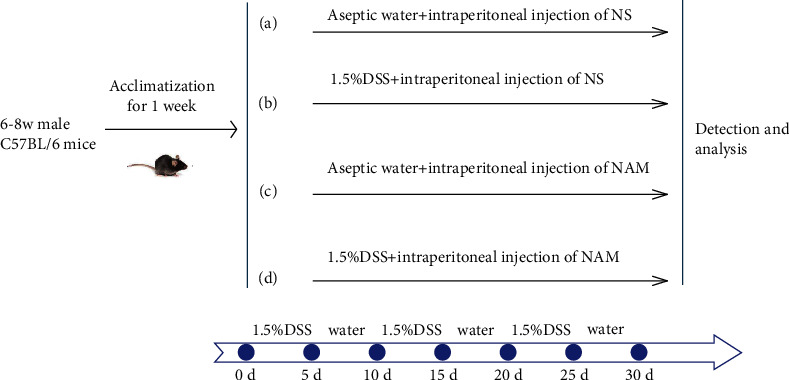
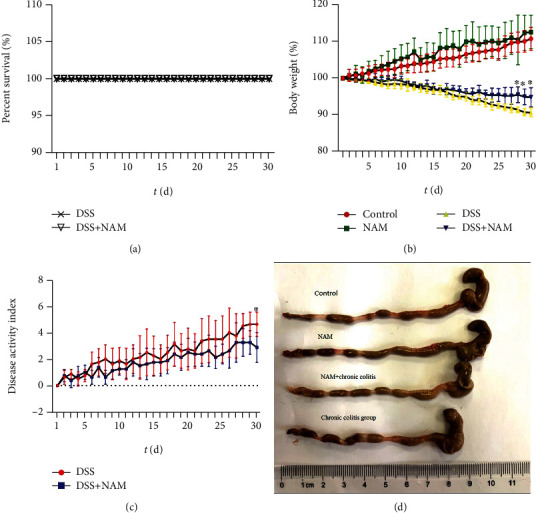
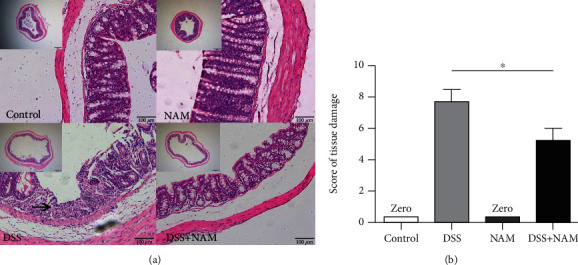
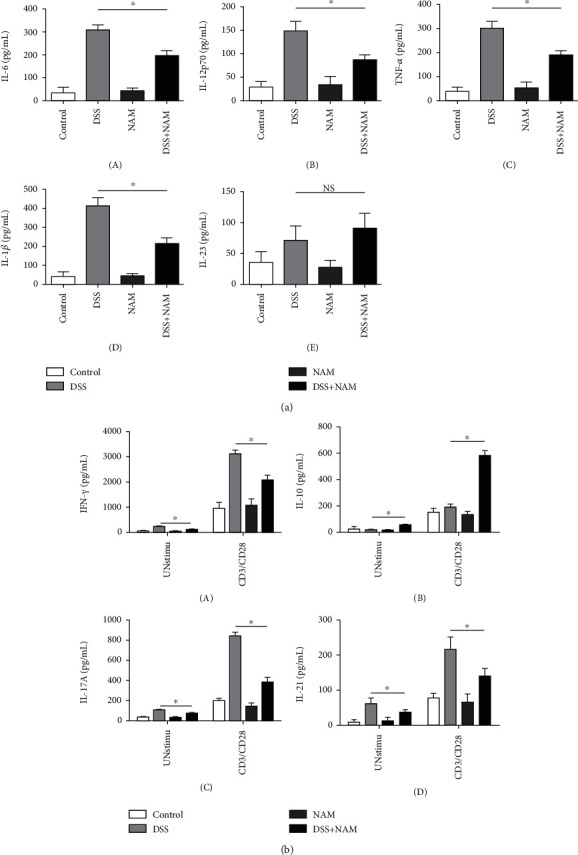
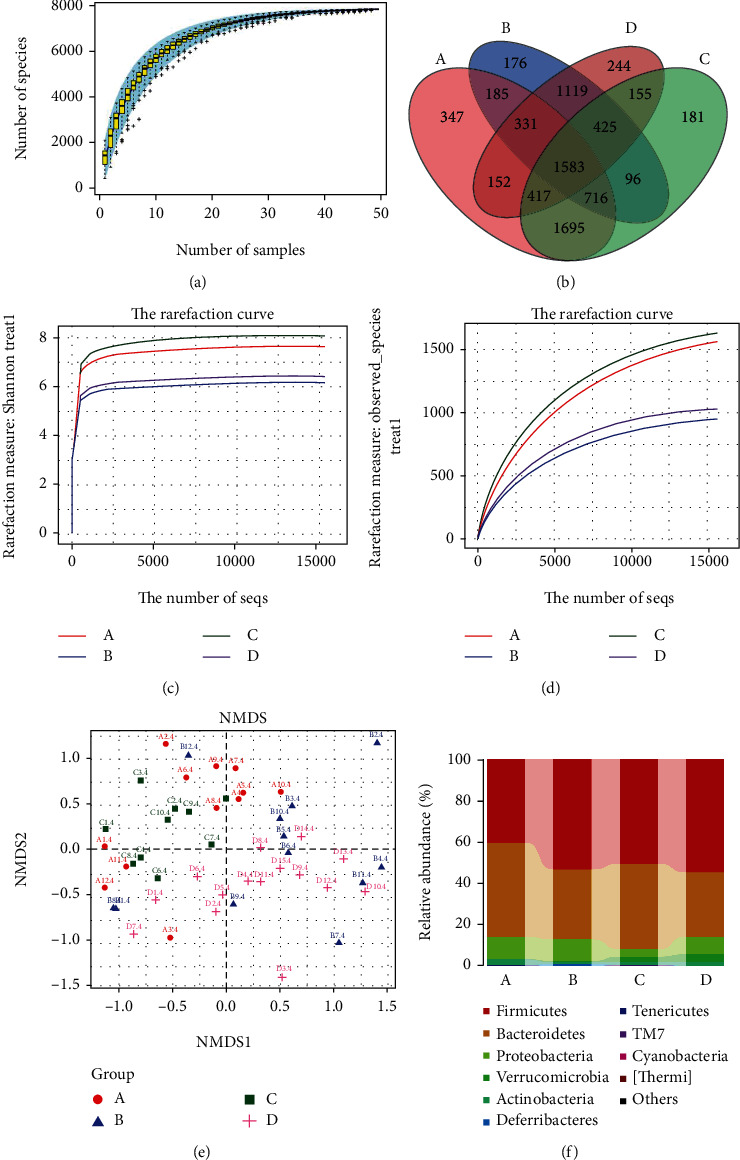
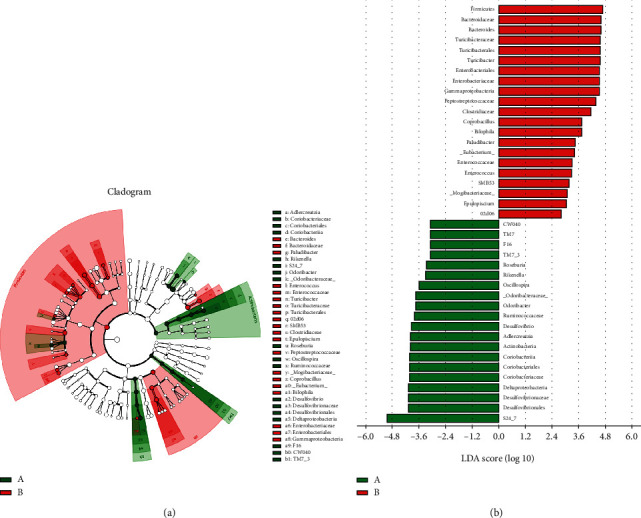
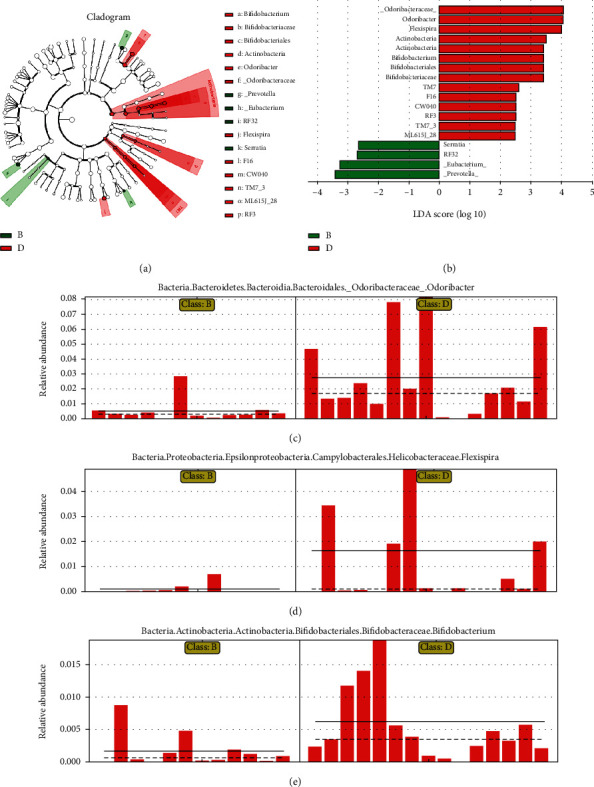
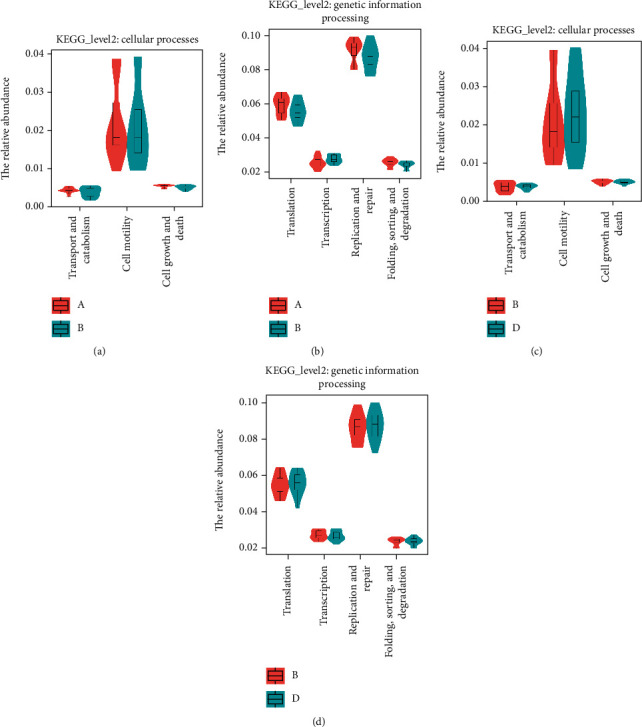
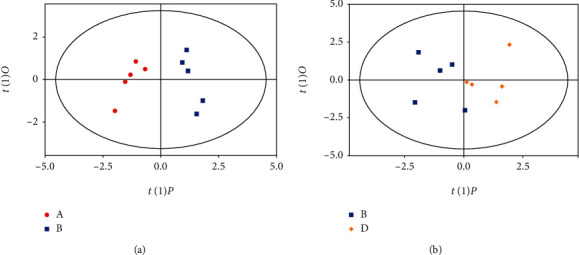
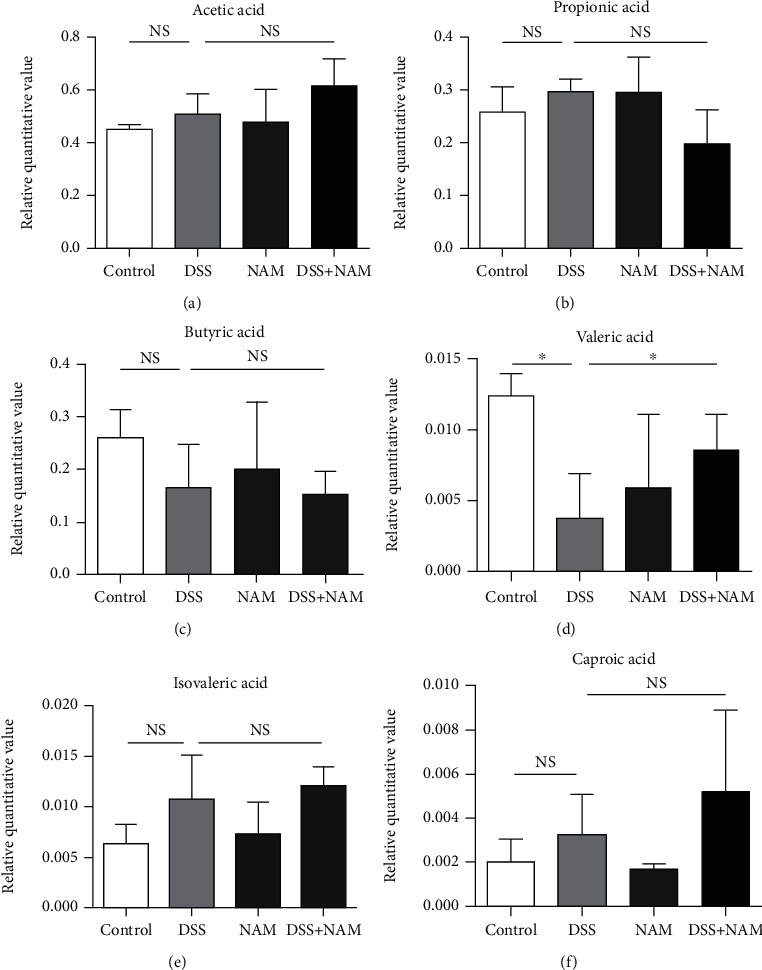
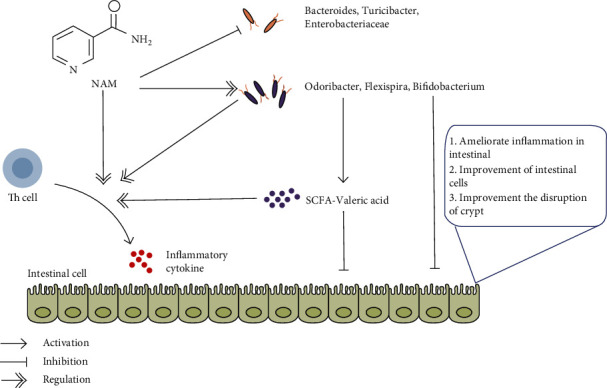
Vitamin B (nicotinamide (NAM)), one of the most important nutritional components for humans, exerts anti-inflammatory activity. This study was aimed at investigating the effect of NAM on the gut microbiota and short-chain fatty acids (SCFAs) in mice with chronic colitis. Colitis was induced in C57BL/6 male mice by administration of 1.5% dextran sulfate sodium (DSS), and the mice were intraperitoneally injected with normal saline (NS) or NAM. NAM treatment ameliorated weight loss and changes in colon length, disease activity index (DAI) score, and histologic scores. Moreover, enzyme-linked immunosorbent assay (ELISA) analysis of LPL cells revealed that the level of interleukin- (IL-) 6, IL-12p70, IL-1β, tumor necrosis factor- (TNF-) α, interferon- (IFN-) γ, IL-21, and IL-17A was increased, while IL-10 was reduced, in the chronic colitis group compared to the control group, but the levels of all these factors were restored after NAM treatment. Then, 16S rRNA sequencing of the large intestinal content was performed, and analysis of alpha diversity and beta diversity showed that the richness of the gut microbiota was decreased in the DSS group compared to the control group and restored after NAM treatment. In addition, NAM modulated specific bacteria, including Odoribacter, Flexispira, and Bifidobacterium, in the NAM+chronic colitis group. Phylogenetic Investigation of Communities by Reconstruction of Unobserved States (PICRUSt) analysis indicated that NAM treatment restored disruptions in the functions of the gut microbiota (replication and repair, cell motility) in mice with DSS-induced colitis. Furthermore, NAM also restored the reduction in valeric acid in mice with DSS-induced chronic colitis. Our results suggest that NAM treatment could alleviate DSS-induced chronic colitis in mice by inhibiting inflammation and regulating the composition and function of gut microbiota.
Copyright © 2021 Kai Kang et al.
Conflict of interest statement
The authors declare that there are no conflict of interests related to this study.
Figures
Similar articles
-
Heat-Killed Bifidobacterium bifidum B1628 May Alleviate Dextran Sulfate Sodium-Induced Colitis in Mice, and the Anti-Inflammatory Effect Is Associated with Gut Microbiota Modulation.Nutrients. 2022 Dec 8;14(24):5233. doi: 10.3390/nu14245233. Nutrients. 2022. PMID: 36558391 Free PMC article.
-
Barley Leaf Insoluble Dietary Fiber Alleviated Dextran Sulfate Sodium-Induced Mice Colitis by Modulating Gut Microbiota.Nutrients. 2021 Mar 5;13(3):846. doi: 10.3390/nu13030846. Nutrients. 2021. PMID: 33807544 Free PMC article.
-
Pediococcus pentosaceus CECT 8330 protects DSS-induced colitis and regulates the intestinal microbiota and immune responses in mice.J Transl Med. 2022 Jan 15;20(1):33. doi: 10.1186/s12967-022-03235-8. J Transl Med. 2022. PMID: 35033121 Free PMC article.
-
Research progress of natural plant polysaccharides inhibiting inflammatory signaling pathways and regulating intestinal flora and metabolism to protect inflammatory bowel disease.Int J Biol Macromol. 2023 Dec 31;253(Pt 4):126799. doi: 10.1016/j.ijbiomac.2023.126799. Epub 2023 Sep 12. Int J Biol Macromol. 2023. PMID: 37703965 Review.
-
The role of gut microbiota in modulating immune responses in chronic liver disease: a systematic review and meta-analysis.Front Immunol. 2025 May 16;16:1556576. doi: 10.3389/fimmu.2025.1556576. eCollection 2025. Front Immunol. 2025. PMID: 40453092 Free PMC article.
Cited by
-
Potential Modulation of Inflammation by Probiotic and Omega-3 Supplementation in Elderly with Chronic Low-Grade Inflammation-A Randomized, Placebo-Controlled Trial.Nutrients. 2022 Sep 27;14(19):3998. doi: 10.3390/nu14193998. Nutrients. 2022. PMID: 36235651 Free PMC article. Clinical Trial.
-
Dietary Supplementation of Crossbred Pigs with Glycerol, Vitamin C, and Niacinamide Alters the Composition of Gut Flora and Gut Flora-Derived Metabolites.Animals (Basel). 2024 Jul 28;14(15):2198. doi: 10.3390/ani14152198. Animals (Basel). 2024. PMID: 39123724 Free PMC article.
-
NAD+ Precursors and Intestinal Inflammation: Therapeutic Insights Involving Gut Microbiota.Nutrients. 2023 Jun 30;15(13):2992. doi: 10.3390/nu15132992. Nutrients. 2023. PMID: 37447318 Free PMC article. Review.
-
Mechanistic Insights into the Multiple Functions of Niacinamide: Therapeutic Implications and Cosmeceutical Applications in Functional Skincare Products.Antioxidants (Basel). 2024 Mar 30;13(4):425. doi: 10.3390/antiox13040425. Antioxidants (Basel). 2024. PMID: 38671873 Free PMC article. Review.
-
4-Pyridone-3-carboxamide-1-β-D-ribonucleoside Reduces Cyclophosphamide Effects and Induces Endothelial Inflammation in Murine Breast Cancer Model.Int J Mol Sci. 2024 Dec 24;26(1):35. doi: 10.3390/ijms26010035. Int J Mol Sci. 2024. PMID: 39795893 Free PMC article.
References
MeSH terms
Substances
LinkOut - more resources
Full Text Sources
Other Literature Sources
Miscellaneous
