. 2021 Mar 13;7(3):e06408.
doi: 10.1016/j.heliyon.2021.e06408. eCollection 2021 Mar.

DNA repair pathway activation features in follicular and papillary thyroid tumors, interrogated using 95 experimental RNA sequencing profiles

Affiliations

DNA repair pathway activation features in follicular and papillary thyroid tumors, interrogated using 95 experimental RNA sequencing profiles

Uliana Vladimirova et al. Heliyon. .

Abstract

DNA repair can prevent mutations and cancer development, but it can also restore damaged tumor cells after chemo and radiation therapy. We performed RNA sequencing on 95 human pathological thyroid biosamples including 17 follicular adenomas, 23 follicular cancers, 3 medullar cancers, 51 papillary cancers and 1 poorly differentiated cancer. The gene expression profiles are annotated here with the clinical and histological diagnoses and, for papillary cancers, with BRAF gene V600E mutation status. DNA repair molecular pathway analysis showed strongly upregulated pathway activation levels for most of the differential pathways in the papillary cancer and moderately upregulated pattern in the follicular cancer, when compared to the follicular adenomas. This was observed for the BRCA1, ATM, p53, excision repair, and mismatch repair pathways. This finding was validated using independent thyroid tumor expression dataset PRJEB11591. We also analyzed gene expression patterns linked with the radioiodine resistant thyroid tumors (n = 13) and identified 871 differential genes that according to Gene Ontology analysis formed two functional groups: (i) response to topologically incorrect protein and (ii) aldo-keto reductase (NADP) activity. We also found RNA sequencing reads for two hybrid transcripts: one in-frame fusion for well-known NCOA4-RET translocation, and another frameshift fusion of ALK oncogene with a new partner ARHGAP12. The latter could probably support increased expression of truncated ALK downstream from 4th exon out of 28. Both fusions were found in papillary thyroid cancers of follicular histologic subtype with node metastases, one of them (NCOA4-RET) for the radioactive iodine resistant tumor. The differences in DNA repair activation patterns may help to improve therapy of different thyroid cancer types under investigation and the data communicated may serve for finding additional markers of radioiodine resistance.

Keywords: DNA repair; Follicular thyroid adenoma; Molecular biomarkers; Molecular pathway analysis; Papillary thyroid cancer; Personalized medicine; RNA sequencing; Radiation iodine therapy resistance; Systems biology; Thyroid cancer.


Conflict of interest statement

The authors declare no conflict of interest.

Figures

Figure 1
Figure 1
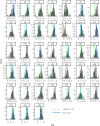
Differential expression of previously reported marker genes in different thyroid tumor types. Genes SERPINA1, TACSTD2, LAMB3 were reported as the markers upregulated in PC; genes ACVRL1, PLVAP, TFF3 and CPQ were reported as the markers upregulated in FA. Each box shows gene expression distribution in each group, the ends of the box are the upper and lower quartiles, median in shown by horizontal line inside the boxes, whiskers extend from the upper and lower hinges of the boxes towards the highest and lowest values, respectively, at most 1.5 ∗ interquartile range of box. A black point corresponds to a tissue sample. Expression counts were processed as reads per million (RPM).
Figure 2
Figure 2
Differential expression of gene SLC5A5 in radioactive iodine resistant, sensitive and all other thyroid tumors. Expression – DESeq2 normalized read counts. Gene expression values for radioactive iodine resistant tumors (radioresistance), sensitive (radiosensitivity) thyroid tumors and tumors with undefined radioactive iodine therapy status profiled in this study are boxed. Gene expression is plotted in the log10-trasformed scale. Each box shows gene expression distribution in each group, the ends of the box are the upper and lower quartiles, median in shown by horizontal line inside the boxes, whiskers extend from the upper and lower hinges of the boxes towards the highest and lowest values, respectively, at most 1.5 ∗ interquartile range of box. A black point corresponds to a tissue sample. Drawn using ggplot package in R.
Figure 3
Figure 3
BRAF V600E mutation status in PC samples. A – plot for principle component analysis in normalized gene expression space for all PC profiles investigated. B – hierarchical clustering based on Euclidian distance in gene space in relation to BRAF V600E mutation status. Drawn using ggplot package in R, clustering algorithm “ward.d2”. Expression counts were normalized with DESeq2.
Figure 4
Figure 4
Boxplot representation of PAL values for the differential pathways corresponding to comparisons from Table 1. Pathway name abbreviations: p1 - ATM Pathway, p2 - ATM Pathway Cell Survival, p3 - ATM Pathway G2-Mitosis progression, p5 - Biocarta cell cycle G2M checkpoint pathway, p6 - BRCA1 Pathway, p11 - KEGG Base excision repair pathway, p12 - KEGG Mismatch repair pathway, p13 - KEGG Nucleotide excision repair pathway, p18 - NCI ATM pathway, p19 - NCI ATM Pathway (G1 S transition checkpoint), p30 - Nucleotide excision repair effect, p31 - p53 Signaling Pathway, p33 - p53 Signaling Pathway Gene Expression DNA Replication and Repair via TP53, p36 - Reactome Mismatch repair MMR directed by MSH2, MSH3, MutS beta pathway, p37 - Reactome Mismatch repair MMR directed by MSH2, MSH6, MutS alpha pathway.
Figure 5
Figure 5
Heatmap of pathway activation levels for 15 differential DNA repair pathways in all thyroid tumor samples investigated.
Figure 6
Figure 6
Radar-charts of 15 differential DNA repair pathway activation profile for (A) follicular adenoma, ANTE normal samples used for PAL calculation, (B) follicular adenoma, GTEx normal samples used for PAL calculation, (C) follicular adenoma, TCGA normal samples used for PAL calculation, (D) follicular cancer, ANTE normal samples used for PAL calculation, (E) follicular cancer, CTEx normal samples used for PAL calculation, (F) follicular cancer, TCGA normal samples used for PAL calculation, (G) papillary cancer, ANTE normal samples used for PAL calculation, (H) papillary cancer, GTEx normal samples used for PAL calculation, (I) papillary cancer, TCGA normal samples used for PAL calculation. Positive pathway activation values (PALs) are shown in the outer white area, negative values –in the inner red circle area.
Figure 7
Figure 7
Principal component analysis of gene expression profiles for experimental thyroid tumor samples, and normal thyroid tissue samples from ANTE, GTEx and TCGA databases.
Figure 8
Figure 8
Reconstructed differential DNA repair molecular network for the comparison of Papillary cancer (PC) vs Follicular cancer (FC). Node Fold Change for each node was calculated as the sum of fold changes for the genes which were included in the node. Fold change for each gene was calculated by taking logarithm base 2 of ratio of geometric means of gene expression in compared groups. Green nodes represent genes that are up-regulated in PC (down-regulated in FC); red nodes - genes that are down-regulated in PC (up-regulated in FC). Arrow color indicates type of interaction. Shape of a node reflects source molecular pathway(s). Asterisks (∗) indicate nodes which include differential genes (PC vs FC) with q-value <0.05; double asterisks (∗∗) - nodes which include differential genes with q < 0.01. ATM pathway represented here also includes its differentially regulated branches that can be considered as separate pathways: ATM Pathway Cell Survival and ATM Pathway G2-Mitosis progression.
Figure 9
Figure 9
Reconstructed differential DNA repair molecular network for the comparison of Follicular and Papillary cancers (FC + PC) vs Follicular adenoma (FA). Node Fold Change for each node was calculated as the sum of fold changes of the genes which were included in the node. Fold change for each gene was calculated by taking logarithm base 2 of ratio of geometric means of gene expression in compared groups. Green nodes represent genes that are up-regulated in FC + PC (down-regulated in FA); red nodes – genes that are down-regulated in FC + PC (up-regulated in FA). Arrow color indicates type of interaction. Shape of a node reflects source molecular pathway(s). Asterisks (∗) indicate nodes which include differential genes (FC + PC vs FA) with q-value <0.05; double asterisks (∗∗) - nodes which include differential genes with q < 0.01. NCI ATM pathway represented here also includes its differentially regulated branch that can be considered as separate pathway - G1 S transition checkpoint.
Figure 10
Figure 10
Reconstructed differential DNA repair molecular network for the comparison of Papillary cancer (PC) vs Follicular adenoma (FA). Node Fold Change for each node was calculated as the sum of fold changes of the genes which were included in the node. Fold change for each gene was calculated by taking logarithm base 2 of ratio of geometric means of gene expression in compared groups. Green nodes represent genes that are up-regulated in PC (down-regulated in FA); red nodes – genes that are down-regulated in PC (up-regulated in FA). Arrow color indicates type of interaction. Shape of a node reflects source molecular pathway(s). Asterisks (∗) indicate nodes which include differential genes (PC vs FA) with q-value <0.05; double asterisks (∗∗) - nodes which include differential genes with q < 0.01. ATM pathway, NCI ATM pathway, and p53 signaling pathway represented here also include their differentially regulated branches that can be considered as separate pathways: Cell Survival, G1 S transition checkpoint, and Gene Expression DNA Replication and Repair via TP53, accordingly.
Figure 11
Figure 11
Correlation of expression at transcriptome and proteome levels for ATM, BRCA1, H2AFX, and TP53 genes in six human cancer types.
Figure 12
Figure 12
Average PAL values for 36 differential DNA repair pathways. (A) calculated using PRJEB11591 dataset for follicular adenoma (FA), follicular cancer (FC), follicular variant of papillary cancer (FV), classical variant of papillary cancer (PC) and their matched adjacent pathologically normal tissues: FA.N, FC.N, FV.N, PC.N, respectively. Pathway name abbreviations: p1 - ATM Pathway, p2 - ATM Pathway Cell Survival, p3 - ATM Pathway G2-Mitosis progression, p4 - Biocarta atm signaling pathway, p5 - Biocarta cell cycle G2M checkpoint pathway, p6 - BRCA1 Pathway, p7 - BRCA1 Pathway Chromatin Remodeling, p8 - BRCA1 Pathway Homologous Recombination Repair, p9 - BRCA1 Pathway Mismatch Repair, p10 - DNA Repair Mechanisms Pathway, p11 - KEGG Base excision repair pathway, p12 - KEGG Fanconi anemia pathway, p13 - KEGG Homologous recombination pathway, p14 - KEGG Mismatch repair pathway, p15 - KEGG Non homologous end joining pathway, p16 - KEGG Nucleotide excision repair pathway, p17 - Mismatch Repair in Eukaryotes Pathway, p18 - NCI ATM pathway, p19 - NCI ATM Pathway (G1 S transition checkpoint), p20 - NCI ATR signaling pathway, p21 - NCI ATR signaling Pathway (Pathway negative regulation of transcription during mitosis via CHEK1), p22 - NCI ATR signaling Pathway (regulation of double strand break repair via homologous recombination), p23 - NCI ATR signaling Pathway (response to G2 M transition DNA damage checkpoint signal), p24 - NCI DNA PK pathway in nonhomologous end joining Pathway (double strand break repair via nonhomologous end joining), p25 - NCI DNA PK pathway in nonhomologous end joining Pathway (V D J recombination), p26 - NCI Fanconi anemia pathway, p27 - NCI Fanconi anemia Pathway (regulation of double strand break repair via homologous recombination), p28 - NCI Fanconi anemia Pathway (Sister Chromatid Exchange Process), p29 - NHEJ mechanisms of DSBs repair effect, p30 - Nucleotide excision repair effect, p31 - p53 Signaling Pathway, p33 - p53 Signaling Pathway Gene Expression DNA Replication and Repair via TP53, p34 - reactome Fanconi Anemia pathway, p36 - Reactome Mismatch repair MMR directed by MSH2, MSH3, MutS beta pathway, p37 - Reactome Mismatch repair MMR directed by MSH2, MSH6, MutS alpha pathway, p38 - Reactome Repair synthesis for gap filling by DNA polymerase in TC NER pathway. (B) Average PAL for tumor tissues and the corresponding adjacent pathologically normal tissues. Each dot represents a "pathway – thyroid tumor type" case, totally 144 cases represented (36 pathways in four tumor types).
Figure 13
Figure 13
(A) Boxplot representation of logarithmic expression of APOBEC genes in thyroid tumor types: FA (n = 17), FC (n = 23), PC (n = 51). q-value of Kruskel-Wallis test is shown. Asterisks (∗) indicate differential pairs of cancer types with Wilcoxon–test p-value <0.05; double asterisks (∗∗) - with p-value <0.01. (B) APOBEC gene signature for three thyroid tumor types: FA (n = 17), FC (n = 23), PC (n = 51). Double asterisks (∗∗) denote pairs with p-value <0.01 by Wilcoxon–test.
Figure 14
Figure 14
Statistically significantly enriched gene ontology (GO) molecular processes (GO-terms) identified for 871 differential genes between radioiodine resistant cancers and other thyroid cancer samples. Differential gene names are shown in red. Circle size inversely reflects FDR-adjusted p-value for a differential GO-term identified. Filled part of a circle represents percentage share of matched differential genes in gene set of the respective GO-term. Links between the terms are taken from the STRING database.
Figure 15
Figure 15
Schematic representation of NCOA4-RET fusion transcript identified. A, gene structures upstream and downstream of fusion site. B, RET gene exon coverage by normalized RNA sequencing reads in RAIR4 sample.
Figure 16
Figure 16
Schematic representation of ARHGAP12-ALK fusion transcript identified. (A) gene structures upstream and downstream of fusion site. (B) ALK gene exon coverage by normalized RNA sequencing reads in TC12 sample.
Figure 17
Figure 17
PAL distribution for 38 DNA repair pathways in experimental thyroid tumor samples. Color denotes samples with gene fusions. Pathway name abbreviations: p1 - ATM Pathway, p2 - ATM Pathway Cell Survival, p3 - ATM Pathway G2-Mitosis progression, p4 - Biocarta atm signaling pathway, p5 - Biocarta cell cycle G2M checkpoint pathway, p6 - BRCA1 Pathway, p7 - BRCA1 Pathway Chromatin Remodeling, p8 - BRCA1 Pathway Homologous Recombination Repair, p9 - BRCA1 Pathway Mismatch Repair, p10 - DNA Repair Mechanisms Pathway, p11 - KEGG Base excision repair pathway, p12 - KEGG Fanconi anemia pathway, p13 - KEGG Homologous recombination pathway, p14 - KEGG Mismatch repair pathway, p15 - KEGG Non homologous end joining pathway, p16 - KEGG Nucleotide excision repair pathway, p17 - Mismatch Repair in Eukaryotes Pathway, p18 - NCI ATM pathway, p19 - NCI ATM Pathway (G1 S transition checkpoint), p20 - NCI ATR signaling pathway, p21 - NCI ATR signaling Pathway (Pathway negative regulation of transcription during mitosis via CHEK1), p22 - NCI ATR signaling Pathway (regulation of double strand break repair via homologous recombination), p23 - NCI ATR signaling Pathway (response to G2 M transition DNA damage checkpoint signal), p24 - NCI DNA PK pathway in nonhomologous end joining Pathway (double strand break repair via nonhomologous end joining), p25 - NCI DNA PK pathway in nonhomologous end joining Pathway (V D J recombination), p26 - NCI Fanconi anemia pathway, p27 - NCI Fanconi anemia Pathway (regulation of double strand break repair via homologous recombination), p28 - NCI Fanconi anemia Pathway (Sister Chromatid Exchange Process), p29 - NHEJ mechanisms of DSBs repair effect, p30 - Nucleotide excision repair effect, p31 - p53 Signaling Pathway, p32 - p53 Signaling Pathway DNA Repair, p33 - p53 Signaling Pathway Gene Expression DNA Replication and Repair via TP53, p34 - reactome Fanconi Anemia pathway, p35 - Reactome Formation of transcription coupled NER TC NER repair complex pathway, p36 - Reactome Mismatch repair MMR directed by MSH2, MSH3, MutS beta pathway, p37 - Reactome Mismatch repair MMR directed by MSH2, MSH6, MutS alpha pathway, p38 - Reactome Repair synthesis for gap filling by DNA polymerase in TC NER pathway.
Figure 18
Figure 18
Representative microphotographs of eosin-hematoxylin stained histology preparations of different thyroid tumor types. A – papillary thyroid cancer (TC), magnification X200, sample ID: TC_65; B - Follicular thyroid cancer (FC), magnification X50, sample ID: TC_119; C – Follicular adenoma (FA), magnification X100, sample ID: TC_22; D – medullary thyroid cancer (MC), magnification X50, sample ID: TC_17.
Figure 19
Figure 19
Quality control of RNA sequencing profiles. A - fastQC per base quality score for sample TC76. The plot was drawn using fastQC software. B - fastQC per sequence quality score for sample TC76. The plot was drawn using fastQC software. C - plot for principal component analysis in normalized gene expression space (lg(RPM)) for all RNA sequencing profiles investigated. The plot was drawn using graphics package in R language. D - hierarchical clustering of all RNA sequencing profiles based on Euclidian distance in normalized gene expression space (lg(RPM)). The plot was drawn using pheatmap package in R, clustering algorithm “ward.d2”.
Figure 20
Figure 20
Comparison of RNA sequencing gene expression profiles of two technical replicates: for TC-63 sample (A), and for TC-116 sample (B). Clustering dendrogram of experimental tumor samples expression profiles (C), technical replicates are shown in color.

Similar articles

Cited by

References

    1. La Vecchia C., Malvezzi M., Bosetti C., Garavello W., Bertuccio P., Levi F., Negri E. Thyroid cancer mortality and incidence: a global overview. Int. J. Canc. 2015;136:2187–2195. - PubMed
    1. Cabanillas M.E., McFadden D.G., Durante C. Thyroid cancer. Lancet. 2016;388:2783–2795. - PubMed
    1. Rahib L., Smith B.D., Aizenberg R., Rosenzweig A.B., Fleshman J.M., Matrisian L.M. Projecting cancer incidence and deaths to 2030: the unexpected burden of thyroid, liver, and pancreas cancers in the United States. Canc. Res. 2014;74:2913–2921. - PubMed
    1. Asa S.L. The current histologic classification of thyroid cancer. Endocrinol Metab. Clin. N. Am. 2019;48:1–22. - PubMed
    1. Younis E. Oncogenesis of thyroid cancer. Asian Pac. J. Cancer Prev. APJCP. 2017;18:1191–1199. - PMC - PubMed