. 2021 Mar 12;7(3):e06474.
doi: 10.1016/j.heliyon.2021.e06474. eCollection 2021 Mar.

Melatonin protects the heart and pancreas by improving glucose homeostasis, oxidative stress, inflammation and apoptosis in T2DM-induced rats

Affiliations

Melatonin protects the heart and pancreas by improving glucose homeostasis, oxidative stress, inflammation and apoptosis in T2DM-induced rats

Doaa A Abdulwahab et al. Heliyon. .

Abstract

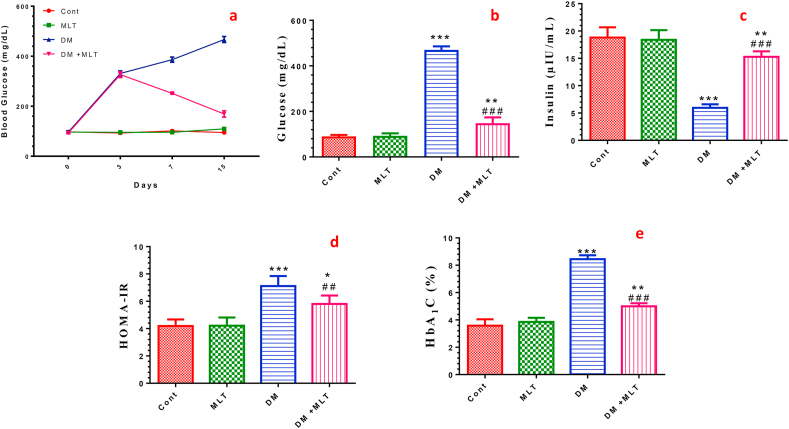
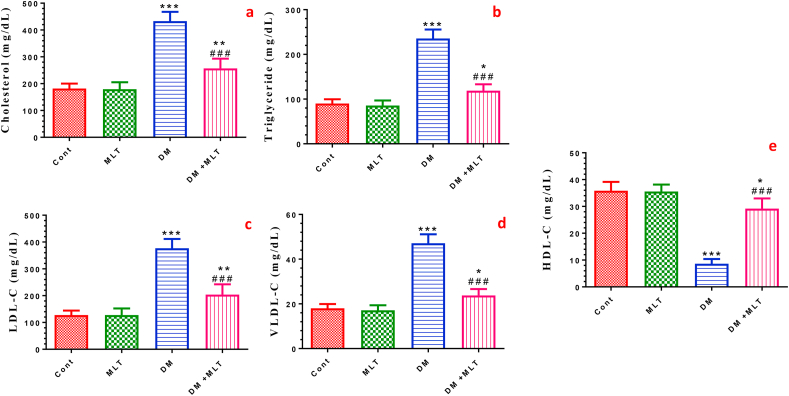
Cardiomyopathy and pancreatic injury are health issues associated with type 2 diabetes mellitus (T2DM) and are characterized by elevated oxidative stress, inflammation and apoptosis. Melatonin (MLT) is a hormone with multifunctional antioxidant activity. The protective effects of MLT on the heart and pancreas during the early development of diabetic cardiomyopathy and pancreatic injury were investigated in male Wistar rats with T2DM. MLT (10 mg/kg) was administered daily by gavage for 15 days after diabetic induction. Treatment of diabetic rats with MLT significantly normalized the levels of serum glucose, HbA1-c, and the lipid profile and improved the insulin levels and insulin resistance compared with diabetic rats, affirming its antidiabetic effect. MLT significantly prevented the development of oxidative stress and sustained the levels of glutathione and glutathione peroxidase activity in the heart and pancreas of diabetic animals, indicating its antioxidant capacity. Additionally, MLT prevented the increase in proinflammatory cytokines and expression of Bax, caspase-3 and P53. Furthermore, MLT enhanced the anti-inflammatory cytokine IL-10 and antiapoptotic protein Bcl-2. MLT controlled the levels of troponin T and creatine kinase-MB and lactate dehydrogenase activity, indicating its anti-inflammatory and antiapoptotic effects. Histological examinations confirmed the protective effects of MLT on T2DM-induced injury in the myocardium, pancreas and islets of Langerhans. In conclusion, the protective effects of melatonin on the heart and pancreas during the early development of T2DM are attributed to its antihyperglycemic, antilipidemic and antioxidant influences as well as its remarkable anti-inflammatory and antiapoptotic properties.

Keywords: Heart; Hyperglycemia; Inflammatory cytokines; Melatonin; Oxidative stress; Pancreas.


Conflict of interest statement

The authors declare no conflict of interest.

Figures

Figure 1
Figure 1
Diagram of the experimental design.
Figure 2
Figure 2
Effect of diabetes (DM) and melatonin (MLT) on the fasting blood glucose levels at the indicated time points (a), serum glucose (b), insulin (c), insulin resistance index (HOMA-IR) (d) and glycosylated hemoglobin (HbA1C) (e) levels of rats in the different groups. Values are expressed as means ± SEM; (n = 10) for fasting blood glucose and n = 5 for other parameters. (∗, ∗∗ and ∗∗∗ indicate statistical significance at P < 0.05, P < 0.01 and P < 0.001, respectively, compared to the control group. ## and ### indicate statistical significance at P < 0.01 and P < 0.001, respectively, compared to the diabetic group).
Figure 3
Figure 3
Effect of DM and MLT on the lipid profiles. Total cholesterol (a), triglyceride (b), low-density lipoprotein (LDL-C) (c), very low-density lipoprotein (VLDL-C) (d) and high-density lipoprotein (HDL-C) (e) serum levels of rats in the different groups. Values are expressed as means ± SEM; (n = 5). (∗, ∗∗ and ∗∗∗ indicate statistical significance at P < 0.05, P < 0.01 and P < 0.001, respectively, compared to the control group. ### indicate statistical significance at P < 0.001, respectively, compared to the diabetic group).
Figure 4
Figure 4
Effect of DM and MLT on the oxidative stress marker 4-hydroxynonenal (4-HNE) (a), antioxidant glutathione (GSH) content (c) and glutathione peroxidase (GPx) activity (e) in the heart tissues of rats in the different groups. Additionally, the effect of DM and MLT on the oxidative stress marker 4-hydroxynonenal (4-HNE) (b), antioxidant glutathione (GSH) content (d) and glutathione peroxidase (GPx) activity (f) in the pancreatic tissues of rats in the different groups. Values are expressed as means ± SEM; (n = 5). (∗, ∗∗ and ∗∗∗ indicate statistical significance at P < 0.05, P < 0.01 and P < 0.001, respectively, compared to the control group. ### indicate statistical significance at P < 0.001, respectively, compared to the diabetic group).
Figure 5
Figure 5
Effect of DM and MLT on the serum levels of pro-inflammatory mediators. Tumor necrosis factor alpha (TNF-α) (a), interleukin 6 (IL-6) (b), interleukin 1 beta (IL-1β) (c) and anti-inflammatory cytokine interleukin 10 (IL-10) (d) of rats in the different groups. Values are expressed as means ± SEM; (n = 5). (∗, ∗∗ and ∗∗∗ indicate statistical significance at P < 0.05, P < 0.01 and P < 0.001, respectively, compared to the control group. ### indicate statistical significance at P < 0.001, respectively, compared to the diabetic group).
Figure 6
Figure 6
Effect of DM and MLT on the serum Troponin-T level (a) and cardiac biomarker enzymes creatine kinase myocardial band (CK-MB) (b) and lactate dehydrogenase (LDH) (c) of rats in different groups. Values are expressed as means ± SEM; (n = 5). (∗∗ and ∗∗∗ indicate statistical significance at P < 0.05, P < 0.01 and P < 0.001, respectively, compared to the control group. ### indicate statistical significance at P < 0.001, respectively, compared to the diabetic group).
Figure 7
Figure 7
Effect of DM and MLT on the serum levels of liver function enzymes. Aspartate aminotransferase (AST) (a), alanine aminotransferase (ALT) (b), albumin c, total bilirubin (d) and total protein (e) of rats in the different groups. Values are expressed as means ± SEM; (n = 5). (∗, ∗∗ and ∗∗∗ indicate statistical significance at P < 0.05, P < 0.01 and P < 0.001, respectively, compared to the control group. ### indicate statistical significance at P < 0.001, respectively, compared to the diabetic group).
Figure 8
Figure 8
a. Expression levels of caspase-3 and p53 in the heart in different animal groups. Control (Cont) rats showing mild expression of caspase-3 and p53 (arrows) within myocardial cells. The MLT group showed weak caspase-3 and p53 immuno-expression (arrows) in myocardial cells. Diabetic (DM) animals show marked immuno-expression of both caspase-3 and p53 (arrows) in myocardial cells respectively. Diabetic animals treated with MLT (DM + MLT) displayed a marked reduction in caspase-3 and p53 expression to almost normal (arrows) within myocardial cells (IHC, ×200). The values are expressed as the means ± SEM of 5 microscopic fields/tissue samples of caspase-3 and p53 immuno-expression. (∗∗∗ and ### indicate statistical significance at P < 0.001, compared to the control group and diabetic group respectively). b. Expression levels of Bax and Bcl-2 in the heart in different animal groups. Control (Cont) rats showing mild expression of Bax and marked immuno-expression of Bcl-2 (arrows) within myocardial cells. The MLT group showed weak Bax and marked Bcl-2 immuno-expression (arrows) in myocardial cells. Diabetic (DM) animals show marked immuno-expression of Bax and mild expression of Bcl-2 (arrows) in myocardial cells respectively. Diabetic animals treated with MLT (DM + MLT) displayed a marked reduction in Bax and strong Bcl-2 expression to almost normal (arrows) within myocardial cells (IHC, ×200). The values are expressed as the means ± SEM of 5 microscopic fields/tissue samples of Bax and Bcl-2 immuno-expression. (∗∗∗ and ### indicate statistical significance at P < 0.001, compared to the control group and diabetic group respectively).
Figure 9
Figure 9
a. Expression levels of caspase-3 and p53 in the pancreas in different animal groups. Control rats displayed mild expression of caspase-3 and p53 (arrows) within pancreatic β-cells. The MLT group showed weak caspase-3 and p53 immuno-expression (arrows) in pancreatic β-cells. DM animals showed marked immuno-expression of both caspase-3 and p53 (arrows) in pancreatic β-cells. DM + MLT animals displayed a marked reduction of caspase-3 and p53 expression to almost normal (arrows) within pancreatic β-cells (IHC, ×200). The values are expressed as the means ± SEM of 5 microscopic fields/tissue samples of caspase-3 and p53 immuno-expression. (∗∗∗ and ### indicate statistical significance at P < 0.001, compared to the control group and diabetic group respectively). b. Expression levels of Bax and Bcl-2 in the pancreas in different animal groups. Control rats displayed mild expression of Bax and marked immuno-expression of Bcl-2 (arrows) within pancreatic β-cells. The MLT group showed weak Bax and strong Bcl-2 immuno-expression (arrows) in pancreatic β-cells. DM animals showed marked immuno-expression of Bax and mild expression of Bcl-2 (arrows) in pancreatic β-cells. DM + MLT animals displayed a marked reduction of Bax and marked Bcl-2 expression to almost normal (arrows) within pancreatic β-cells (IHC, ×200). The values are expressed as the means ± SEM of 5 microscopic fields/tissue samples of Bax and Bcl-2 immuno-expression. (∗∗∗ and ### indicate statistical significance at P < 0.001, compared to the control group and diabetic group respectively).
Figure 10
Figure 10
a. Hematoxylin- and eosin-stained cardiac sections of control and MLT-only-treated animals showing the regular arrangement of myocardial fibers with centrally located cigar-shaped nuclei (arrows). Diabetic rats (DM) showed disorganized arrangement of the myocardial fibers associated with perivascular myocardial degeneration (arrow), necrotic cardiac myocytes (asterisk) and mononuclear inflammatory cell aggregation (arrowhead) associated with vacuolation (curved arrow) and hyalinization in some of the cardiac myofibers. Diabetic rats treated with MLT (DM + MLT) showed improved arrangement of myocardial fibers associated with a mild degree of myocardial degeneration (arrow) and mild interstitial mononuclear inflammatory cell infiltration (arrow head), H&E, (× 200). The quantification of infiltration in heart sections of the different groups (I). Values are expressed as the means ± SEM. (∗∗∗ and ### indicate statistical significance at P < 0.001, compared to the control group and diabetic group respectively). b. Hematoxylin- and eosin-stained pancreatic sections of control and MLT-only-treated animals showing normal histological features of both exocrine and endocrine structures (arrow heads) indicates normal acinar structures and (arrows) indicates β-islets of Langerhans. Diabetic rats (DM) showed apoptosis of exocrine glands (arrowhead) and a marked shrunken in the size of the endocrine islets of Langerhans with a drastic decrease in the number of their cells (arrow). Diabetic rats treated with MLT (DM + MLT) showed mild degenerative changes within exocrine glands (arrowhead) and apparent increase in the islets of Langerhans size with normal histoarchitecture (arrow), H&E, (× 200). The quantification of islets of Langerhans blot area (I) and β cells count (II) within the blot area in sections of the pancreas of the different groups. Values are expressed as the means ± SEM. (∗∗∗ and ### indicate statistical significance at P < 0.001, compared to the control group and diabetic group respectively).
Figure 11
Figure 11
Masson trichrome-stained cardiac sections of control and MLT-only-treated animals showed normal thin interstitial collagen fibers in between myocardial fibers (arrow). (DM) rats showed marked perivascular (arrowhead) and interstitial (arrow) fibrosis. The (DM + MLT) group showed a marked decrease in interstitial fibrous connective tissue (arrows) (×200). Percent of fibrosis area in Masson trichrome stained heart sections in the different groups (I). Values are expressed as the means ± SEM. (∗∗∗ and ### indicate statistical significance at P < 0.001, compared to the control group and diabetic group respectively).

Similar articles

Cited by

References

    1. Wild S.H., Walker J.J., Morling J.R., McAllister D.A., Colhoun H.M., Farran B., McGurnaghan S., McCrimmon R., Read S.H., Sattar N., Byrne C.D. Cardiovascular disease, cancer, and mortality among people with type 2 diabetes and alcoholic or nonalcoholic fatty liver disease hospital admission. Diabetes Care. 2018;41:341–347. - PubMed
    1. Robins S.J., Lyass A., Zachariah J.P., Massaro J.M., Vasan R.S. Insulin resistance and the relationship of a dyslipidemia to coronary heart disease: the framingham heart study. Arterioscler. Thromb. Vasc. Biol. 2011;31:1208–1214. - PMC - PubMed
    1. Gurel-Gokmen B., Ipekci H., Oktay S., Alev B., Ustundag U.V., Ak E., Akakin D., Sener G., Emekli-Alturfan E., Yarat A., Tunali-Akbay T. Melatonin improves hyperglycemia induced damages in rat brain. Diabetes Metab. Res. Rev. 2018;34 - PubMed
    1. Alonso N., Moliner P., Mauricio D. Springer New York LLC; 2018. Pathogenesis, Clinical Features and Treatment of Diabetic Cardiomyopathy; pp. 197–217. - PubMed
    1. Katakami N. Mechanism of development of atherosclerosis and cardiovascular disease in diabetes mellitus. J. Atherosclerosis Thromb. 2018;25:27–39. - PMC - PubMed