. 2021 Mar 3;6(10):6607-6613.
doi: 10.1021/acsomega.0c05217. eCollection 2021 Mar 16.

Automatic and Reliable Quantification of Tonic Dopamine Concentrations In Vivo Using a Novel Probabilistic Inference Method

Affiliations

Automatic and Reliable Quantification of Tonic Dopamine Concentrations In Vivo Using a Novel Probabilistic Inference Method

Jaekyung Kim et al. ACS Omega. .

Abstract

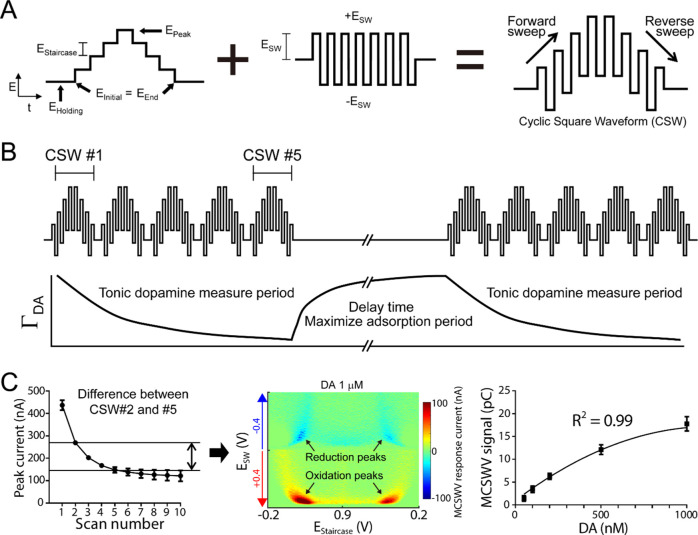
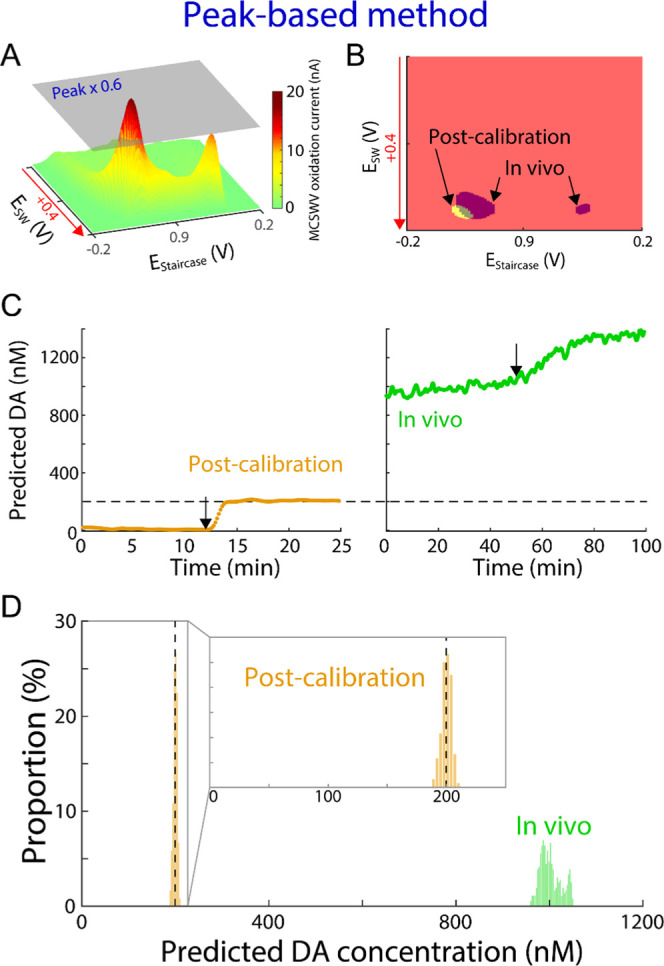
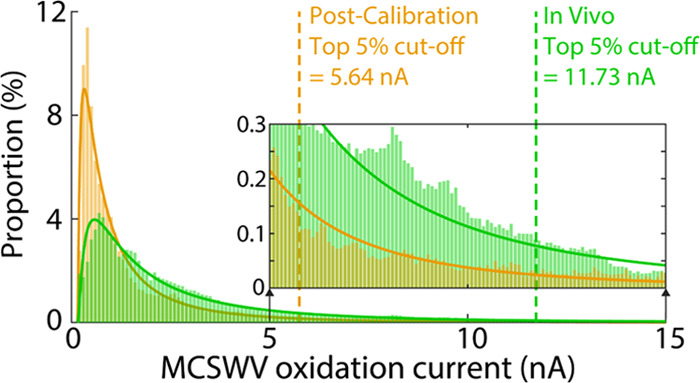
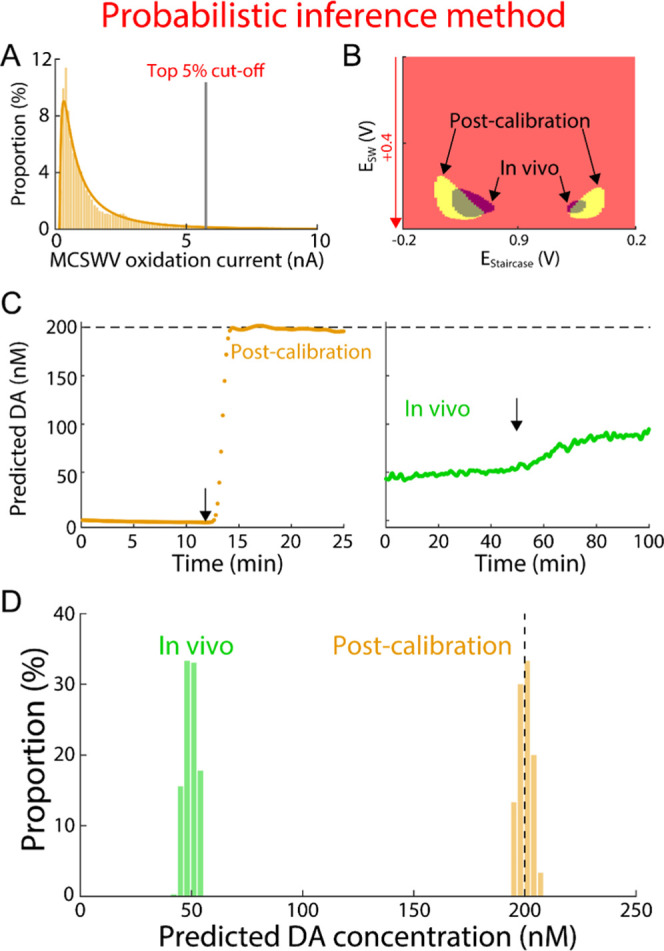
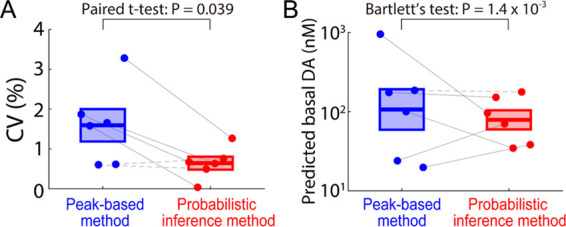
Dysregulation of the neurotransmitter dopamine (DA) is implicated in several neuropsychiatric conditions. Multiple-cyclic square-wave voltammetry (MCSWV) is a state-of-the-art technique for measuring tonic DA levels with high sensitivity (<5 nM), selectivity, and spatiotemporal resolution. Currently, however, analysis of MCSWV data requires manual, qualitative adjustments of analysis parameters, which can inadvertently introduce bias. Here, we demonstrate the development of a computational technique using a statistical model for standardized, unbiased analysis of experimental MCSWV data for unbiased quantification of tonic DA. The oxidation current in the MCSWV signal was predicted to follow a lognormal distribution. The DA-related oxidation signal was inferred to be present in the top 5% of this analytical distribution and was used to predict a tonic DA level. The performance of this technique was compared against the previously used peak-based method on paired in vivo and post-calibration in vitro datasets. Analytical inference of DA signals derived from the predicted statistical model enabled high-fidelity conversion of the in vivo current signal to a concentration value via in vitro post-calibration. As a result, this technique demonstrated reliable and improved estimation of tonic DA levels in vivo compared to the conventional manual post-processing technique using the peak current signals. These results show that probabilistic inference-based voltammetry signal processing techniques can standardize the determination of tonic DA concentrations, enabling progress toward the development of MCSWV as a robust research and clinical tool.


Conflict of interest statement

The authors declare no competing financial interest.

Figures

Figure 1
Figure 1
Multiple-cyclic square-wave voltammetry. (A) Schematic design of square waveform. (B) Multiple-cyclic square-wave tonic concentration measurements utilizing the properties of dopamine adsorption at the carbon-fiber microelectrode. (C) Left: peak current of dopamine at 1 μM at each cyclic square wave (CSW); middle: pseudo-color plot of the difference between CSW #2 and #5 for 1 μM of dopamine; right: MCSWV signal (i.e., integration of oxidation currents) correlates with tonic dopamine concentrations (50–1000 nM; n = 4 electrodes; quadratic fitting: R2 = 0.99). Reproduced from Oh et al. with permission from Elsevier.
Figure 2
Figure 2
Processing DA kernel and prediction of DA levels by peak-based method. (A) Example of three-dimensional illustration of MCSWV oxidation currents with 200 nM of DA in vitro (i.e., post-calibration). (B) DA kernel for the representative in vitro post-calibration recording shown in (A) (yellow) and an in vivo recording (purple). (C) Example of DA concentration predictions using the peak-based method for the post-calibration (left, orange) and the in vivo recording (green, right). Arrows represent DA injection for post-calibration and nomifensine administration in vivo; the dashed line indicates injected DA concentration in post-calibration. (D) Distributions of the predicted DA concentrations during the first 40 min and the last 15 min for the in vivo and in vitro post-calibration recordings in (C), respectively. Inset: enlarged x-axis scale matching to Figure 4D.
Figure 3
Figure 3
Distributions of MCSWV oxidation currents for the recordings shown in Figure 2D. Analytical lognormal distribution is shown in the respective curves. The vertical dashed line indicates the top 5th percentile of the respective analytical distribution—the cutoff level to separate the DA signal (i.e., higher than the cutoff) and non-DA signal (i.e., lower than the cutoff) in the post-calibration in vitro (orange) and in vivo (green), respectively.
Figure 4
Figure 4
Processing DA kernel and prediction by probabilistic inference method. (A) Example of distribution of MCSWV oxidation currents with 200 nM DA in vitro using the same data shown in Figure 2A. DA kernel was determined using the methods proposed in this study: thresholding by the top 5th percentile from the analytical distribution (gray line). (B) DA kernels for the representative in vitro post-calibration recordings are shown in (A) (yellow) and the in vivo recording (green). (C) Example of DA concentration predictions using the method in (A) and (B) for the post-calibration (left, orange) and the in vivo recording (green, right). Arrow represents DA injection for post-calibration and nomifensine administration in vivo; the dashed line indicates injected DA concentration in post-calibration. (D) Distributions of the predicted DA concentrations during the first 40 min and the last 15 min for the in vivo and in vitro post-calibration recordings in (C), respectively.
Figure 5
Figure 5
Comparison of the two methods. (A) Coefficient of variation (CV) in the predicted DA concentrations for the in vitro post-calibration (n = 6 electrodes; mean in vertical bar ± SEM in box; peak-based method: 1.6 ± 0.4%; probabilistic inference method: 0.4 ± 0.1% peak-based versus probabilistic inference, paired t-test, t5 = 2.77, P = 0.039). Four solid lines indicate significantly lower variance within an in vitro session in the probabilistic inference method compared to the peak-based method (Bartlett’s test, P < 0.05). (B) Comparison of the predicted tonic DA concentrations in vivo (n = 6 rats). Variance of predicted tonic DA across rats was significantly lower in the probabilistic inference method compared to the peak-based method (Bartlett’s test, χ2 = 10.14, P = 1.4 × 10⁻³; mean in vertical bar ± SEM in box at log10 scale). Five solid lines indicate significantly lower variance within an in vivo session in the probabilistic inference method compared to the peak-based method (Bartlett’s test, P < 0.05).

Similar articles

Cited by

References

    1. Goto Y.; Otani S.; Grace A. A. The Yin and Yang of dopamine release: a new perspective. Neuropharmacology 2007, 53, 583–587. 10.1016/j.neuropharm.2007.07.007. - DOI - PMC - PubMed
    1. Salamone J. D. Complex motor and sensorimotor functions of striatal and accumbens dopamine: involvement in instrumental behavior processes. Psychopharmacology 1992, 107, 160–174. 10.1007/BF02245133. - DOI - PubMed
    1. Collins A. L.; Aitken T. J.; Greenfield V. Y.; Ostlund S. B.; Wassum K. M. Nucleus accumbens acetylcholine receptors modulate dopamine and motivation. Neuropsychopharmacology 2016, 41, 2830–2838. 10.1038/npp.2016.81. - DOI - PMC - PubMed
    1. Radke A. K.; Kocharian A.; Covey D. P.; Lovinger D. M.; Cheer J. F.; Mateo Y.; Holmes A. Contributions of nucleus accumbens dopamine to cognitive flexibility. Eur. J. Neurosci. 2019, 50, 2023–2035. 10.1111/ejn.14152. - DOI - PMC - PubMed
    1. Caron M.; Beaulieu M.; Raymond V.; Gagne B.; Drouin J.; Lefkowitz R.; Labrie F. Dopaminergic receptors in the anterior pituitary gland. Correlation of [3H] dihydroergocryptine binding with the dopaminergic control of prolactin release. J. Biol. Chem. 1978, 253, 2244–2253. 10.1016/S0021-9258(17)38065-1. - DOI - PubMed