

Predictive Global Models of Cruzain Inhibitors with Large Chemical Coverage
- PMID: 33748586
- PMCID: PMC7970485
- DOI: 10.1021/acsomega.0c05645
Predictive Global Models of Cruzain Inhibitors with Large Chemical Coverage
Abstract
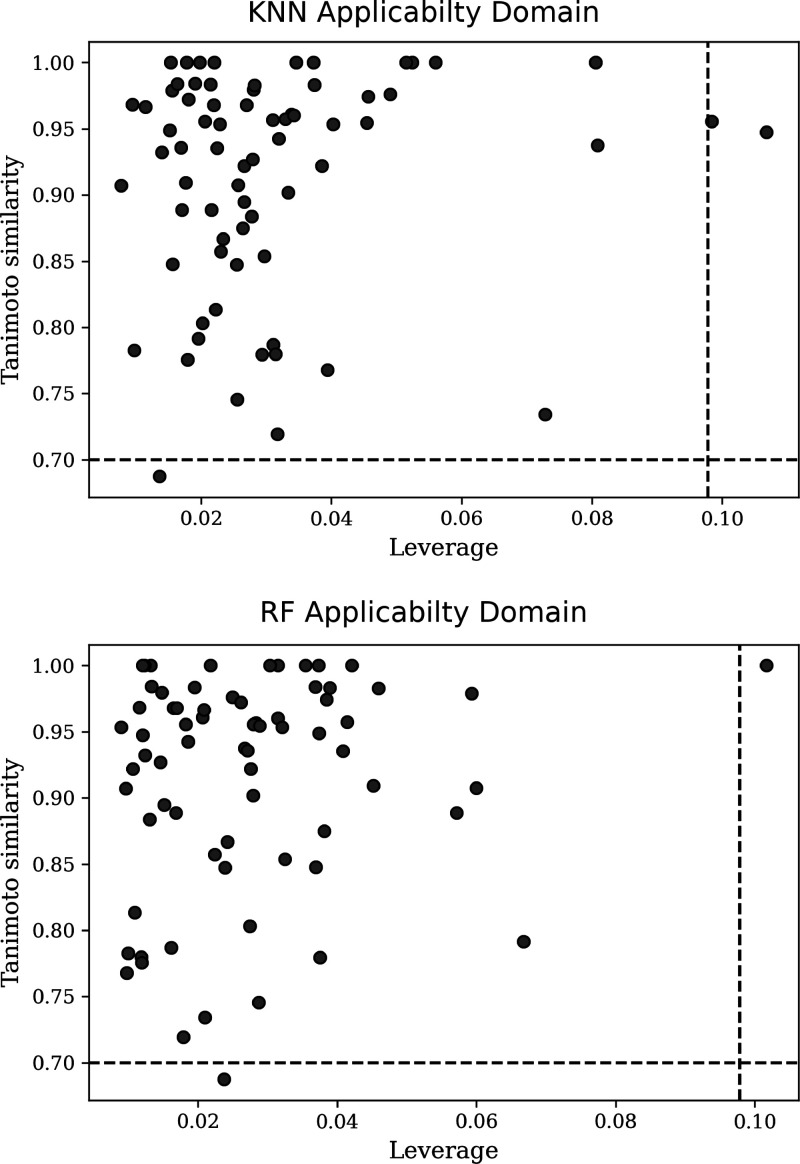
Chagas disease affects 8-11 million people worldwide, most of them living in Latin America. Moreover, migratory phenomena have spread the infection beyond endemic areas. Efforts for the development of new pharmacological therapies are paramount as the pharmacological profile of the two marketed drugs currently available, nifurtimox and benznidazole, needs to be improved. Cruzain, a parasitic cysteine protease, is one of the most attractive biological targets due to its roles in parasite survival and immune evasion. In this work, we compiled and curated a database of diverse cruzain inhibitors previously reported in the literature. From this data set, quantitative structure-activity relationship (QSAR) models for the prediction of their pIC50 values were generated using k-nearest neighbors and random forest algorithms. Local and global models were calculated and compared. The statistical parameters for internal and external validation indicate a significant predictability, with q loo 2 values around 0.66 and 0.61 and external R 2 coefficients of 0.725 and 0.766. The applicability domain is quantitatively defined, according to QSAR good practices, using the leverage and similarity methods. The models described in this work are readily available in a Python script for the discovery of novel cruzain inhibitors.
© 2021 The Authors. Published by American Chemical Society.
Conflict of interest statement
The authors declare no competing financial interest.
Figures


Similar articles
-
Computational approaches towards the discovery and optimisation of cruzain inhibitors.Mem Inst Oswaldo Cruz. 2022 Mar 16;117:e210385. doi: 10.1590/0074-02760210385. eCollection 2022. Mem Inst Oswaldo Cruz. 2022. PMID: 35293427 Free PMC article. Review.
-
Convergent QSAR Models for the Prediction of Cruzain Inhibitors.ACS Omega. 2023 Oct 13;8(42):38961-38982. doi: 10.1021/acsomega.3c03376. eCollection 2023 Oct 24. ACS Omega. 2023. PMID: 37901514 Free PMC article.
-
Molecular modeling and structure-activity relationships for a series of benzimidazole derivatives as cruzain inhibitors.Future Med Chem. 2017 May;9(7):641-657. doi: 10.4155/fmc-2016-0236. Epub 2017 May 16. Future Med Chem. 2017. PMID: 28509592
-
Structure-Based and Molecular Modeling Studies for the Discovery of Cyclic Imides as Reversible Cruzain Inhibitors With Potent Anti-Trypanosoma cruzi Activity.Front Chem. 2019 Nov 25;7:798. doi: 10.3389/fchem.2019.00798. eCollection 2019. Front Chem. 2019. PMID: 31824926 Free PMC article.
-
Synthesis and structure-activity relationship studies of cruzain and rhodesain inhibitors.Eur J Med Chem. 2018 Sep 5;157:1426-1459. doi: 10.1016/j.ejmech.2018.08.079. Epub 2018 Aug 31. Eur J Med Chem. 2018. PMID: 30282318 Review.
Cited by
-
TrypPROTACs Unlocking New Therapeutic Strategies for Chagas Disease.Pharmaceuticals (Basel). 2025 Jun 19;18(6):919. doi: 10.3390/ph18060919. Pharmaceuticals (Basel). 2025. PMID: 40573314 Free PMC article. Review.
-
Targeting Cysteine Proteases and their Inhibitors to Combat Trypanosomiasis.Curr Med Chem. 2024;31(16):2135-2169. doi: 10.2174/0929867330666230619160509. Curr Med Chem. 2024. PMID: 37340748 Review.
-
Computational approaches towards the discovery and optimisation of cruzain inhibitors.Mem Inst Oswaldo Cruz. 2022 Mar 16;117:e210385. doi: 10.1590/0074-02760210385. eCollection 2022. Mem Inst Oswaldo Cruz. 2022. PMID: 35293427 Free PMC article. Review.
-
Convergent QSAR Models for the Prediction of Cruzain Inhibitors.ACS Omega. 2023 Oct 13;8(42):38961-38982. doi: 10.1021/acsomega.3c03376. eCollection 2023 Oct 24. ACS Omega. 2023. PMID: 37901514 Free PMC article.
-
The pursuit of accurate predictive models of the bioactivity of small molecules.Chem Sci. 2024 Jan 12;15(6):1938-1952. doi: 10.1039/d3sc05534e. eCollection 2024 Feb 7. Chem Sci. 2024. PMID: 38332817 Free PMC article. Review.
References
LinkOut - more resources
Full Text Sources
Other Literature Sources
