. 2021 Feb 20;24(3):102205.
doi: 10.1016/j.isci.2021.102205. eCollection 2021 Mar 19.

Direct current effects on afferent and hair cell to elicit natural firing patterns

Affiliations

Direct current effects on afferent and hair cell to elicit natural firing patterns

Cynthia R Steinhardt et al. iScience. .

Abstract

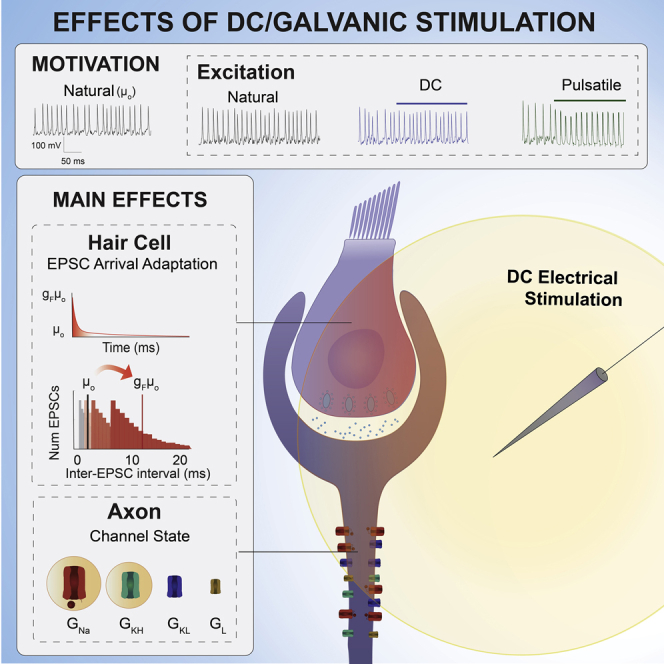
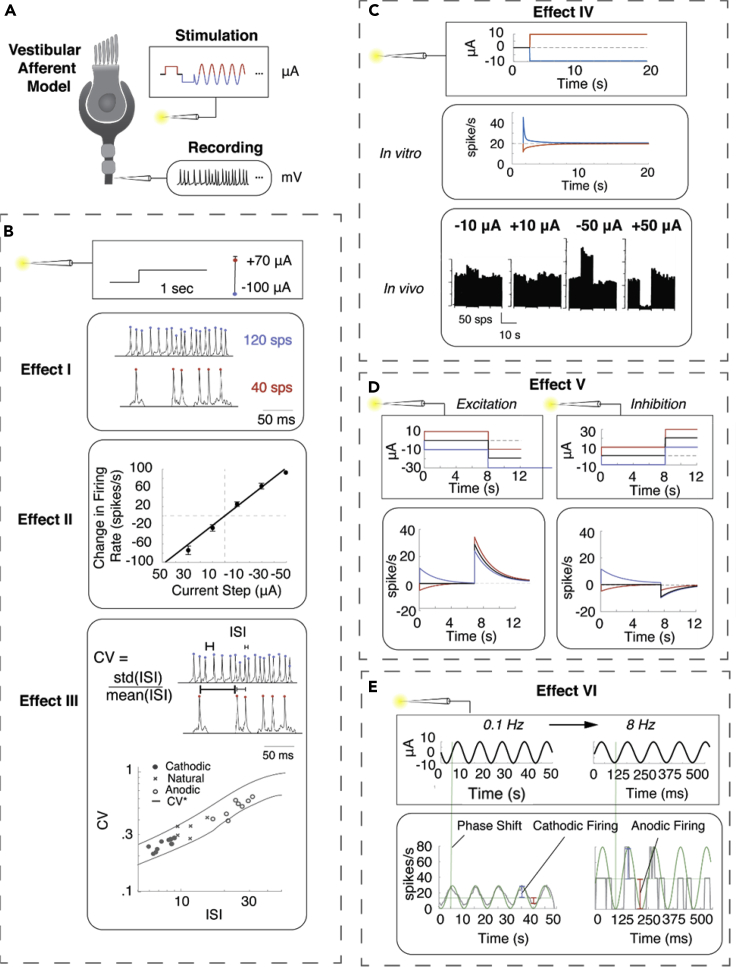
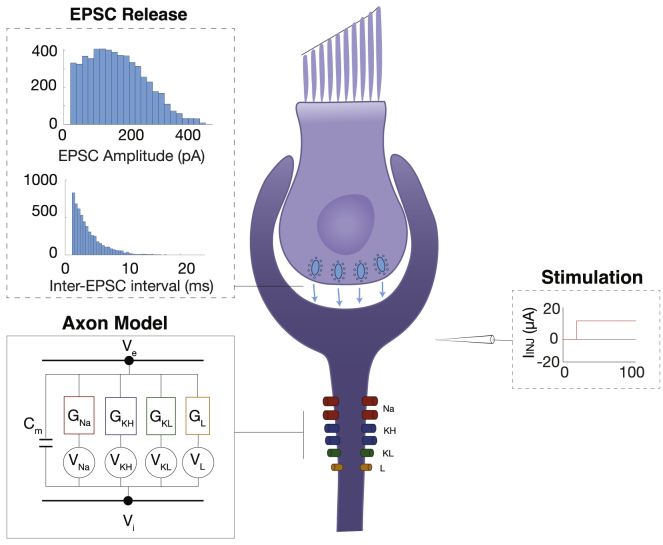
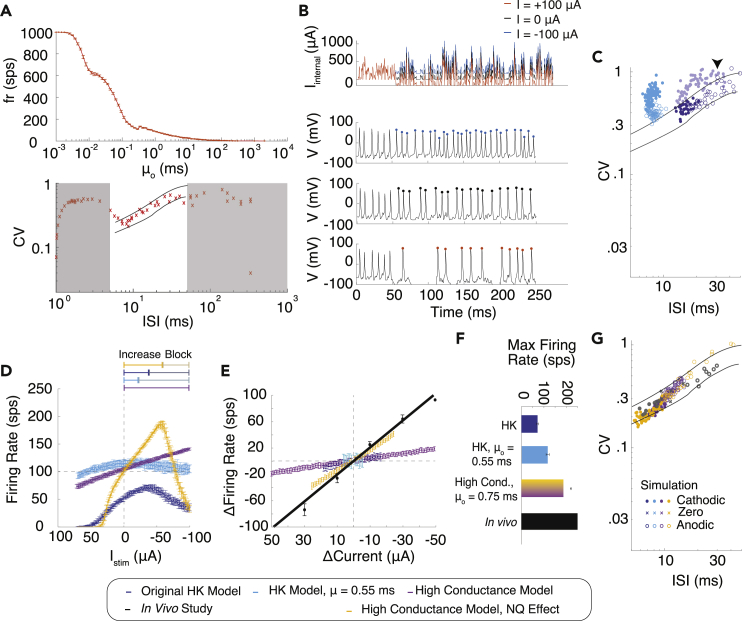
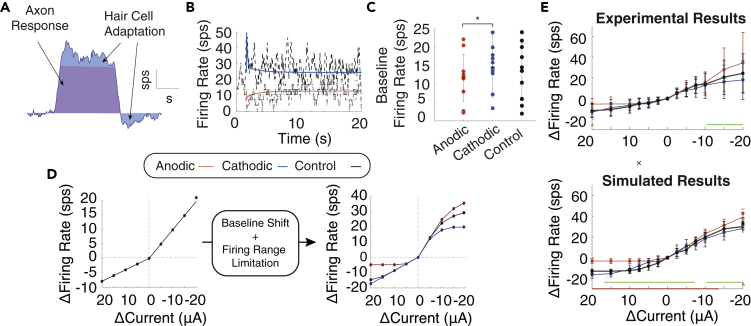
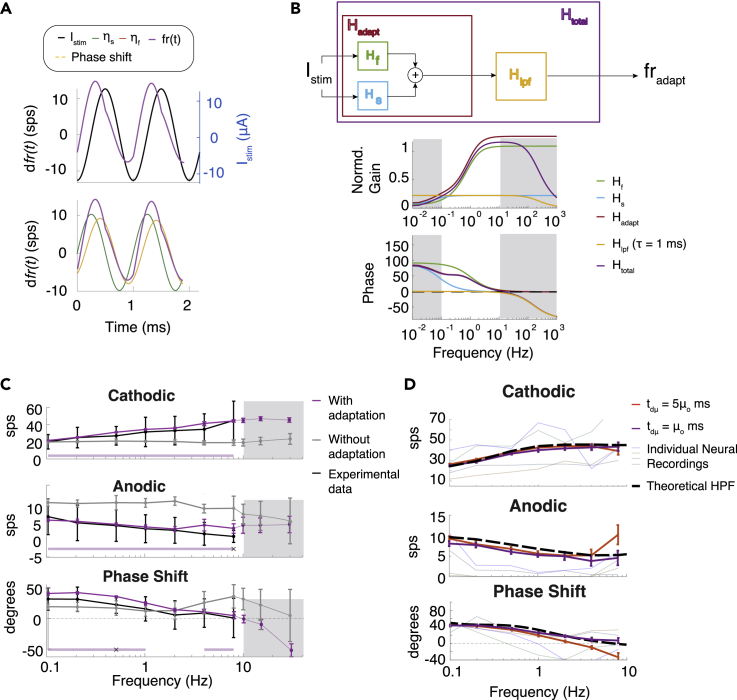
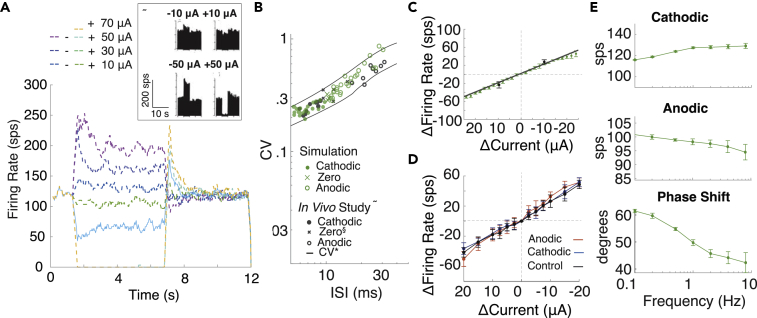
In contrast to the conventional pulsatile neuromodulation that excites neurons, galvanic or direct current stimulation can excite, inhibit, or sensitize neurons. The vestibular system presents an excellent system for studying galvanic neural interface due to the spontaneously firing afferent activity that needs to be either suppressed or excited to convey head motion sensation. We determine the cellular mechanisms underlying the beneficial properties of galvanic vestibular stimulation (GVS) by creating a computational model of the vestibular end organ that elicits all experimentally observed response characteristics to GVS simultaneously. When GVS was modeled to affect the axon alone, the complete experimental data could not be replicated. We found that if GVS affects hair cell vesicle release and axonal excitability simultaneously, our modeling results matched all experimental observations. We conclude that contrary to the conventional belief that GVS affects only axons, the hair cells are likely also affected by this stimulation paradigm.

Keywords: Biological Sciences; Cellular Neuroscience; Neuroscience.


Conflict of interest statement

The authors have no competing interests to report at this time.

Figures

None
Graphical abstract
Figure 1
Figure 1
The six distinctive effects of GVS stimulation (A) Square boxes indicate the GVS stimulus, and rounded boxes represent the corresponding neural responses from the vestibular afferent. (B) Transient response patterns. Effect I: low-amplitude GVS stimulation increases and decreases firing rate with cathodic (blue) and anodic (red) current. Effect II: cathodic GVS stimulation can cause dramatic increases in firing rate of up to 2.5 spikes per second (sps) per μA. Data are presented as mean ± std. Effect III: GVS stimulation can maintain firing regularity (CV) while changing firing rate. (C) Long duration adaptation. Effect IV: long-term GVS stimulation induces an immediate change in firing rate that adapts to a new baseline firing rate on the scale of seconds. In vivo (black) adaptation occurs with baseline offset in firing rate. (D) Adaptation from different GVS-evoked baselines. Effect V: after a baseline of GVS stimulation, the afferent shows a smaller inhibitory response after and inhibitory (anodic) baseline and smaller excitatory response after an excitatory baseline. (E) Responses to sinusoidal modulation. Effect VI: sinusoidal GVS modulation leads to increased/decreased firing rate in the cathodic/anodic half of a cycle with increased frequency of sine wave, and the neuronal response shows a phase lead for frequencies above 4 Hz that decreases to zero around 4–8 Hz.
Figure 2
Figure 2
Diagram of the axonal model based on the Hight and Kalluri model
Figure 3
Figure 3
Role of afferent axon in GVS response (A) Changes in mean EPSC arrival rate μo result in increased firing rate (top) and conformance to CV∗ (bottom) using original HK model. White region in bottom plot indicates the zone shown in the experimental in vivo data with CV∗ boundaries for the irregular neuron. (B) EPSC (top) and membrane voltage V (lower three). GVS is turned on at 50 ms. (top V) Cathodic current increases EPSC baseline bringing the membrane potential closer to depolarization causing more APs (blue). (middle V) No GVS. (bottom V) Anodic current decreases EPSC baseline bringing it closer to hyperpolarization causing fewer APs (orange). (C–G) Dark blue: standard KH model, Light blue: HK model modified with μo = 0.55 ms, Purple: HK model with μo= 0.75 ms and high conductance, Yellow: HK model with μo = 0.75 ms, high conductance, and NQ effect, Black: experimental in vivo data. (C) CV∗ and CV as GVS current is applied (KH model modified with μo = 0.55 ms light blue, standard HK with μo = 3 ms dark blue); arrow points to the shaded dark blue points that occurred during the Cathodic Block. Open circles are anodic stimulation; filled circles are cathodic stimulation. (D) Firing rate as a function of GVS stimulation amplitude. (E) Change in firing rate as a function of stimulation amplitude. (F) Maximum firing rates of the responses. (G) CV of the responses. Lines indicate experimental CV∗ from the in vivo experiment. All statistics are presented as mean ± std.
Figure 4
Figure 4
Adaptation in GVS modulated afferent response (A) The full adaptation is composed of a change in firing rate due to axonal response (purple) and hair cell adaptation, (blue) which responds to changes in internal current. (B) We can tune adaptation gains and time constants to get adaptation that resembles experimental in vitro results from Manca et al. (2019) to −10 μΑ of cathodic (blue) and anodic (red). (C) We find a significant baseline shift with anodic and cathodic current in the experimental results in the in vitro study (t(9) = 2.37, p = 0.042). (D) Without considering baseline shift and the firing range limits (fraxon = 0, maximum firing rate 55 sps) the spike rate changes to current steps are predicted to be the same after baselines of anodic (red), cathodic (blue), and control or zero baseline (black) using fr(t) as they overlap on the plot (left). When fraxon= fro, fr(t) resembles experimental results in plot (E). (E) We use fradapt(t) to modulate μ0(t) in our full model. Traces are in the same colors. A non-parametric cluster statistic is used to compare anodic with cathodic step response (green) within conditions. The in vitro experimental data (above) and simulated data (below) was tested for significant differences between conditions with anodic-control (red), cathodic-control (blue), and anodic-cathodic non-parametric cluster statistic (green) shown on each image. All statistical data are presented as mean ± std.
Figure 5
Figure 5
Responses to sinusoidal GVS modulation can be accounted for by the hair cell adaptation response (A) Response to sinusoidal GVS can be accounted for by the fast and the slow adaptation response of the hair cell. (B) Frequency response of fradapt comprises the fast and the slow components as well as the hypothesized low pass characteristics associated with the ability to respond to incoming EPSCs. (C) The firing rate and phase in cathodic and anodic halves of the cycle with the axon modeled with adaptation (purple) without adaptation (gray), and the original data (black). Significance of difference between with and without adaptation cases are indicated in light purple. Significance of differences between the model with adaptation and the original data are marked with x's. Data outside the original range are shown in gray. White portion correlated to frequency stimuli used in the in vitro experiment. (D) Examination of the low pass filtering characteristics imposed by changing the rate of EPSC sampling t. All statistical data are presented as mean ± std.
Figure 6
Figure 6
The complete effects of GVS in the in vivo model including hair cell adaptation (A) Firing range induced with current steps from –50 μA to 70 μA, showing adaptation and axonal response that matches in vivo experimental results (box). (B) The CV versus ISI associated with GVS stimulation using the model (green) compared with the CV ISI relationship in the original paper (black), which indicates cathodic stimulation (filled circle), anodic stimulation (open circle), and natural head rotation (x's). (C) The change in firing rate with cathodic current steps at slope of 2.5 sps/μA (black) as in the experimental results. (D) The change in firing rate with current steps up to ±20 from (A)10, +10, and 0 μA current baselines across five repetitions. (E) The change in firing rate to cathodic and anodic portions of sine waves of 10 μA amplitude and the phase shift to frequencies from 0.1 to 10 Hz. All statistical data are presented as mean ± std.

Similar articles

Cited by

References

    1. Aplin F.P., Singh D., Della Santina C.C., Fridman G.Y. Combined ionic direct current and pulse frequency modulation improves the dynamic range of vestibular canal stimulation. J. Vestib. Res. 2019;29:1–8. - PMC - PubMed
    1. Aplin F.P., Singh D., Santina C.C.D., Fridman G.Y. Ionic direct current modulation for combined inhibition/excitation of the vestibular system. IEEE Trans. Biomed. Eng. 2019;66:775–783. - PMC - PubMed
    1. Aplin F.P., Singh D., Santina C.C.D., Fridman G.Y. Ionic direct current modulation for combined inhibition/excitation of the vestibular system. IEEE Trans. Biomed. Eng. 2020;66:775–783. - PMC - PubMed
    1. Aplin F.P., Fridman G.Y. Implantable direct current neural modulation: theory, feasibility, and efficacy. Front. Neurosci. 2019;13:379. - PMC - PubMed
    1. Aw S.T., Todd M.J., Aw G.E., Weber K.P., Halmagyi G.M. Gentamicin vestibulotoxicity impairs human electrically evoked vestibulo-ocular reflex. Neurology. 2008;71:1776–1782. - PubMed

LinkOut - more resources