. 2021 Feb 24;24(3):102227.
doi: 10.1016/j.isci.2021.102227. eCollection 2021 Mar 19.

LIFR-α-dependent adipocyte signaling in obesity limits adipose expansion contributing to fatty liver disease

Affiliations

LIFR-α-dependent adipocyte signaling in obesity limits adipose expansion contributing to fatty liver disease

Tong Guo et al. iScience. .

Abstract

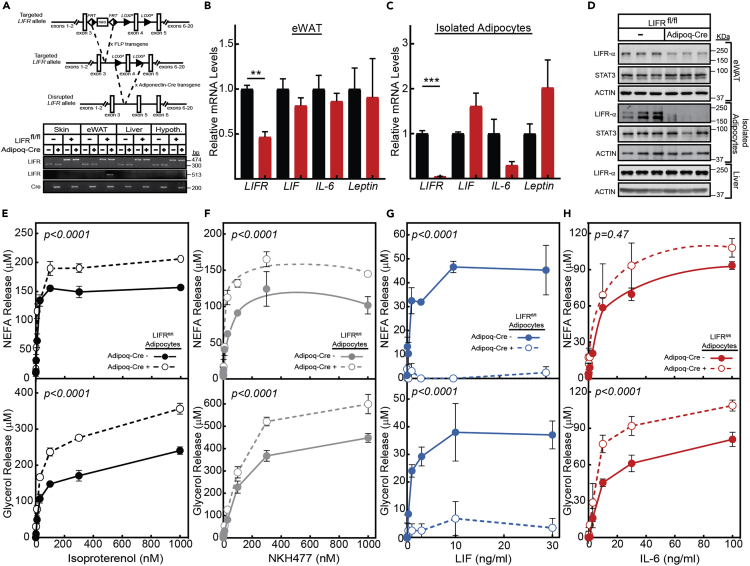
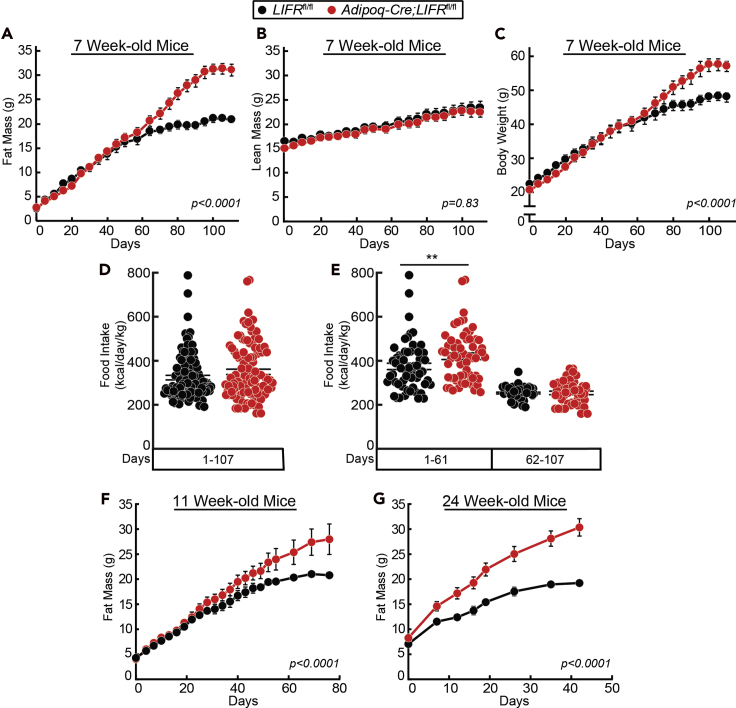
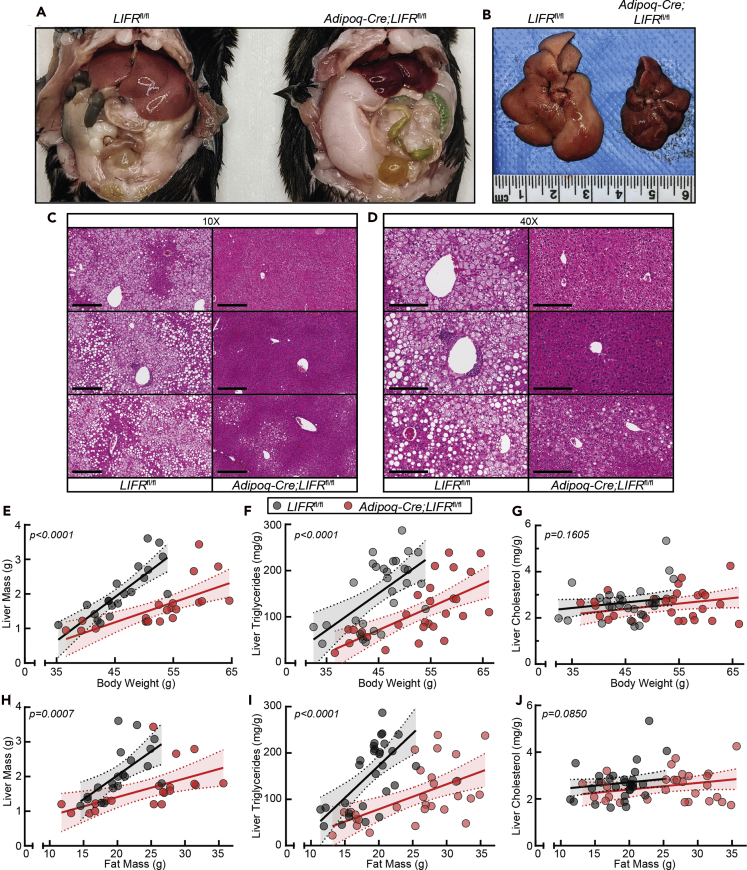
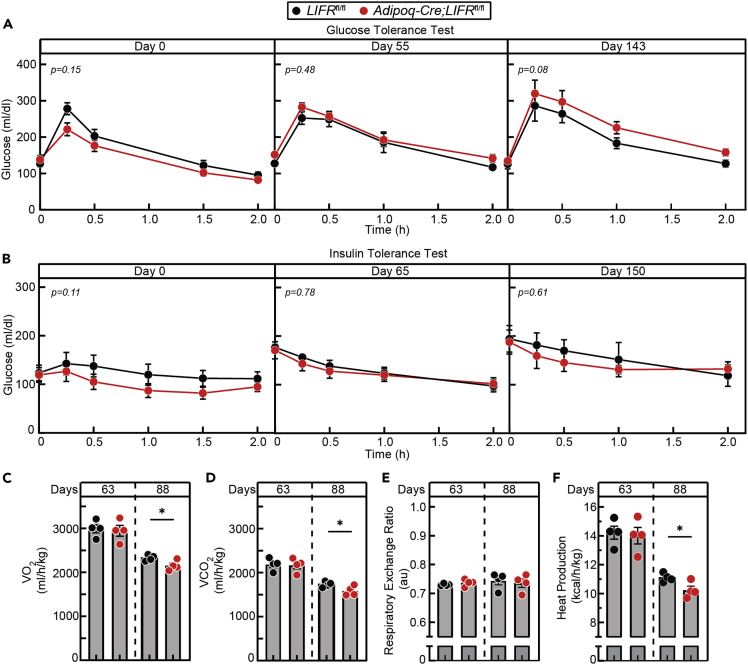
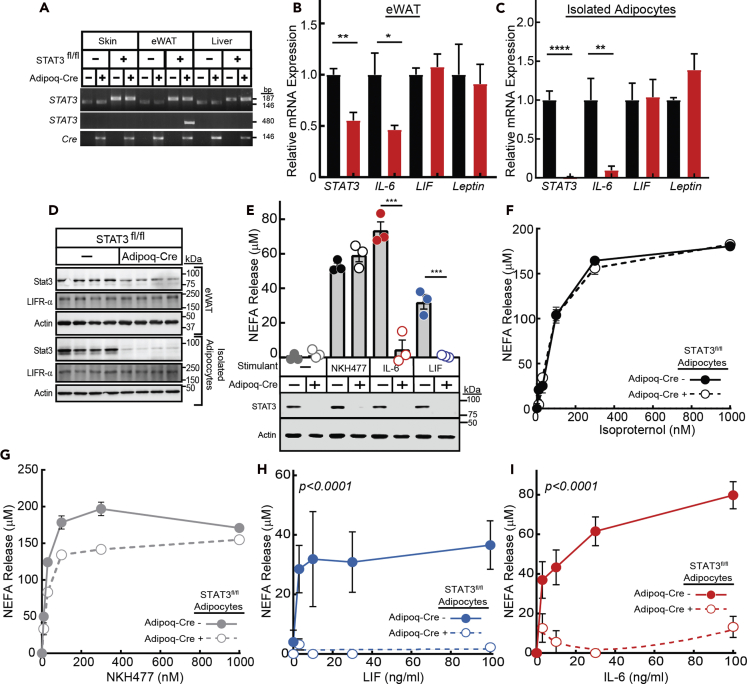
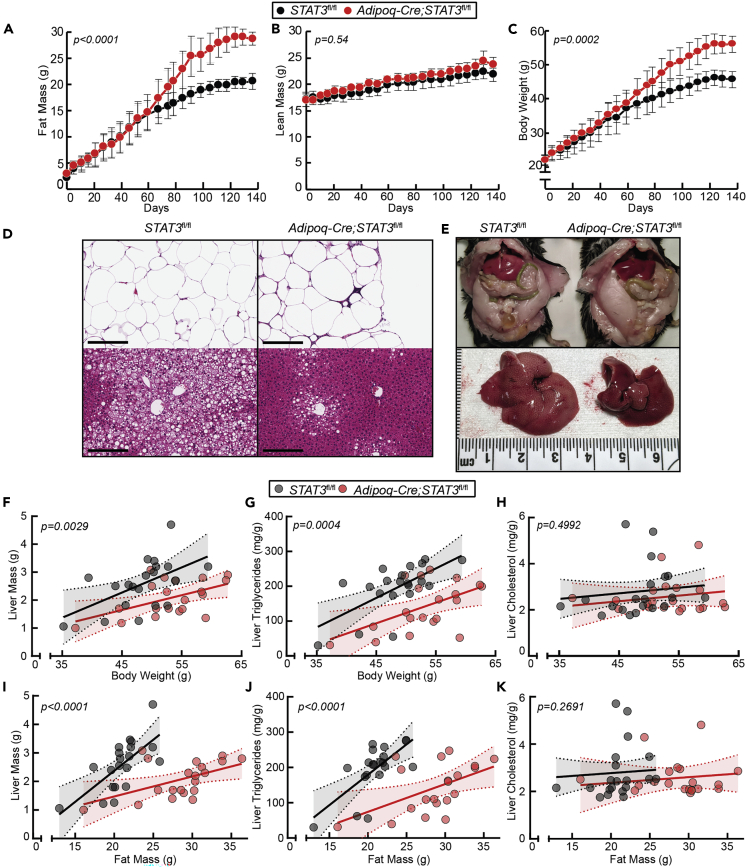
The role of chronic adipose inflammation in diet-induced obesity (DIO) and its sequelae including fatty liver disease remains unclear. Leukemia inhibitory factor (LIF) induces JAK-dependent adipocyte lipolysis and altered adipo/cytokine expression, suppressing in vivo adipose expansion in normal and obese mouse models. To characterize LIF receptor (LIFR-α)-dependent cytokine signaling in DIO, we created an adipocyte-specific LIFR knockout mouse model (Adipoq-Cre;LIFR fl/fl ). Differentiated adipocytes derived from this model blocked LIF-induced triacylglycerol lipolysis. Adipoq-Cre;LIFR fl/fl mice on a high-fat diet (HFD) displayed reduced adipose STAT3 activation, 50% expansion in adipose, 20% body weight increase, and a 75% reduction in total hepatic triacylglycerides compared with controls. To demonstrate that LIFR-α signals adipocytes through STAT3, we also created an Adipoq-Cre;STAT3 fl/fl model that showed similar findings when fed a HFD as Adipoq-Cre;LIFR fl/fl mice. These findings establish the importance of obesity-associated LIFR-α/JAK/STAT3 inflammatory signaling in adipocytes, blocking further adipose expansion in DIO contributing to ectopic liver triacylglyceride accumulation.

Keywords: Animal Physiology; Biological Sciences; Cell Biology; Cellular Physiology; Endocrinology.


Conflict of interest statement

T.G., A.G., J.Z.G., J.Y., A.Y.G., B.M.E., and P.I. acknowledge no conflicts of interest related to this work. Pfizer, Inc., is currently supporting a collaborative project with the R.E.I. laboratory that is independent of all data presented in this manuscript.

Figures

None
Graphical abstract
Figure 1
Figure 1
LIF-induced adipocyte inflammation and lipolysis require LIFR-α (A) Schematic of the generation of Adipoq-Cre;LIFRfl/fl mouse model and genomic PCR of indicated tissue from male mice at 30 weeks of age from the indicated mouse model using primers for floxed LIFR allele (top panel), LIFR allele with deletion of exon 4 (middle panel), and Cre (bottom panel). (B and C) qRT-PCR of eWAT (B) or isolated adipocytes from eWAT (C) from 4 LIFRfl/fl or Adipoq-Cre;LIFRfl/fl male mice at 30 weeks of age for the indicated gene normalized to β-actin. Data are shown as mean ± SEM. (D) Immunoblot analysis of indicated tissue from three LIFRfl/fl or Adipoq-Cre;LIFRfl/fl male mice at 30 weeks of age with the indicated antibody. (E–H) Differentiated adipocytes derived from LIFRfl/fl or Adipoq-Cre;LIFRfl/fl male mice at 7 weeks of age were treated with the indicated stimulants. After 20 h, medium non-esterified fatty acids (NEFA) and glycerol concentrations were measured (E–H). Data are shown as mean ± SEM. ∗∗p < 0.01 and ∗∗∗p < 0.001 based on two-tailed t test with Bonferroni-Sidak adjustment for multiple comparison tests comparing LIFRfl/fl with Adipoq-Cre;LIFRfl/fl cohorts. p value calculated by using non-linear regression to fit a three-variable dose-response model to LIFRfl/fl to Adipoq-Cre;LIFRfl/fl cohorts, followed by an extra sum-of-squares F test for differences between cohort curves (E–H).
Figure 2
Figure 2
LIFR-α signaling in adipocytes suppresses adipose expansion in mice on a high fat diet (A–G) LIFRfl/fl and Adipoq-Cre;LIFRfl/fl male mice at 7 weeks (A–E; n = 4), 11 weeks (F; n = 4), or 24 weeks (G; n = 5) of age were placed on a high-fat diet and fat mass by ECHO MRI (A, F, G), lean mass by ECHO MRI (B), body weight (C), and food intake (D and E) were measured over the indicated time period. Data are shown as mean ± SEM (A–C, F, and G) or dot plots with mean ± SEM (D–E). p was calculated using non-linear regression to fit a logistic growth curve to each cohort followed by extra sum-of-squares F test for significant differences between cohort curves (A–C, F, and G) or ∗∗p < 0.01 based on two-tailed t test (D) or a one-way ANOVA with Holm-Sidak's multiple comparison tests (E) comparing LIFRfl/fl with Adipoq-Cre;LIFRfl/fl cohorts. See also Figure S1.
Figure 3
Figure 3
Adipocyte LIFR-α signaling activates STAT3-suppressing adipose expansion in mice on a high-fat diet (A–D) LIFRfl/fl and Adipoq-Cre;LIFRfl/fl male mice (n = 4) at 7 weeks of age were placed on an HFD as described in Figure 2. Mice were sacrificed, and eWAT was harvested and processed for H&E histopathology with subsequent measurement of adipocyte diameters from 3 mice per cohort (C and D). Data are shown as dot plots with mean ± SEM (C). ∗p < 0.05 based on one-tailed Student's t test (C) or p was calculated using non-linear regression to fit a Gaussian curve to each cohort followed by extra sum-of-squares F test for significant differences between cohort curves (D). Scale bars: 600 μm in (A) and 300 μm in (B). (E–I) qRT-PCR of the indicated genes normalized to β-actin from two experiments containing 8 total mice per cohort in which LIFRfl/fl and Adipoq-Cre;LIFRfl/fl male mice at 7 and 10 weeks of age were sacrificed after 107 and 72 days, respectively, on an HFD. Data are shown as mean ± SEM. ∗p < 0.05, ∗∗p < 0.01, ∗∗∗p < 0.001, and ∗∗∗∗p < 0.0001 based on a two-way ANOVA with Fischer's LSD multiple comparison tests comparing LIFRfl/fl and Adipoq-Cre;LIFRfl/fl cohorts. (J–N) LIFRfl/fl and Adipoq-Cre;LIFRfl/fl male mice at 7 weeks of age placed on an HFD were sacrificed at 21 (J), 64 (K and L), or 107 days (M and N), and eWAT was processed for immunoblot analysis with the indicated antibodies (21 (J), 64 (K), or 107 days (J and K, M)) or H&E histopathology as described in transparent methods. Scale bar, 200 μm in (L and N). See also Figure S2.
Figure 4
Figure 4
LIFR-α-induced adipocyte signaling promotes hepatic triacylglyceride accumulation in mice on a high-fat diet (A–J) Representative gross (A and B) and H&E histopathology images of liver from representative LIFRfl/fl and Adipoq-Cre;LIFRfl/fl male mice on an HFD at sacrifice (day 107) from Figures 2. (E–J) Age-matched LIFRfl/fl and Adipoq-Cre;LIFRfl/fl male mice at age 7 (n = 4), 7 (n = 4), 8 (n = 8), 10 (n = 4), 12 (n = 4), 22 (n = 3), or 25 (n = 5) weeks were placed on an HFD and sacrificed after 110, 21, 144, 75, 63, 58, or 42 days, respectively. Body weight, fat mass by ECHO MRI, liver mass, liver TAGs, and liver cholesterol were measured at sacrifice. Linear regression analysis was conducted to determine the association of liver mass (E and H), TAGs (F and I), and cholesterol (G and J) to body weight (E–G) or fat mass (H–J). Data are shown as dot plots with regression line and 95% confidence band. p was calculated using extra sum-of-squares F test for significant differences between regression lines for LIFRfl/fl and Adipoq-Cre;LIFRfl/fl cohorts (E–J). Scale bars: 300 μm in (C) and 200 μm in (D).
Figure 5
Figure 5
Insulin responsiveness and respiration of Adipoq-Cre;LIFRfl/fl mice on a high-fat diet (A and B) LIFRfl/fl and Adipoq-Cre;LIFRfl/fl male mice (n = 4) at 7 weeks of age were placed on an HFD. Glucose tolerance test (A) and insulin tolerance test (B) were performed on animals at the indicated time point as described in transparent methods. Data are shown as mean ± SEM. p calculated by two-tailed unpaired Student's t test for significant differences between the area under curve (baseline 0 mg/dL) for each group. (C–F) LIFRfl/fl and Adipoq-Cre; LIFRfl/fl male mice at 10 weeks of age were placed on a high-fat diet followed by metabolic measurement with CLAMS as described in transparent methods at the indicated time points. Data are shown as dot plots with mean ± SEM. ∗p < 0.05 based on two-way ANOVA with Sidak's multiple comparison tests comparing LIFRfl/fl and Adipoq-Cre;LIFRfl/fl cohorts.
Figure 6
Figure 6
LIF- and IL-6-induced adipocyte lipolysis signaling requires STAT3 (A) Genomic PCR of indicated tissue from male mice at 30 weeks of age from the indicated mouse model using primers for floxed STAT3 allele (top panel), STAT3 allele with deletion of exons 18–20 (middle panel), and Cre (bottom panel). (B and C) qRT-PCR of eWAT (B) or isolated adipocytes from eWAT (C) from four STAT3fl/fl or Adipoq-Cre;STAT3fl/fl male mice at 30 weeks of age for the indicated gene normalized to β-actin. Data are shown as mean ± SEM. ∗p<0.05, ∗∗p<0.01, and ∗∗∗∗p<0.0001 based on two-tailed Student's t test with Bonferroni-Sidak adjustment for multiple comparison tests (D) Immunoblot analysis of whole tissue or adipocytes isolated from eWAT from four STAT3fl/fl or Adipoq-Cre;STAT3fl/fl male mice at 30 weeks of age with the indicated antibody as described. (E–I) Differentiated adipocytes derived from STAT3fl/fl or Adipoq-Cre;STAT3fl/fl male mice at 7 weeks of age were treated with the indicated stimulants. After 20 h, cells were processed for immunoblot analysis (E) and medium NEFA concentrations were measured. Data are shown as dot plots with mean ± SEM (E) or as as mean ± SEM (F-I). ∗∗∗p < 0.001 based on two-way ANOVA with Sidak's adjustment for multiple comparison tests comparing STAT3fl/fl with Adipoq-Cre;STAT3fl/fl cohorts (E) or p value calculated by using non-linear regression to fit a three-variable dose-response model to STAT3fl/fl to Adipoq-Cre;STAT3fl/fl cohorts, followed by an extra sum-of-squares F test for differences between cohort curves (F–I).
Figure 7
Figure 7
STAT3-dependent adipocyte signaling limits adipose expansion promoting hepatic triacylglyceride accumulation (A–D) STAT3fl/fl and Adipoq-Cre;STAT3fl/fl male mice (n = 4) at 8 weeks of age were placed on HFD and fat mass by ECHO MRI (A), lean mass by ECHO MRI (B), and body weight (C) were measured over the indicated time period. Mice were sacrificed, tissues were harvested, and representative H&E images of eWAT and liver were obtained (D, scale bar, 200 μm). Data are shown as mean ± SEM (A-C). p was calculated using non-linear regression to fit a logistic growth curve to each cohort followed by extra sum-of-squares F test for significant differences between cohort curves (A–C). (E) Representative gross whole-body and liver images of STAT3fl/fl and Adipoq-Cre;STAT3fl/fl male mice at 20 weeks of age after being on an HFD for 84 days. (F–K) STAT3fl/fl and Adipoq-Cre;STAT3fl/fl male mice at 7 (n = 3), 7 (n = 3), 8 (n = 6), 8 (n = 4), and 32 (n = 4) weeks of age were placed on an HFD and sacrificed after 93, 126, 84, 136, and 95 days, respectively. Body weight, fat mass by ECHO MRI, liver mass, liver TAGs, and liver cholesterol were measured at sacrifice. Linear regression analysis was conducted to determine the association of liver mass (F and I), TAGs (G and J), and cholesterol (H and K) to body weight (F–H) or fat mass (I–K). Data are shown as scattered plots with regression line and 95% confidence band. p was calculated using sum-of-squares F test for significant differences between linear regression curves (F–K). See also Figure S2.

Similar articles

Cited by

References

    1. Arner P. Relationship between intracellular cyclic AMP and lipolysis in human adipose tissue. Acta Med. Scand. 1976;200:179–186. - PubMed
    1. Arora G.K., Gupta A., Guo T., Gandhi A.Y., Laine A., Williams D.L., Ahn C., Iyengar P., Infante R.E. Janus kinase inhibitors suppress cancer cachexia-associated anorexia and adipose wasting in mice. JCSM Rapid Commun. 2020;3:115–128. - PMC - PubMed
    1. Arora G.K., Gupta A., Narayanan S., Guo T., Iyengar P., Infante R.E. Cachexia-associated adipose loss induced by tumor-secreted leukemia inhibitory factor is counterbalanced by decreased leptin. JCI Insight. 2018;3:e121221. - PMC - PubMed
    1. Auernhammer C.J., Melmed S. Leukemia-inhibitory factor-neuroimmune modulator of endocrine function. Endocr. Rev. 2000;21:313–345. - PubMed
    1. Bischoff S.C., Boirie Y., Cederholm T., Chourdakis M., Cuerda C., Delzenne N.M., Deutz N.E., Fouque D., Genton L., Gil C. Clinical nutrition; 2016. Towards a Multidisciplinary Approach to Understand and Manage Obesity and Related Diseases. - PubMed

LinkOut - more resources