. 2021 Mar 12;2(3):296-312.e8.
doi: 10.1016/j.medj.2021.01.006.

Identifying CNS-colonizing T cells as potential therapeutic targets to prevent progression of multiple sclerosis

Affiliations

Identifying CNS-colonizing T cells as potential therapeutic targets to prevent progression of multiple sclerosis

Max Kaufmann et al. Med. .

Abstract

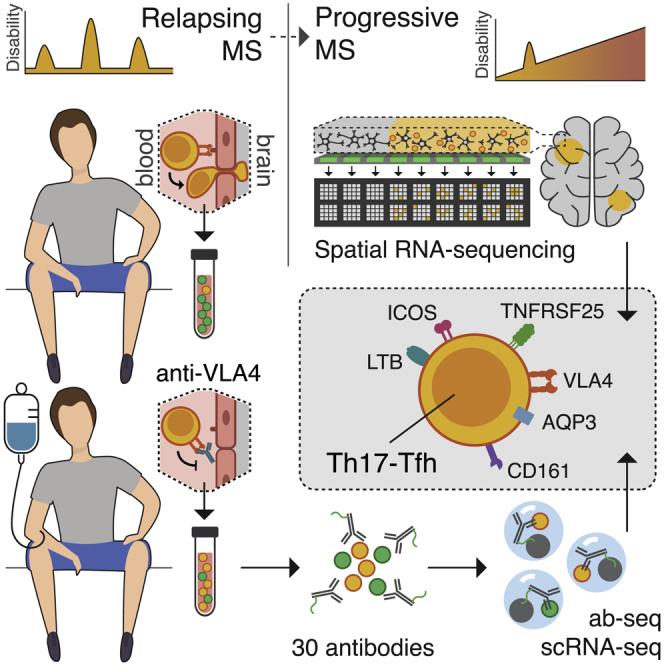
Background: Multiple sclerosis (MS), an autoimmune disease of the central nervous system (CNS), can be suppressed in its early stages but eventually becomes clinically progressive and unresponsive to therapy. Here, we investigate whether the therapeutic resistance of progressive MS can be attributed to chronic immune cell accumulation behind the blood-brain barrier (BBB).

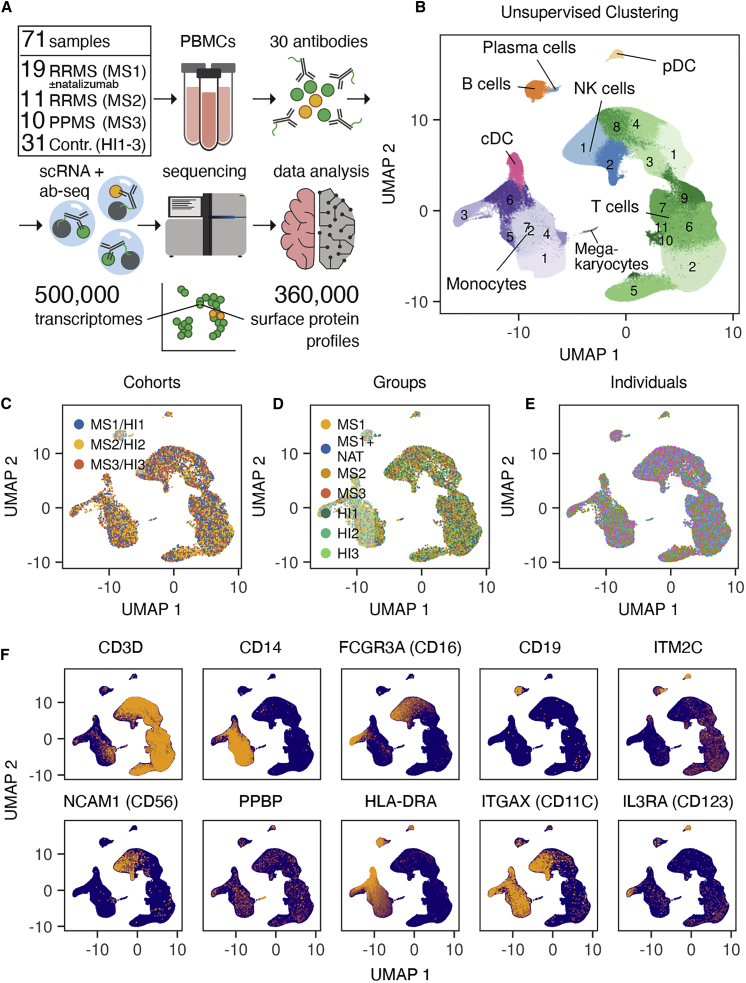
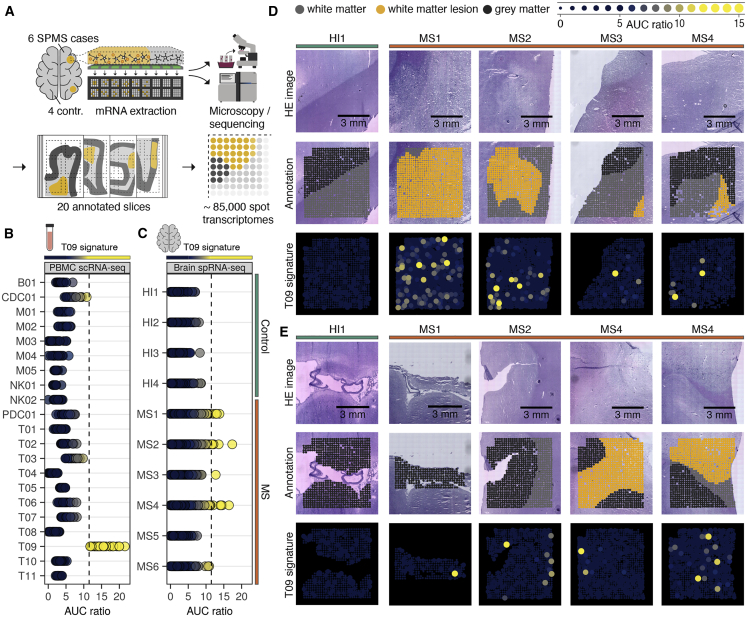
Methods: We systematically track CNS-homing immune cells in the peripheral blood of 31 MS patients and 31 matched healthy individuals in an integrated analysis of 497,705 single-cell transcriptomes and 355,433 surface protein profiles from 71 samples. Through spatial RNA sequencing, we localize these cells in post mortem brain tissue of 6 progressive MS patients contrasted against 4 control brains (20 samples, 85,000 spot transcriptomes).

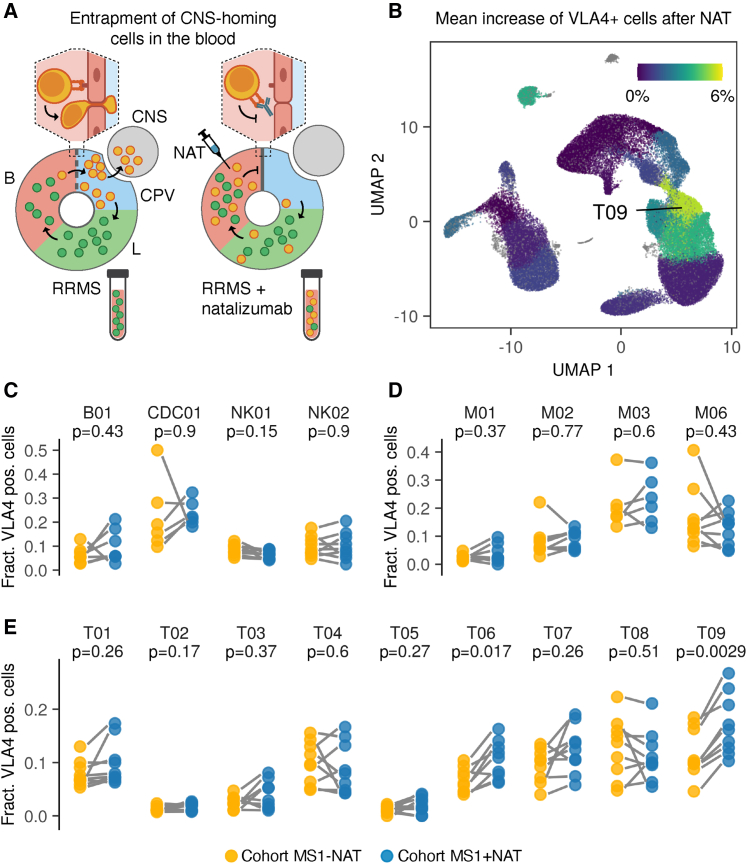
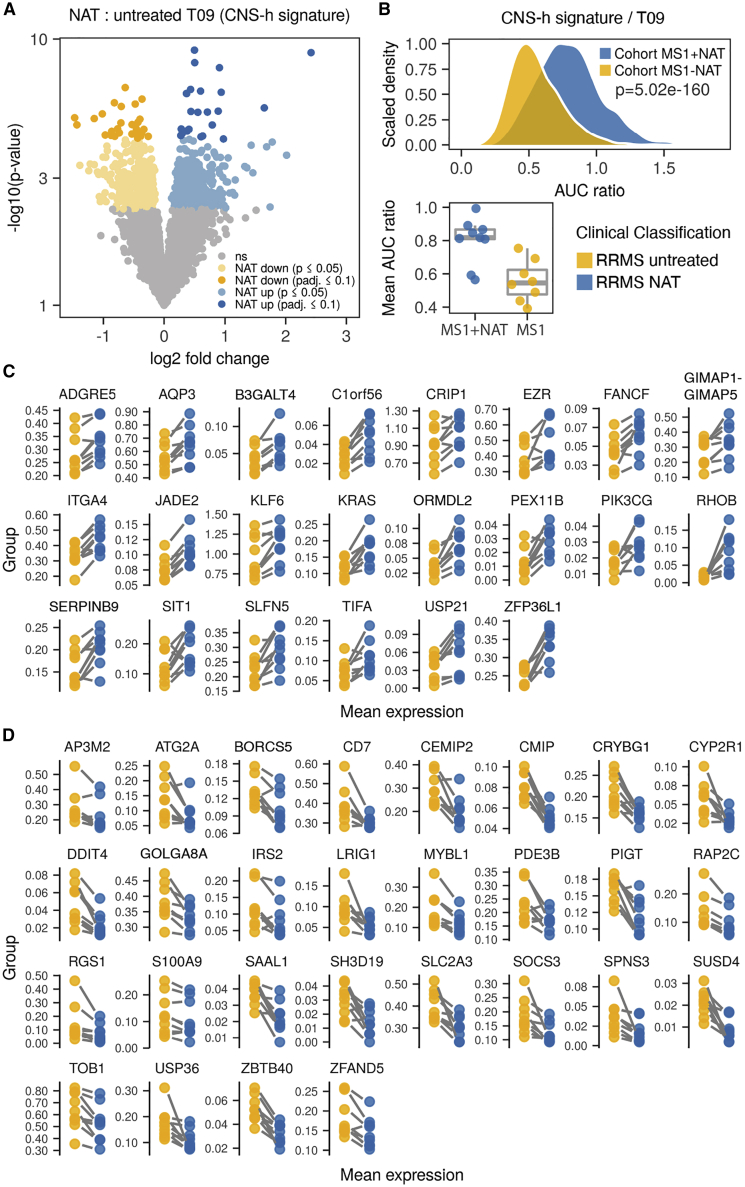
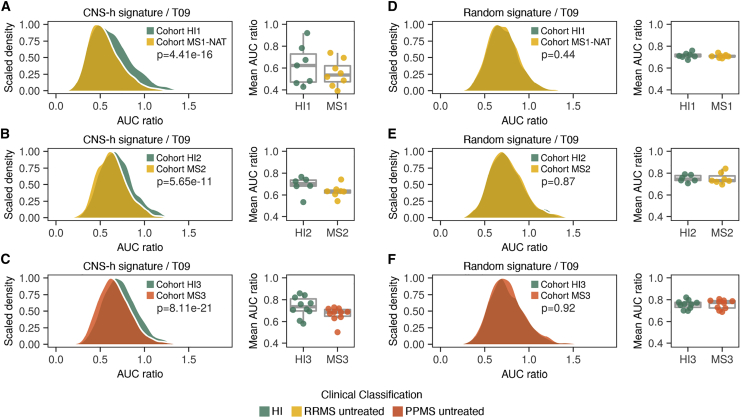
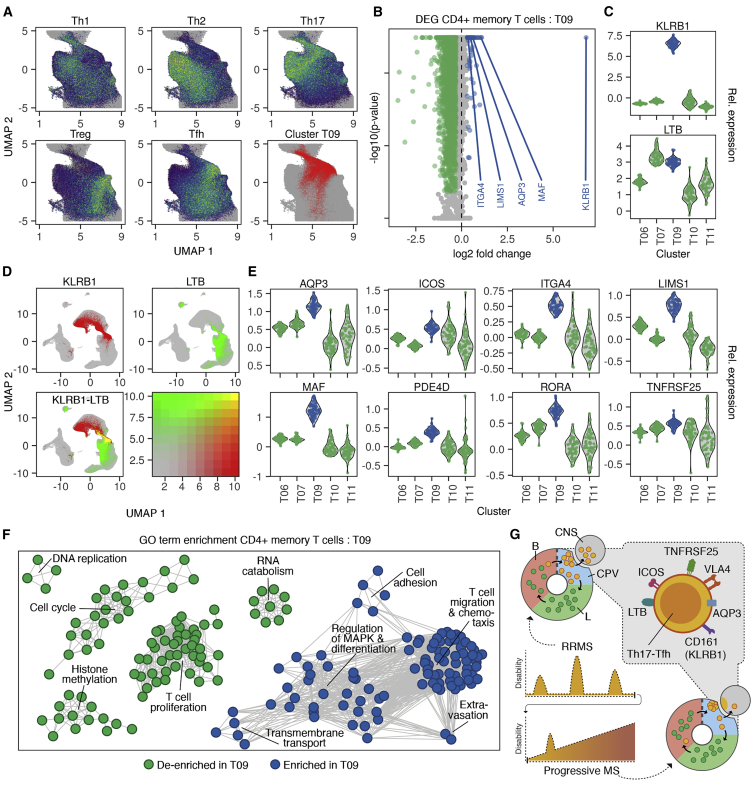
Findings: We identify a specific pathogenic CD161+/lymphotoxin beta (LTB)+ T cell population that resides in brains of progressive MS patients. Intriguingly, our data suggest that the colonization of the CNS by these T cells may begin earlier in the disease course, as they can be mobilized to the blood by usage of the integrin-blocking antibody natalizumab in relapsing-remitting MS patients.

Conclusions: As a consequence, we lay the groundwork for a therapeutic strategy to deplete CNS-homing T cells before they can fuel treatment-resistant progression.

Funding: This study was supported by funding from the University Medical Center Hamburg-Eppendorf, the Stifterverband für die Deutsche Wissenschaft, the OAK Foundation, Medical Research Council UK, and Wellcome.

Keywords: CNS-homing; T cells; Tfh; Th17; multiple sclerosis; natalizumab; scRNA-seq; spatial transcriptomics; therapeutic resistance.


Conflict of interest statement

The authors declare no competing interests.

Figures

None
Graphical abstract
Figure 1
Figure 1
An integrated immune cell map of relapsing-remitting and progressive MS (A) Schematic overview for multimodal analysis of PBMCs from MS patients (cohorts MS1–3) and healthy individuals (cohorts HI1–3). Cohort MS1 contains samples from time points with and without treatment with natalizumab in 9 patients (for 1 patient, only the treated time point was available). (B) Unsupervised clustering of n = 497,705 integrated PBMC single cell transcriptomes from n = 62 donors (cohorts MS1–3 and HI1–3). (C–E) Data integration demonstrated on umap plots. (C) 5,000 randomly drawn cells per cohort are shown. (D) 2,500 randomly drawn cells per group are shown. (E) 500 randomly drawn cells per individual are shown. No color legend is provided because of the large number of individuals (n = 62). (F) Messenger RNA (mRNA) expression of cell type marker genes projected on umap of all cohorts (MS1–3 and HI1–3).
Figure 2
Figure 2
Integration of protein surface profiling for detailed mapping of canonical immune cell subtypes in the transcriptomic space (A and B) Exemplary cell population gating based on sequenced surface marker profiles and imputed mRNA markers of n = 355,433 PBMCs (refer to Figure S1 for the complete gating strategy). Antibody-derived tags (ADTs) indicate that protein surface markers are shown, whereas “RNA” indicates imputed expression values based on the transcriptome. (C and D) Projection of exemplary gated populations on umap (cohorts MS1–3 and HI 1–3). Refer to Figure S2 for projections of all gates. Lines point to the mean coordinates of the indicated populations. (E) Column-scaled heatmap of gate distributions in unsupervised clusters. mono_c, classical monocytes (CD14+ monocytes); mono_i, intermediate monocytes; mono_nc, non-classical monocytes (CD16+ monocytes); NK_CD56bright, CD56-bright NK cells; NK_im, immature NK cells; NK_m, mature NK cells; NK_NKT, NK T cells within NK cell clusters; T_actv, activated T cells; T_CD4, CD4+ T cells; T_CD4_Tcm, CD4+ central memory T cells; T_CD4_Tem, CD4+ effector memory T cells; T_CD4_Tn, naive CD4+ T cells; T_CD4_Tte, CD4+ terminal effector T cells; T_CD4_Ttm, CD4+ T transitional memory cells; T_CD4_Ttm_Tem, CD4+ T transitional memory/CD4+ T effector memory cells; T_CD8, CD8+ T cells; T_CD8_Tcm, CD8+ central memory T cells; T_CD8_Tem, CD8+ T effector memory cells; T_CD8_Tn, naive CD8+ T cells; T_CD8_Tte, CD8+ terminal effector T cells; T_CD8_Ttm, CD8+ T transitional memory cells; T_CD8_Ttm_Tem, CD8+ T transitional memory/CD8+ T effector memory cells; T_CD29hi, CD29-high T cells; T_CD38hi, CD38-high T cells; T_CD49dhi, CD49d-high T cells; T_CD57hi, CD57-high T cells; T_CD161hi_non_MAIT, CD161-high/non-MAIT cells; T_DN, CD4−/CD8− = double negative T cells; T_DP, CD4+/CD8+ = double positive T cells; T_gd, gamma-delta T cells; T_HLADRhi, HLADR-high T cells; T_INKT, invariant NK T cells; T_MAIT, mucosal-associated invariant T cells; T_NKT, NK T cells within T cell clusters; T_PD1hi, PD1-high T cells; T_reg_protein, T regulatory cells based on protein expression; T_reg_RNA, T regulatory cells based on RNA expression; T_VLA4, VLA4+ T cells.
Figure 3
Figure 3
Entrapment of CNS-homing immune cells in the peripheral blood by natalizumab treatment uncovers their origin in cluster T09 (A) Experimental setup to identify CNS-homing immune cells in the blood (B). CNS-associated perivascular compartments (CPV), lymphatic system (L), and natalizumab treatment (NAT) are shown. (B–E) Increase of VLA-4+ cells during natalizumab treatment compared to untreated time points (cohort MS1) in B cells (n = 7 RRMS patients), cDC (n = 6), monocytes (n = 9), NK cells (n = 9), and T cells (n = 9). (B) Mean increase of VLA4+ cells during natalizumab treatment projected on umap. (C) Relative increase of VLA4+ cells during natalizumab treatment for B cells, cDC, and NK cell subpopulations. (D) Relative increase of VLA4+ cells during natalizumab treatment for monocyte subpopulations. (E) Relative increase of VLA4+ cells during natalizumab treatment for T cell subpopulations. FDR-adjusted paired two-tailed t tests were used in (C–E).
Figure 4
Figure 4
Differential gene expression analysis between T09 cells with and without natalizumab treatment identifies their CNS-homing signature (A) Differentially expressed genes in cluster T09 between natalizumab-treated and untreated time points (cohort MS1), termed CNS-homing signature (CNS-h). (B) Comparison of single-cell gene set enrichment of the CNS-h signature in cluster T09 for n = 150 cells per sample and mean gene set enrichment averaged for each sample (lower panel). n = 9 samples from natalizumab-treated RRMS patients and n = 8 samples from untreated time points of the same patients (cohort MS1) are shown. (C and D) Mean mRNA expression in cluster T09 of indicated genes for n = 9 RRMS patients with and without natalizumab treatment (cohort MS1). (C) Significantly upregulated genes with natalizumab treatment (adjusted p value of DEseq2 analysis ≤ 0.1). (D) Significantly downregulated genes with natalizumab treatment (adjusted p value of DEseq2 analysis ≤ 0.1). p values in (A, C, and D) are derived from differential gene expression analysis with DEseq2. False discovery rate (FDR)-adjusted paired two-tailed t tests were used in (B).
Figure 5
Figure 5
CNS-homing immune cells are reduced in the blood of relapsing-remitting and progressive MS patients (A–F) Comparisons of single-cell gene set enrichment of the CNS-h signature (A–C) or a control signature of random genes (D–F) in cluster T09 for indicated cohorts with n = 150 cells per sample and mean gene set enrichment averaged for each sample (right panels). (A and D) Samples from n = 8 RRMS patients without treatment (cohort MS1) compared with n = 7 HI (cohort HI1). (B and E) Samples from n = 7 RRMS patients without treatment (cohort MS2) compared with n = 6 HI (cohort HI2). (C and F) Samples from n = 10 PPMS patients without treatment (cohort MS3) compared with n = 10 HI (cohort HI3). FDR-adjusted paired two-tailed t tests were used in (A)–(F).
Figure 6
Figure 6
CNS-homing T09 cells localize to the white and gray matter in secondary progressive MS (A) Schematic overview for spatial RNA sequencing of MS brain tissue. (B) T09 signature enrichment for PBMC scRNA-seq data from n = 30 MS patients (cohorts MS1–3). Dots represent pseudobulks per sample. The dashed line indicates the cutoff chosen for signature enrichment (AUC ratio = 11.5), above which enrichment was found to be specific for cluster T09 within all PBMC populations. (C) T09 signature enrichment for spatial RNA sequencing (spRNA-seq) data of brain slices from n = 4 control donors and n = 6 SPMS patients. Dots represent individual spot transcriptomes as indicated in (A). (D and E) Representative spatial localization of T09 gene set enrichment in white matter (D) and gray matter (E).
Figure 7
Figure 7
T09 cells have an overlapping Th17-Tfh phenotype characterized by targetable surface markers (A) Gene set enrichment of T helper cell signatures derived from publicly available data projected on umap plots of the CD4 memory T cell (CD4mem) compartment. The localization of T09 cells in CD4mem is indicated in the lower right panel. All cohorts (MS1–3 and HI1–3) are shown. (B) Differential gene expression (DEG) analysis contrasting single-cell transcriptomes of T09 cells (n = 19,874) and other CD4mem cells (n = 73,002). All cohorts (MS1–3 and HI1–3) were used. (C) Mean mRNA expression per individual (n = 62; cohorts MS1–3 and HI1–3) for KLRB1 and LTB in CD4mem clusters. (D) (Co-)expression of KLRB1 and LTB projected on umap for all cohorts (MS1–3 and HI1–3). (E) Mean mRNA expression per individual (n = 62; cohorts MS1–3 and HI1–3) for selected T09 markers in CD4mem clusters. (F) Top 100 uniquely enriched or de-enriched GO terms in T09 markers from (B). Nodes indicate GO terms; edges represent shared genes between GO terms. (G) Schematic indicating the surface marker profile of T09 cells homing to the CNS of RRMS and progressive MS patients.

Comment in

References

    1. Dendrou C.A., Fugger L., Friese M.A. Immunopathology of multiple sclerosis. Nat. Rev. Immunol. 2015;15:545–558. - PubMed
    1. Polman C.H., O’Connor P.W., Havrdova E., Hutchinson M., Kappos L., Miller D.H., Phillips J.T., Lublin F.D., Giovannoni G., Wajgt A., AFFIRM Investigators A randomized, placebo-controlled trial of natalizumab for relapsing multiple sclerosis. N. Engl. J. Med. 2006;354:899–910. - PubMed
    1. Kapoor R., Ho P.-R., Campbell N., Chang I., Deykin A., Forrestal F., Lucas N., Yu B., Arnold D.L., Freedman M.S., ASCEND investigators Effect of natalizumab on disease progression in secondary progressive multiple sclerosis (ASCEND): a phase 3, randomised, double-blind, placebo-controlled trial with an open-label extension. Lancet Neurol. 2018;17:405–415. - PubMed
    1. Scalfari A., Romualdi C., Nicholas R.S., Mattoscio M., Magliozzi R., Morra A., Monaco S., Muraro P.A., Calabrese M. The cortical damage, early relapses, and onset of the progressive phase in multiple sclerosis. Neurology. 2018;90:e2107–e2118. - PubMed
    1. Magliozzi R., Howell O.W., Reeves C., Roncaroli F., Nicholas R., Serafini B., Aloisi F., Reynolds R. A Gradient of neuronal loss and meningeal inflammation in multiple sclerosis. Ann. Neurol. 2010;68:477–493. - PubMed

Publication types

MeSH terms