. 2021 Aug;44(8):2672-2686.
doi: 10.1111/pce.14052. Epub 2021 Apr 6.

Herbivore-induced plant volatiles mediate defense regulation in maize leaves but not in maize roots

Affiliations

Herbivore-induced plant volatiles mediate defense regulation in maize leaves but not in maize roots

Cong van Doan et al. Plant Cell Environ. 2021 Aug.

Abstract

Plant leaves that are exposed to herbivore-induced plant volatiles (HIPVs) respond by increasing their defenses, a phenomenon referred to as priming. Whether this phenomenon also occurs in the roots is unknown. Using maize plants, Zea mays, whose leaves respond strongly to leaf HIPVs, we measured the impact of belowground HIPVs, emanating from roots infested by the banded cucumber beetle, Diabrotica balteata, on constitutive and herbivore-induced levels of defense-related gene expression, phytohormones, volatile and non-volatile primary and secondary metabolites, growth and herbivore resistance in roots of neighbouring plants. HIPV exposure did not increase constitutive or induced levels of any of the measured root traits. Furthermore, HIPV exposure did not reduce the performance or survival of D. balteata on maize or its ancestor teosinte. Cross-exposure experiments between HIPVs from roots and leaves revealed that maize roots, in contrast to maize leaves, neither emit nor respond strongly to defense-regulating HIPVs. Together, these results demonstrate that volatile-mediated defense regulation is restricted to the leaves of maize. This finding is in line with the lower diffusibility of volatiles in the soil and the availability of other, potentially more efficient, information conduits below ground.

Keywords: belowground plant-herbivore interactions; plant-plant interactions; priming; root defenses.


Conflict of interest statement

The authors declare having no conflict of interest.

Figures
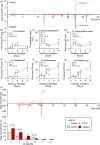
FIGURE 1
FIGURE 1
Root herbivory triggers the production and emission of a distinct volatile bouquet by maize roots. (a) Representative chromatograms of volatiles produced by control roots (green) and roots infested with Diabrotica balteata (dark red) for 4 days. The peak numbering (1–6) corresponds to the compounds significantly different between treatments as listed in Figure 1b–g. (b) α‐copaene (1), (c) (E)β‐caryophyllene (2), (d) caryophyllene oxide (3), (e) tetradecanal (4), (f) pentadecanal (5), and (g) tetradecenal (6) production by control (green) and infested maize roots (dark red) over 8 days (Mean ± SE, Two‐way ANOVA, n = 5–7). (E)β‐Caryophyllene was identified and quantified using a standard curve of the pure compound. Other compounds were tentatively identified by using the NIST05 library (Match >85%) and retention times correspondence with previous analyses. Tmt, treatment; cps, counts per second; ns, non‐significant. (h) Average chromatograms of root volatile emissions of control (green) and infested (dark red) plants 4 days after infestation. The peak numbering 7–11) indicates peaks whose emission was changed (p < .10) upon root herbivory. Peaks 10 and 11 were at the limit of quantification. (i) Volatile compounds whose emission was changed (p < .10) upon root herbivory (Student t‐tests and Mann–Whitney Rank Sum tests, n = 4). The peak numbering corresponds to compounds whose emission was significantly different between treatments as numbered in Figure 1h. cps, counts per second. Stars indicate significant differences (*p ≤ .05, **p ≤ .01; ***p ≤ .001)
FIGURE 2
FIGURE 2
Belowground herbivore‐induced plant volatiles (HIPVs) do not affect plant metabolism in absence of herbivory. (a) Ln fold changes in gene expression (Mean ± SE, Student's t‐tests and Mann–Whitney U tests, n = 9) in maize roots exposed for 4 days to plants infested with six Diabrotica balteata larvae (HIPVs) relative to maize roots exposed to control plants. The description of the selected marker genes can be found in Table S1. (B) Phytohormone concentrations (Mean ± SE, Mann–Whitney U tests, n = 9) in maize roots exposed for 4 days to control plants (control, green) or to plants infested with six D. balteata larvae (HIPVs, dark red). OPDA, cis‐12‐oxo‐phytodienoic acid; JA, jasmonic acid; JA‐Ile, jasmonic acid isoleucine conjugate; SA, salicylic acid; ABA, abscisic acid. (c–f) Concentrations (Mean ± SE, Student's t‐tests and Mann–Whitney U tests, n = 9) of (c) carbohydrates: Glc, glucose; Fru, fructose; Suc, sucrose; Star, starch; (d) proteins, (e) amino acids (Ala, alanine; Arg, arginine; Asn, asparagine; Asp, aspartic acid; Cys, cysteine; Gln, glutamine; Glu, glutamic acid; Gly, glycine; His, histidine; Ile, isoleucine; Leu, leucine; Lys, lysine; Met, methionine; Phe, phenylalanine; Pro, proline; Ser, serine; Thr, threonine; Trp, tryptophan; Tyr, tyrosine; Val, valine), and (f) benzoxazinoids in roots of maize plants exposed for 4 days to control plants (control, green) or to plants infested with six D. balteata larvae (HIPVs, dark red). Benzoxazinoid full names can be found in Table S2. (g) terpene volatiles emissions by roots of maize plants exposed for 4 days to control plants (control, green) or to plants infested with six D. balteata larvae (HIPVs, dark red). Each symbol represents a single replicate. (h,i Principal Component Analysis of all features detected (PCA, n = 9) in roots of maize plants exposed for 4 days to control plants (control, green) or to plants infested with six D. balteata larvae (HIPVs, dark red) using untargeted metabolomic analysis in (h) negative (511 features) and (i) positive modes (1763 features). Each symbol represents a single replicate. (j) Principal Component Analysis of volatile emissions (PCA, n = 9). EβC, (E)β‐caryophyllene; C. oxide, caryophyllene oxide. Stars indicate significant differences, *p ≤ .05) [Colour figure can be viewed at wileyonlinelibrary.com]
FIGURE 3
FIGURE 3
Exposure to an infested neighboring plant does not change the plant response to D. balteata's attack. (a) Heatmap comparison of control‐ and HIPV‐exposed root gene expression upon herbivory. The heatmap visually represents fold changes in marker gene expression of maize roots exposed for 4 days to plants infested with six Diabrotica balteata larvae plants prior attack by D. balteata for 1–12 hr and maize roots exposed to control plants prior attack by D. balteata for 1–12 hr. All data are represented relatively to plants exposed to control plants and then infested for 1 hr (Mean, Two‐way ANOVA, n = 3–7). Marker genes whose expression was time‐dependent are indicated in bold. Marker genes whose expression was affected by previous exposure are labelled with a star. Significant post‐hoc comparisons between treatments and within time are indicated with different letters on the corresponding locations on the heatmap. (b) Heatmap comparison of control‐ and HIPV‐exposed root primary metabolism upon herbivory. The heatmap visually represents fold changes in primary metabolite concentrations in maize roots exposed for 4 days to plants infested with six Diabrotica balteata larvae plants prior attack by D. balteata for 1–12 hr and maize roots exposed to control plants prior attack by D. balteata for 1–12 hr. All data are represented relatively to plants exposed to control plants and then infested for 1 hr (Mean, Two‐way ANOVA, n = 3–7). Glc, glucose; Fru, fructose; Suc, sucrose; Star, starch; Prot, proteins; Ala, Alanine; Arg, Arginine; Asn, Asparagine; Asp, Aspartic acid; Cys, Cysteine; Gln, Glutamine; Glu, Glutamic acid; Gly, Glycine; His, Histidine; Ile, Isoleucine; Leu, Leucine; Lys, Lysine; Met, Methionine; Phe, Phenylalanine; Pro, Proline; Ser, Serine; Thr, Threonine; Trp, Tryptophan; Tyr, Tyrosine; Val, Valine. Compounds whose levels were time‐dependent are indicated in bold. Compounds whose levels were affected by previous exposure are labelled with a star. Significant post‐hoc comparisons between treatments and within time are indicated with different letters on the corresponding locations on the heatmap. (c) Heatmap comparison of control‐ and HIPV‐exposed root secondary metabolism upon herbivory. The heatmap visually represents fold changes in hormone levels, secondary metabolite concentrations and volatile present in frozen‐ground‐thawed roots of maize plants exposed for 4 days to plants infested with six Diabrotica balteata larvae plants prior attack by D. balteata for 1–12 hr and maize roots exposed to control plants prior attack by D. balteata for 1–12 hr. All data are represented relatively to plants exposed to control plants and then infested for 1 hr (Mean, Two‐way ANOVA, n = 3–7). OPDA, cis‐12‐oxo‐phytodienoic acid; JA, jasmonic acid; JA‐Ile, jasmonic acid isoleucine conjugate; SA, Salicylic acid; ABA, abscisic acid. Benzoxazinoid full names can be found in Table S2. EβC, (E)‐β‐caryophyllene; C. oxide, caryophyllene oxide. Compounds whose levels were time‐dependent are indicated in bold. (d–f) Principal Component Analysis of all features detected (PCA, n = 3–7) in maize roots exposed for 4 days to control plants (control, green) or to plants infested with six D. balteata larvae (HIPVs, dark red) prior attack by D. balteata for 1–12 hr, using untargeted metabolomic analysis in (d) negative (443 features) and (e) positive modes (1906 features). (f) Principal Component Analysis of volatile emissions (PCA, n = 3–7). In PCAs, each point represents the average per treatment per time point. No interaction between time and exposure was found to be significant in any of the tested markers [Colour figure can be viewed at wileyonlinelibrary.com]
FIGURE 4
FIGURE 4
Exposure to an infested neighboring plant does not alter plant defense to herbivory. (a) Larval weight gain (Mean ± SE, Student's t‐tests) of the root herbivore Diabrotica balteata feeding for 4 days on maize (n = 17–18) or teosinte (n = 8–9) previously exposed for 4 days to control plants (control, green) or to plants infested with six D. balteata larvae (HIPVs, dark red). (b) Proportions (Mean ± SE, Student's t‐tests) of D. balteata recovered after 4 days infested on maize (n = 18) and teosinte (n = 9) previously exposed for 4 days to control plants (control, green) or to plants infested with six D. balteata larvae (HIPVs, dark red). (c) D. balteata damage scaling (Mean ± SE, Student's t‐tests) after 4 days infestation of maize (n = 18) and teosinte (n = 9) plants previously exposed for 4 days to control plants (control, green) or to plants infested with six D. balteata larvae (HIPVs, dark red). (d) Root fresh mass after 4 days infestation by the root herbivore D. balteata (Mean ± SE, Student's t‐tests) of maize (n = 18) and teosinte (n = 9) previously exposed for 4 days to control plants (control, green) or to plants infested with six D. balteata larvae (HIPVs, dark red). Spotted lines indicate that maize and teosinte were tested in independent experiments. No significant difference was observed [Colour figure can be viewed at wileyonlinelibrary.com]
FIGURE 5
FIGURE 5
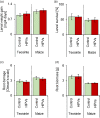
Only leaf exposure to leaf HIPVs leads to a decreased performance of Spodoptera littoralis caterpillars. (a) Larval weight gain (Mean ± SE, n = 4–5) of the leaf herbivore S. littoralis feeding for 2 days on leaves previously exposed for one night to control plants (control, green) or to plants infested with six D. balteata larvae (HIPVs, dark red). (b) Larval weight gain (Mean ± SE, Two‐way ANOVA, n = 4–5) of the root herbivore D. balteata feeding for 2 days on roots previously exposed for one night to control plants (control, green) or to plants infested with six D. balteata larvae (HIPVs, dark red). Stars indicate significant differences (*p ≤ .05; ***p ≤ .001) [Colour figure can be viewed at wileyonlinelibrary.com]

Similar articles

Cited by

References

    1. Ali, J. G., Alborn, H. T., & Stelinski, L. L. (2010). Subterranean herbivore‐induced volatiles released by citrus roots upon feeding by Diaprepes abbreviatus recruit entomopathogenic nematodes. Journal of Chemical Ecology, 36(4), 361–368. 10.1007/s10886-010-9773-7 - DOI - PubMed
    1. Ameye, M., Allmann, S., Verwaeren, J., Smagghe, G., Haesaert, G., Schuurink, R. C., & Audenaert, K. (2018). Green leaf volatile production by plants: A meta‐analysis. New Phytologist, 220(3), 666–683. 10.1111/nph.14671 - DOI - PubMed
    1. Arimura, G.‐i., Ozawa, R., Horiuchi, J. I., Nishioka, T., & Takabayashi, J. (2001). Plant–plant interactions mediated by volatiles emitted from plants infested by spider mites. Biochemical Systematics and Ecology, 29(10), 1049–1061. 10.1016/S0305-1978(01)00049-7 - DOI
    1. Arimura, G. I., Ozawa, R., Shimoda, T., Nishioka, T., Boland, W., & Takabayashi, J. (2000). Herbivory‐induced volatiles elicit defence genes in lima bean leaves. Nature, 406(6795), 512–515. 10.1038/35020072 - DOI - PubMed
    1. Baldwin, I. T. (2010). Plant volatiles. Current Biology, 20(9), R392–R397. 10.1016/j.cub.2010.02.052 - DOI - PubMed

Publication types

Substances