. 2021 Apr 20;60(15):1178-1190.
doi: 10.1021/acs.biochem.0c00974. Epub 2021 Mar 22.

Protein Dynamics Influence the Enzymatic Activity of Phospholipase A/Acyltransferases 3 and 4

Affiliations

Protein Dynamics Influence the Enzymatic Activity of Phospholipase A/Acyltransferases 3 and 4

Soumya Deep Chatterjee et al. Biochemistry. .

Abstract

Phospholipase A/acyltransferase 3 (PLAAT3) and PLAAT4 are enzymes involved in the synthesis of bioactive lipids. Despite sequential and structural similarities, the two enzymes differ in activity and specificity. The relation between the activity and dynamics of the N-terminal domains of PLAAT3 and PLAAT4 was studied. PLAAT3 has a much higher melting temperature and exhibits less nanosecond and millisecond dynamics in the active site, in particular in loop L2(B6), as shown by NMR spectroscopy and molecular dynamics calculations. Swapping the L2(B6) loops between the two PLAAT enzymes results in strongly increased phospholipase activity in PLAAT3 but no reduction in PLAAT4 activity, indicating that this loop contributes to the low activity of PLAAT3. The results show that, despite structural similarity, protein dynamics differ substantially between the PLAAT variants, which can help to explain the activity and specificity differences.


Conflict of interest statement

The authors declare no competing financial interest.

Figures

Figure 1
Figure 1
Crystal (A and B) and NMR (C and D) structures of PLAAT2, PLAAT3, and PLAAT4. The PDB entry codes are indicated in brackets.,, Dashed lines in A and B are indicated for visual continuity of the loops.
Figure 2
Figure 2
15N relaxation data for PLAAT3 (solid circles) and PLAAT4 (open circles) at 14 and 20 T. The 15N-NOE, 15N-T1, and 15N-T2 as well as T1/T2 are plotted against the residue number. Errors were estimated by the Monte Carlo method using 95% confidence level as incorporated in the Bruker Protein Dynamics software suite.
Figure 3
Figure 3
Representation of salt bridge networks (yellow dashes) in PLAAT3 (PDB ID: 2KYT) (A) and PLAAT4 (PDB ID: 2MY9) (B). Salt bridges were defined as a pair of basic and acidic residues with a nitrogen and an oxygen atom of the basic and acidic side chains, respectively, within 3.2 Å in at least one of the 20 NMR structures. Green spheres represent the Cα atoms of the bridged residues. (C) Modified nomenclature of PLAAT3 (red, PDB ID: 2KYT) and PLAAT-4 (blue, PDB ID: 2MY9) according to Table S2 is included for reference.
Figure 4
Figure 4
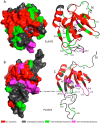
NMR-based analysis of mobility. Dynamics profiles mapped on the structures of PLAAT3 (A), PDB ID: 2KYT, and PLAAT4 (B), PDB ID: 2MY9. Unassigned residues are shown in gray, residues showing neither fast nor slow time scale motions are shown in red, residues showing only slow time scale dynamics are in pink, and residues showing only fast time scale dynamics are shown in green. Residues in fast or slow time scale motions are labeled. The dynamic patch present in PLAAT4 that includes the catalytic triad residues H23 and H35 is labeled.
Figure 5
Figure 5
Molecular dynamics simulations of PLAAT3 and PLAAT4. (A) Plot of all-atom RMSD. Each point represents a snapshot saved at every picosecond. PLAAT4 shows a higher RMSD, suggesting significant conformational fluctuations and rearrangements with respect to the starting structure. (B, C) Fluctuations per residue. For each residue, the largest RMS fluctuation of all its atoms along the two largest eigenvectors (denoted as Seed1_eigrmsf1 and Seed2_eigrmsf2) of the principal component analysis in the MD runs is plotted for PLAAT3 (B) and PLAAT4 (C). A cutoff of 2 Å is indicated with a dashed line. Secondary structure of the starting structure is indicated at the top and named as in Table S2. (D, E) Results of principal component analysis of the MD simulations. Residues colored in red in PLAAT3 (D) and PLAAT4 (E) show RMS fluctuations above the cutoff of 2 Å. Apart from the C terminus, two distinct regions in PLAAT3 (19–22 and 43–55) were observed having concerted motions, bringing them closer, while rest of the protein stays relatively rigid. PLAAT4 has three distinct mobile regions apart from the N and the C termini. Loop L1 shows disordered movement, whereas regions 108–111 and 82–86 and residue 113 all show correlated motions.
Figure 6
Figure 6
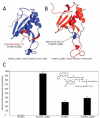
Models of mutants of PLAAT3-L2(B6)4 (A) and PLAAT4-L2(B6)3 (B). The mutated regions are shown in contrasting colors. (C) Phospholipase assay with Red/Green BODIPY PC-A2 (inset). The activity toward Red/Green BODIPY PC-A2 is plotted for PLAAT wild-type and loop mutants.
Figure 7
Figure 7
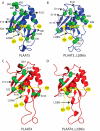
Salt bridges in wild-type and loop mutant PLAAT proteins. Residues involved in salt bridges with an average occupancy of at least 20% in the two 100 ns MD runs are shown with green spheres for Cα atoms. Dashed lines indicate the presence of salt bridges between the side chains of the connected residues in wild-type only (red), wild-type and mutant (gray), or mutant only (yellow) for PLAAT3 (A), PLAAT3_L2(B6)4 (B), PLAAT4 (C), and PLAAT4_L2(B6)3 (D). The residues of the catalytic triad are marked in yellow.

Similar articles

Cited by

References

    1. Ito H.; Akiyama H.; Shigeno C.; Nakamura T. (2001) Isolation, characterization, and chromosome mapping of a human A-C1 Ha-Ras suppressor gene (HRASLS). Cytogenet. Genome Res. 93, 36–39. 10.1159/000056944. - DOI - PubMed
    1. Golczak M.; Kiser P. D.; Sears A. E.; Lodowski D. T.; Blaner W. S.; Palczewski K. (2012) Structural basis for the acyltransferase activity of lecithin:retinol acyltransferase-like proteins. J. Biol. Chem. 287, 23790–23807. 10.1074/jbc.M112.361550. - DOI - PMC - PubMed
    1. Jin X.-H.; Uyama T.; Wang J.; Okamoto Y.; Tonai T.; Ueda N. (2009) cDNA cloning and characterization of human and mouse Ca2+-independent phosphatidylethanolamine N-acyltransferases. Biochim. Biophys. Acta, Mol. Cell Biol. Lipids 1791, 32–38. 10.1016/j.bbalip.2008.09.006. - DOI - PubMed
    1. Ruiz A.; Winston A.; Lim Y.-H.; Gilbert B. A.; Rando R. R.; Bok D. (1999) Molecular and biochemical characterization of lecithin retinol acyltransferase. J. Biol. Chem. 274, 3834–3841. 10.1074/jbc.274.6.3834. - DOI - PubMed
    1. Kiser P. D.; Golczak M.; Maeda A.; Palczewski K. (2012) Key enzymes of the retinoid (visual) cycle in vertebrate retina. Biochim. Biophys. Acta, Mol. Cell Biol. Lipids 1821, 137–151. 10.1016/j.bbalip.2011.03.005. - DOI - PMC - PubMed

MeSH terms

Substances

LinkOut - more resources