. 2021 Nov;24(14):1552-1565.
doi: 10.1080/10255842.2021.1900134. Epub 2021 Mar 22.

Muscle metabolic energy costs while modifying propulsive force generation during walking

Affiliations

Muscle metabolic energy costs while modifying propulsive force generation during walking

Richard E Pimentel et al. Comput Methods Biomech Biomed Engin. 2021 Nov.

Abstract

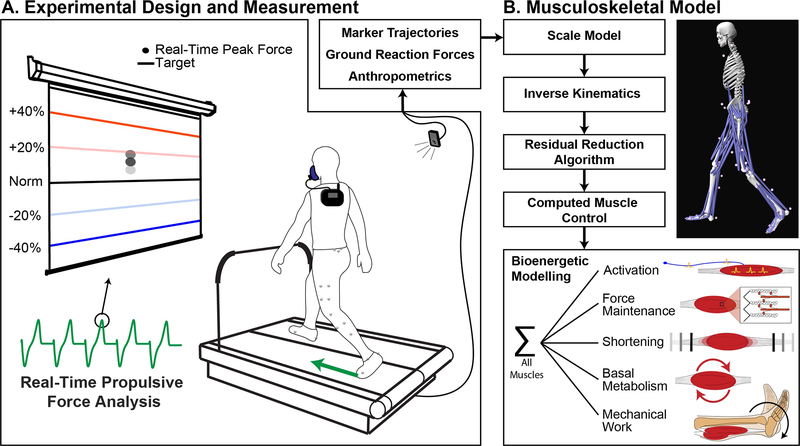
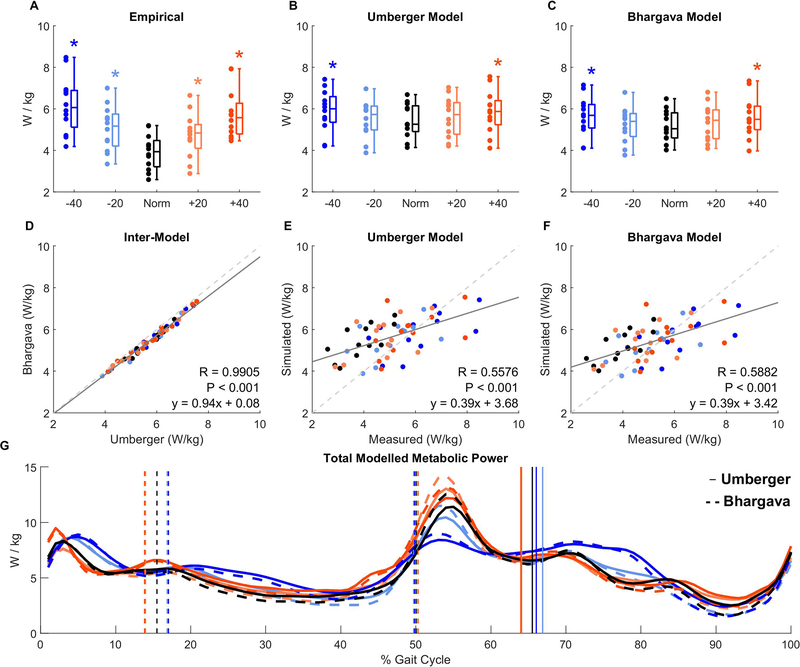
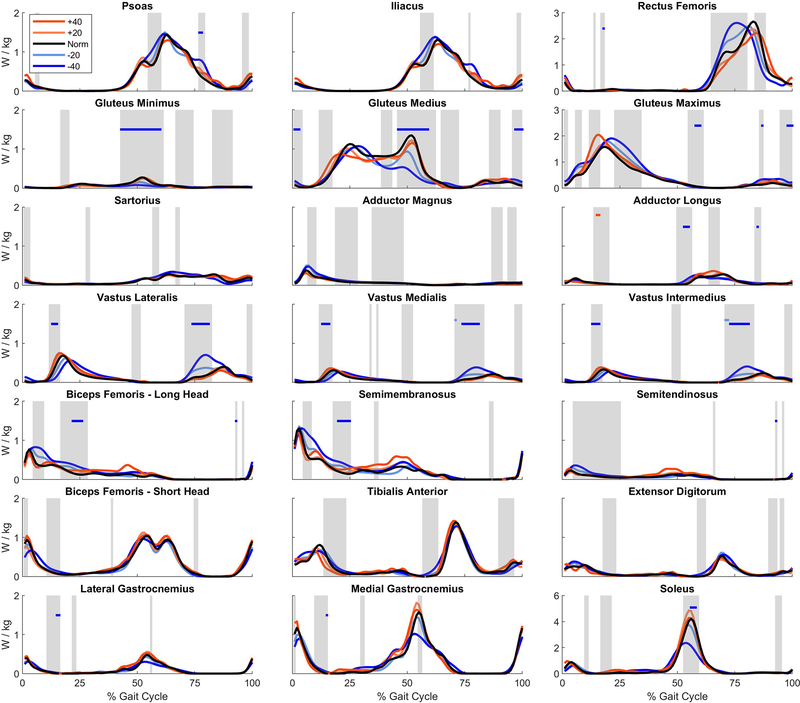
We pose that an age-related increase in the metabolic cost of walking arises in part from a redistribution of joint power where muscles spanning the hip compensate for insufficient ankle push-off and smaller peak propulsive forces (FP). Young adults elicit a similar redistribution when walking with smaller FP via biofeedback. We used targeted FP biofeedback and musculoskeletal models to estimate the metabolic costs of operating lower limb muscles in young adults walking across a range of FP. Our simulations support the theory of distal-to-proximal redistribution of joint power as a determinant of increased metabolic cost in older adults during walking.

Keywords: Modeling; aging; biofeedback; power; redistribution; treadmill.


Figures

Figure 1:
Figure 1:
Participants pushed off the ground with varying vigor to target −40%, −20%, +20%, +40%, and their typical (Norm) propulsive force (FP) in a walking biofeedback paradigm with 5-minute trials per condition. Participant anthropometrics, marker trajectories, and ground reaction forces from the final 2 minutes of each trial defined musculoskeletal modeling simulations. We simulated the first left and right full stride from the 10 second window with the most accurate biofeedback targeting performance. From these simulations, we ultimately determined the metabolic power required from each lower body muscle to drive the scaled model and match the measured movements.
Figure 2:
Figure 2:
For each biofeedback condition, we display the walking metabolic power empirically measured using indirect calorimetry (A) and simulated from two different musculoskeletal metabolic models (B, C). The models produced nearly identical results (D) that correlated moderately with empirically-measured metabolic power (E, F), explaining about 1/3rd of the variance. Musculoskeletal modeling of metabolic power allows researchers to estimate the metabolic power required for lower body muscles to drive a simulation of each participant’s individual walking pattern. This allows for comparison across the FP biofeedback conditions at specific instances of the gait cycle (G). Given the high similarity of the two models, we opted to use the Umberger model for our metabolic cost estimates and statistical comparisons.
Figure 3:
Figure 3:
For each biofeedback condition, we show net metabolic power summed for all modeled lower body muscles (A), and for those spanning each of the major joints of the lower limb (B, C, D). Metabolic powers were integrated over: the entire stride, leading limb double support, single limb support, trailing limb double support, and swing phase. Asterisks show significant LSD post hoc pairwise differences versus Norm in the presence of a significant ANOVA main effect. On the right, we also display instantaneous net metabolic power across the gait cycle.
Figure 4:
Figure 4:
We plot the metabolic powers across the gait cycle for the 21 highest power-consuming muscles of the lower limb for each biofeedback condition. Gray shaded regions show periods with a significant repeated measures ANOVA main effect for biofeedback condition using statistical parametric mapping. Colored blocks identify any LSD post hoc pairwise differences for that respective colored condition versus Norm. OpenSim muscles with multiple lines of action (gluteus minimus/medius/maximus and adductor magnus) were summed for simplicity.

References

    1. Arnold EM, Hamner SR, Seth A, Millard M, Delp SL. 2013. How muscle fiber lengths and velocities affect muscle force generation as humans walk and run at different speeds. J Exp Biol. 216(11):2150–2160. - PMC - PubMed
    1. Bell AL, Pedersen DR, Brand RA. 1990. A Comparison of the Accuracy of Several Hip Center. J Biomech. 23(November):6–8. - PubMed
    1. Bhargava LJ, Pandy MG, Anderson FC. 2004. A phenomenological model for estimating metabolic energy consumption in muscle contraction. J Biomech. 37(1):81–88. - PubMed
    1. Boyer KA, Johnson RT, Banks JJ, Jewell C, Hafer JF. 2017. Systematic review and meta-analysis of gait mechanics in young and older adults. Exp Gerontol. 95(September):63–70. - PubMed
    1. Brockway JM. 1987. Brockway_1987_HumNut - Derivation of formulae used to calculate energy expenditure in man.pdf. Hum Nutr Clin Nutr. 41(C):463–71. - PubMed