. 2021 Dec;17(12):4141-4158.
doi: 10.1080/15548627.2021.1904495. Epub 2021 Apr 5.

Platelet autophagic machinery involved in thrombosis through a novel linkage of AMPK-MTOR to sphingolipid metabolism

Affiliations

Platelet autophagic machinery involved in thrombosis through a novel linkage of AMPK-MTOR to sphingolipid metabolism

Tzu-Yin Lee et al. Autophagy. 2021 Dec.

Abstract

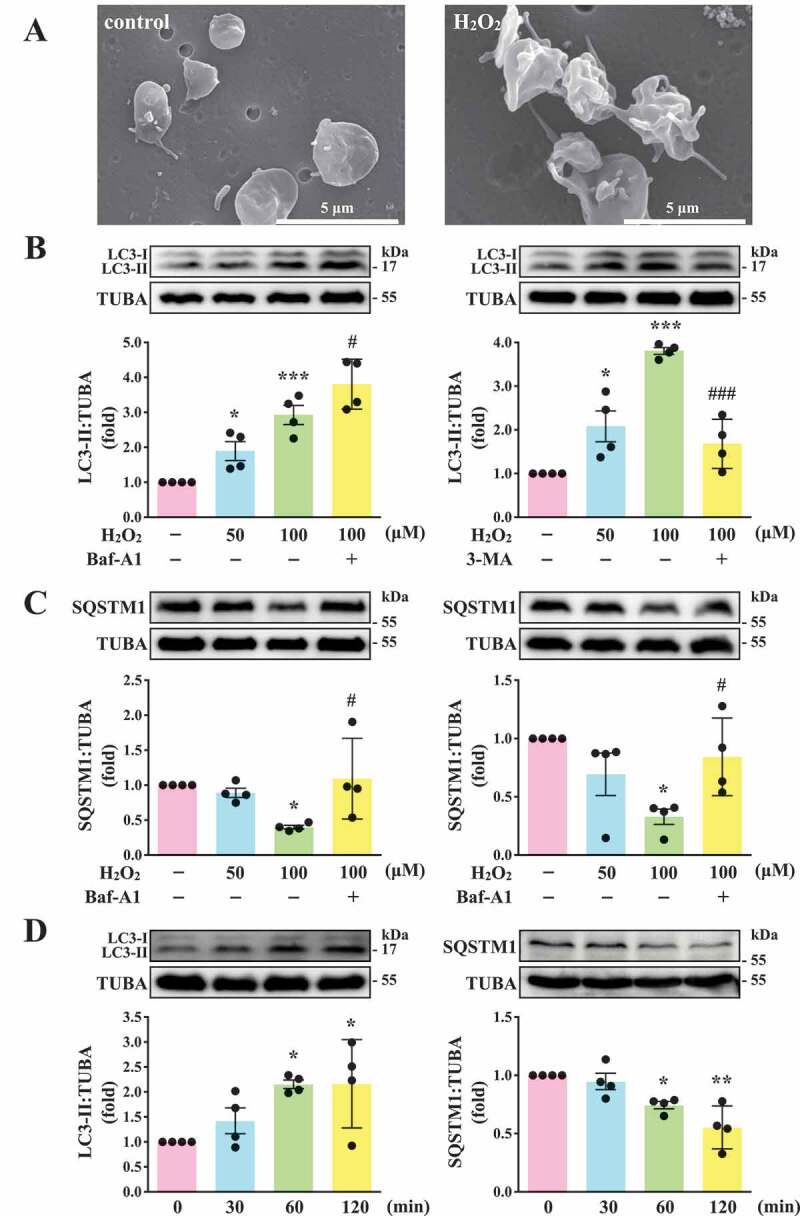
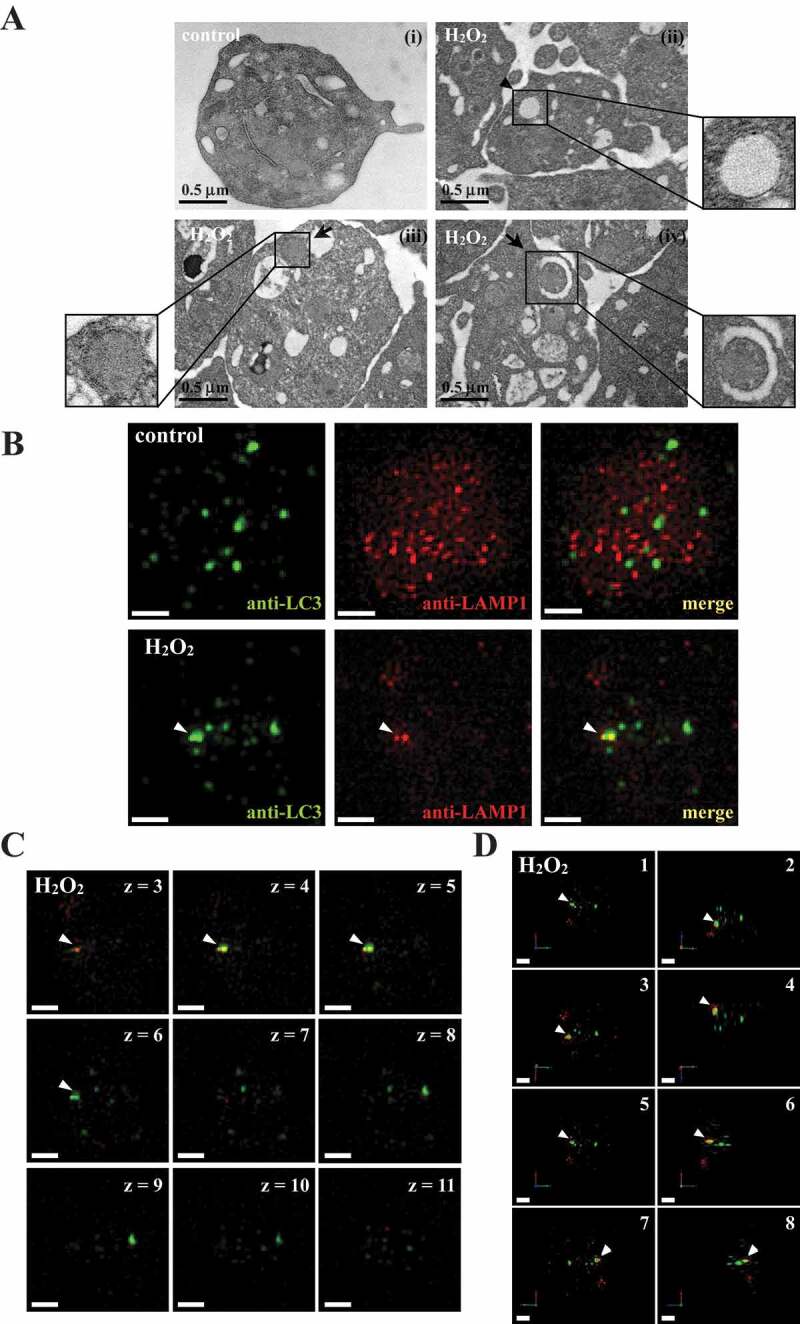
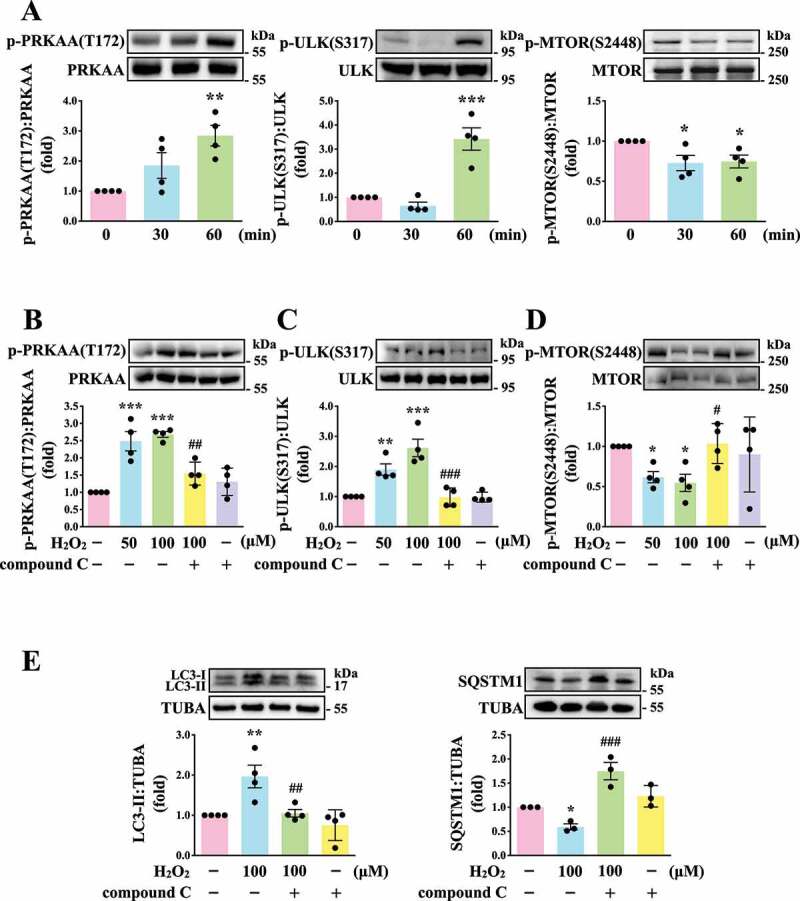
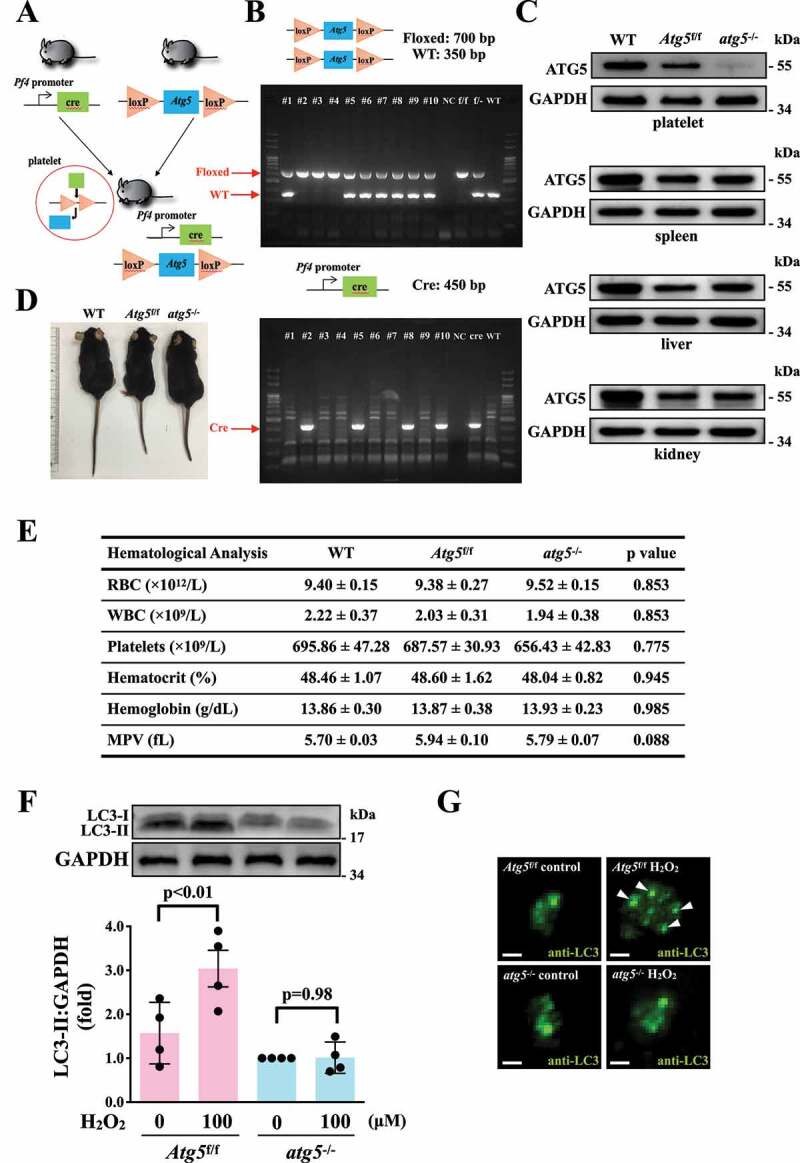
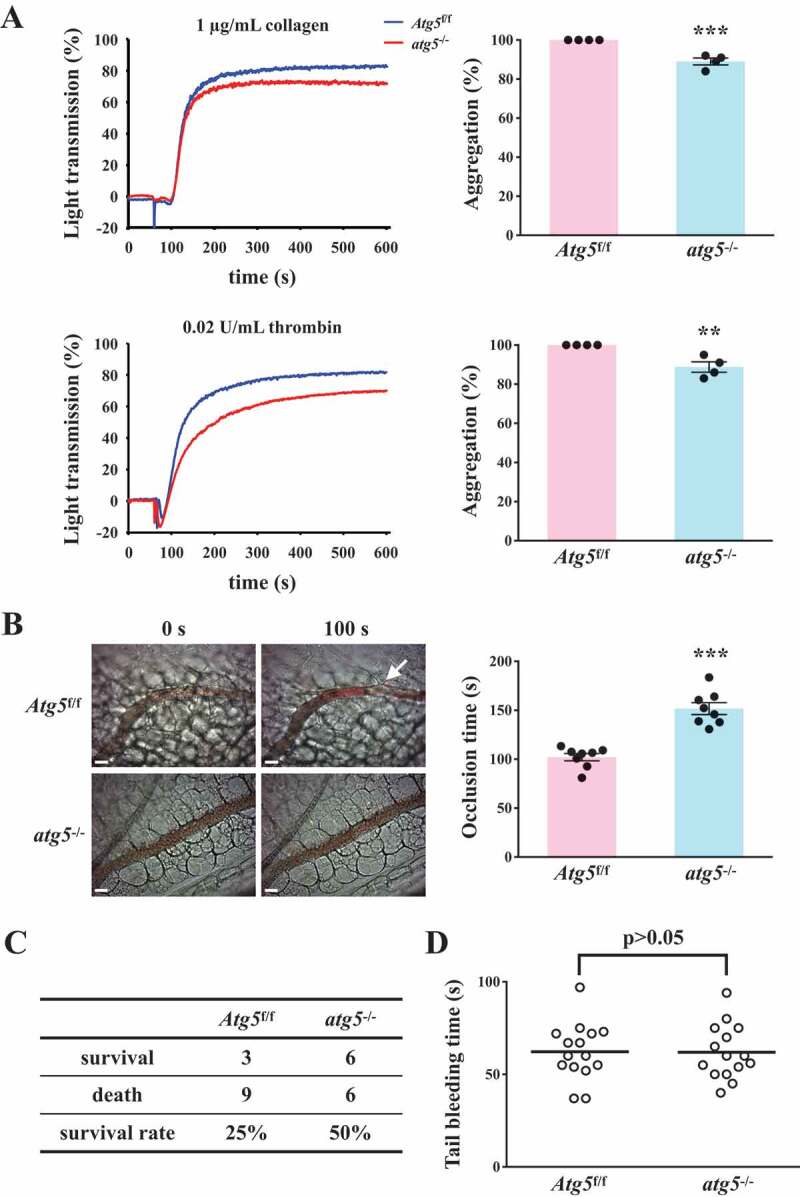
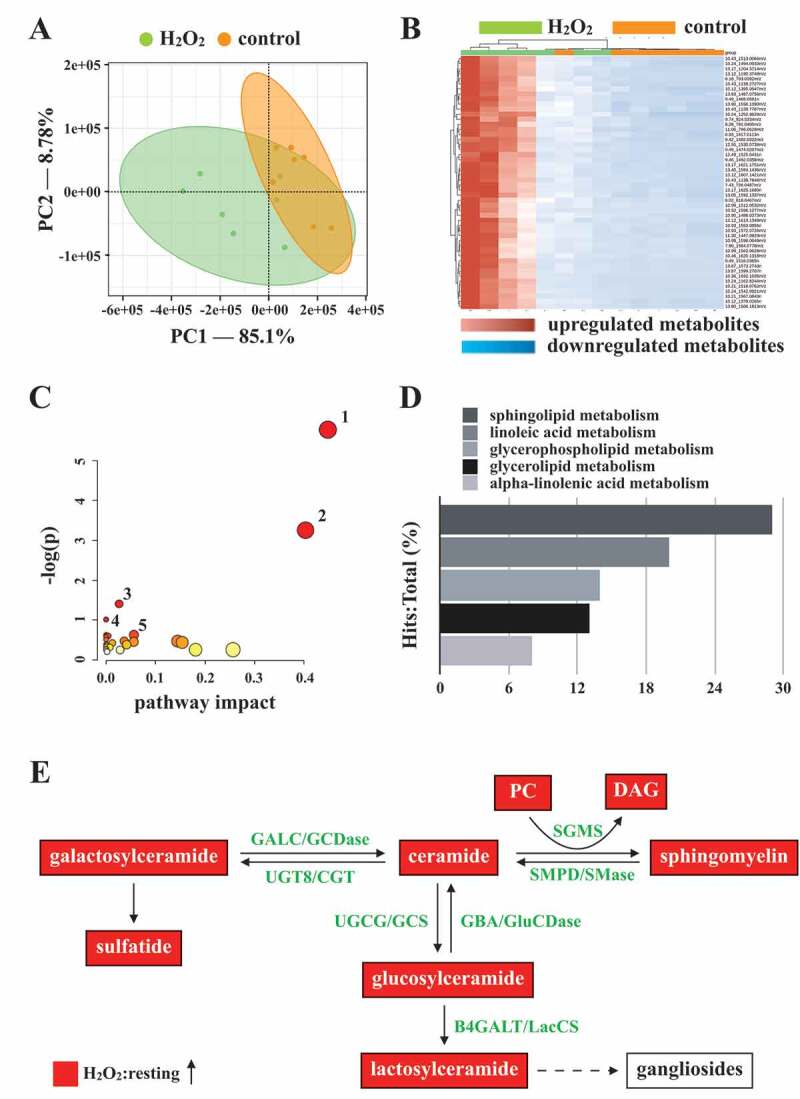
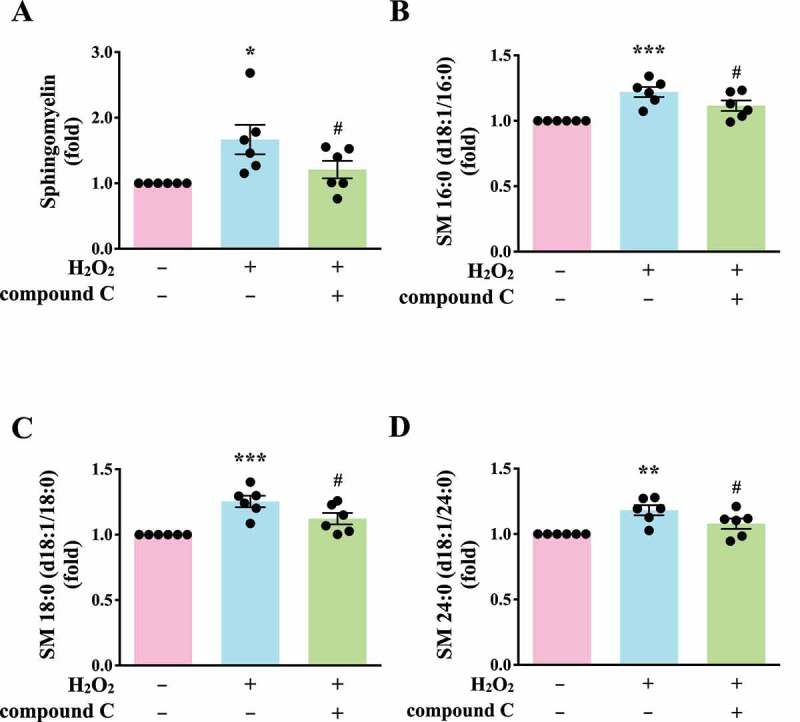
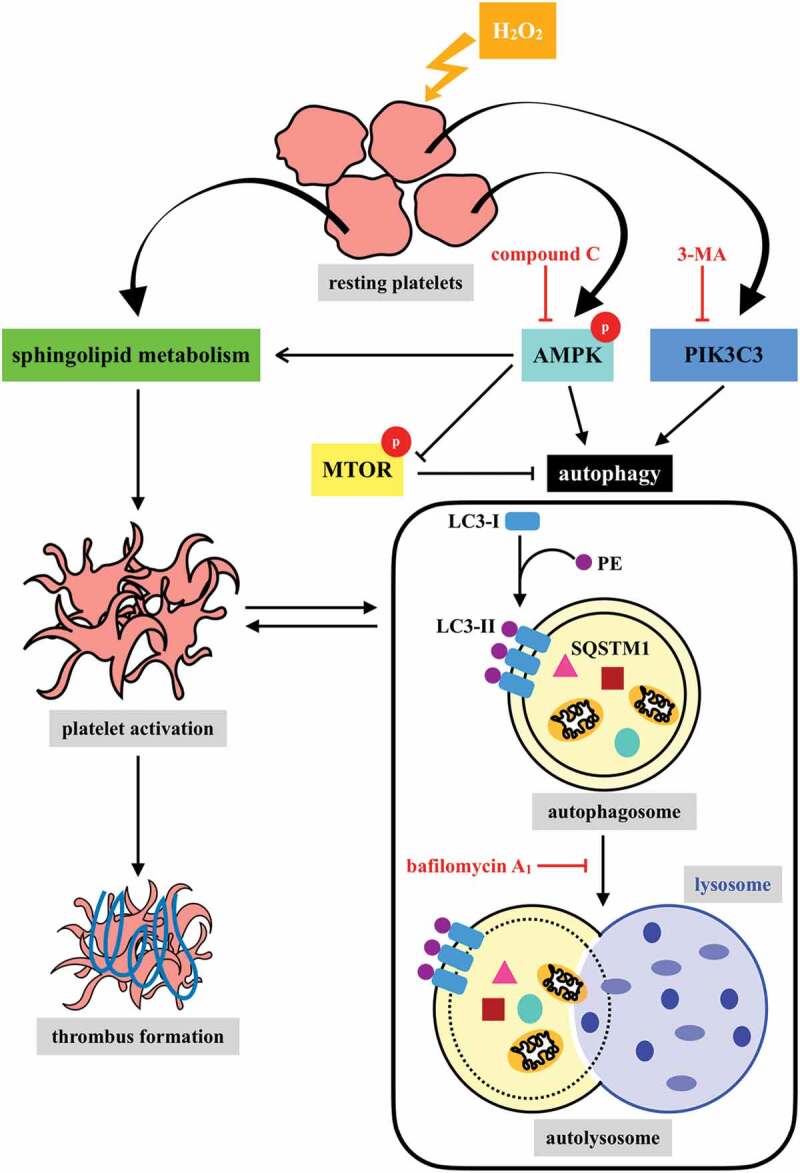
Basal macroautophagy/autophagy has recently been found in anucleate platelets. Platelet autophagy is involved in platelet activation and thrombus formation. However, the mechanism underlying autophagy in anucleate platelets require further clarification. Our data revealed that LC3-II formation and SQSTM1/p62 degradation were noted in H2O2-activated human platelets, which could be blocked by 3-methyladenine and bafilomycin A1, indicating that platelet activation may cause platelet autophagy. AMPK phosphorylation and MTOR dephosphorylation were also detected, and block of AMPK activity by the AMPK inhibitor dorsomorphin reversed SQSTM1 degradation and LC3-II formation. Moreover, autophagosome formation was observed through transmission electron microscopy and deconvolution microscopy. These findings suggest that platelet autophagy was induced partly through the AMPK-MTOR pathway. In addition, increased LC3-II expression occurred only in H2O2-treated Atg5f/f platelets, but not in H2O2-treated atg5-/- platelets, suggesting that platelet autophagy occurs during platelet activation. atg5-/- platelets also exhibited a lower aggregation in response to agonists, and platelet-specific atg5-/- mice exhibited delayed thrombus formation in mesenteric microvessles and decreased mortality rate due to pulmonary thrombosis. Notably, metabolic analysis revealed that sphingolipid metabolism is involved in platelet activation, as evidenced by observed several altered metabolites, which could be reversed by dorsomorphin. Therefore, platelet autophagy and platelet activation are positively correlated, partly through the interconnected network of sphingolipid metabolism. In conclusion, this study for the first time demonstrated that AMPK-MTOR signaling could regulate platelet autophagy. A novel linkage between AMPK-MTOR and sphingolipid metabolism in anucleate platelet autophagy was also identified: platelet autophagy and platelet activation are positively correlated.Abbreviations: 3-MA: 3-methyladenine; A.C.D.: citric acid/sod. citrate/glucose; ADP: adenosine diphosphate; AKT: AKT serine/threonine kinase; AMPK: AMP-activated protein kinase; ANOVA: analysis of variance; ATG: autophagy-related; B4GALT/LacCS: beta-1,4-galactosyltransferase; Baf-A1: bafilomycin A1; BECN1: beclin 1; BHT: butylate hydrooxytoluene; BSA: bovine serum albumin; DAG: diacylglycerol; ECL: enhanced chemiluminescence; EDTA: ethylenediamine tetraacetic acid; ELISA: enzyme-linked immunosorbent assay; GALC/GCDase: galactosylceramidase; GAPDH: glyceraldehyde-3-phosphate dehydrogenase; GBA/GluSDase: glucosylceramidase beta; GPI: glycosylphosphatidylinositol; H2O2: hydrogen peroxide; HMDB: human metabolome database; HRP: horseradish peroxidase; IF: immunofluorescence; IgG: immunoglobulin G; KEGG: Kyoto Encyclopedia of Genes and Genomes; LAMP1: lysosomal associated membrane protein 1; LC-MS/MS: liquid chromatography-tandem mass spectrometry; mAb: monoclonal antibody; MAP1LC3/LC3: microtubule associated protein 1 light chain 3; MPV: mean platelet volume; MTOR: mechanistic target of rapamycin kinase; ox-LDL: oxidized low-density lipoprotein; pAb: polyclonal antibody; PC: phosphatidylcholine; PCR: polymerase chain reaction; PI3K: phosphoinositide 3-kinase; PLS-DA: partial least-squares discriminant analysis; PRP: platelet-rich plasma; Q-TOF: quadrupole-time of flight; RBC: red blood cell; ROS: reactive oxygen species; RPS6KB/p70S6K: ribosomal protein S6 kinase B; SDS: sodium dodecyl sulfate; S.E.M.: standard error of the mean; SEM: scanning electron microscopy; SGMS: sphingomyelin synthase; SM: sphingomyelin; SMPD/SMase: sphingomyelin phosphodiesterase; SQSTM1/p62: sequestosome 1; TEM: transmission electron microscopy; UGT8/CGT: UDP glycosyltransferase 8; UGCG/GCS: UDP-glucose ceramide glucosyltransferase; ULK1: unc-51 like autophagy activating kinase 1; UPLC: ultra-performance liquid chromatography; PIK3C3/VPS34: phosphatidylinositol 3-kinase catalytic subunit type 3; PtdIns3P: phosphatidylinositol-3-phosphate; WBC: white blood cell; WT: wild type.

Keywords: AMPK; autophagy; hydrogen peroxide; platelets; sphingolipid metabolism.


Conflict of interest statement

No potential conflict of interest was reported by the authors.

Figures

Figure 1.
Figure 1.
LC3-II and SQSTM1/p62 expression and autophagic flux in H2O2-activated human platelets. (A) Representative scanning electron microscopy (SEM) images of platelets treated with or without 100 μM H2O2 for 60 min. Scale bars: 5 μm. (B and C) Washed platelets (1.2 × 109/mL) treated with 50 and 100 μM H2O2 for 60 min in the presence or absence of Baf-A1 (200 nM) or 3-MA (3 mM). (D) Washed platelets treated with 100 μM H2O2 for the indicated time (0–120 min). LC3 and SQSTM1/p62 detected using specific antibodies through western blotting. Data (B-D) are presented as the means ± S.E.M. (n = 4). *P < 0.05, **P < 0.01, and ***P < 0.001, compared with the control group. #P < 0.05 and ###P < 0.001 with the H2O2-treated group
Figure 2.
Figure 2.
Autophagosome formation in H2O2-activated human platelets. (A) Representative transmission electron microscopic images of platelets treated (ii–iv) with or (I) without 100 μM H2O2 for 60 min. The arrowhead indicates the double-membrane autophagosome (ii) and the arrows indicate the early (iii) and late (iv) autophagosome enveloping mitochondria. Scale bar: 0.5 μm. (B) Washed platelets treated with or without 100 μM H2O2 for 60 min and then fixed. The LC3 and lysosomes were stained with anti-LC3 and anti-LAMP1 antibodies, respectively. These images were observed under a deconvolution microscope and were also captured from 2D (x-y axis). Three-dimensional (3D) autophagosome–lysosome fusion (i.e., autolysosome) was also provided in video form in Video S1. The green and red colors indicate LC3 and lysosomes, respectively. The white arrowhead indicates colocalization of LC3 and lysosome. Scale bar: 0.7 µm. (C) Different z-sections (z-axis) of the merged image of H2O2-treated platelets in (B). Scale bar: 0.7 µm. (D) Different angles (rotation) of the merged image of H2O2-treated platelets in (B). Scale bar: 0.7 µm. The profiles (A-D) are representative examples of 4 similar experiments
Figure 3.
Figure 3.
Regulatory effects of the AMPK-MTOR pathway on platelet autophagy. (A) Washed platelets treated with 100 μM H2O2 for the indicated time (0–60 min). (B-D) Washed platelets treated with 50 and 100 μM H2O2 for 60 min in the presence or absence of compound C (10 μM). (E) Washed platelets treated with 100 μM H2O2 for 60 min in the presence or absence of compound C (10 μM). Specific antibodies were used to detect p-PRKAA (Thr172), p-ULK (Ser317), p-MTOR (Ser2448), LC3, and SQSTM1/p62 by western blotting. Data are presented as the means ± S.E.M. (n = 4; SQSTM1, n = 3). *P < 0.05, **P < 0.01, and ***P < 0.001, compared with the control platelets. #P < 0.05, ##P < 0.01, and ###P < 0.001 with the H2O2-treated group
Figure 4.
Figure 4.
Effects of atg5 deficiency on LC3 expression and autophagy flux H2O2-activated atg5−/− platelets of mice. (A) Schematic for platelet-specific atg5−/− mice generation by using Cre-loxP recombination system. (B and C) Identification of platelet-specific atg5−/− mice by PCR (B) and western blotting (C). (D) Phenotype of the representative 8-week-old mice of WT, Atg5f/f, and platelet-specific atg5−/− mice. (E) Hematological parameters of WT, Atg5f/f, and platelet-specific atg5−/− mice analyzed using IDEXX Procyte Dx. Values are expressed as the means ± S.E.M. (n = 7). (F) Washed mouse Atg5f/f and atg5−/− platelets (1 × 109/mL each) treated with or without 100 μM H2O2 for 60 min, and LC3 was then detected by western blotting. (G) Endogenous LC3 after 100 μM H2O2 treatment detected through immunofluorescence (IF) under a deconvolution microscope. The arrows indicate LC3 puncta. Scale bar: 1 μm. The profiles (C and G) are representative examples of 4 similar experiments. Data (F) are presented as the means ± S.E.M. (n = 4)
Figure 5.
Figure 5.
Effects of platelet autophagy in platelet activation and thrombosis in platelet-specific atg5−/− mice. (A) Washed platelets from Atg5f/f or platelet-specific atg5−/− mice stimulated with 1 μg/mL collagen (top panel) or 0.02 U/mL α thrombin (bottom panel) to trigger platelet aggregation. Data are presented as the means ± S.E.M. (n = 4). **P < 0.01 and ***P < 0.001, compared with the Atg5f/f mice. (B) Atg5f/f or platelet-specific atg5−/− mice intravenously administered with sodium fluorescein. Mesenteric venules were subsequently irradiated to induce microthrombus formation that was continually recorded under a fluorescence microscope. The objective lens had a magnification of ×40. Scale bar: 200 µm. The arrow indicates thrombus. The occlusion time in the right panel is presented as the means ± S.E.M. (n = 8). ***P < 0.001, compared with the Atg5f/f mice. (C) Acute pulmonary thromboembolic death of mice determined after Atg5f/f and platelet-specific atg5−/− mice were injected with ADP (1.4 g/kg) through the tail vein (n = 12). (D) Bleeding induced by severing the tail of Atg5f/f and platelet-specific atg5−/− mice at 3 mm from the tail tip. The bleeding tail stump was immersed in saline. The bleeding time was continuously recorded until no sign of bleeding was observed for at least 10 s. Each point in the scatter plot graph represents a mouse (n = 15)
Figure 6.
Figure 6.
Metabolic pathway analysis in H2O2-activated human platelets. Platelets were treated with or without H2O2, and subjected to Q-TOF MS analysis (n = 7). Those metabolites with significant changes between groups (P < 0.05 and fold change > 1.5) were selected and subjected to pathway analysis. (A) PLS-DA score plot, presenting the clustering of control (orange) and H2O2-treated (green) platelets. (B) Heat map indicating top 50 potential metabolites. Red in the gradient presents the increases. Blue in gradient presented the decreases. (C) Bubble map showing the rank of pathways by P values. 1, sphingolipid metabolism; 2, glycerophospholipid metabolism; 3, glycerolipid metabolism; 4, linoleic acid metabolism; 5, primary bile acid biosynthesis. (D) Photograph depicting the top 5 metabolic pathways ranked by hit rate (hits/total metabolites). (E) Schematic of sphingolipid metabolism, in which the identified metabolites are involved, in the H2O2-treated group compared with the control group. The red solid box represents upregulation. PC: phosphatidylcholine; DAG: diacylglycerol; SGMS: sphingomyelin synthase; SMPD/SMase: sphingomyelin phosphodiesterase; UGT8/CGT: UDP glycosyltransferase 8; GALC/GCDase: galactosylceramidase; UGCG/GCS: UDP-glucose ceramide glucosyltransferase; GBA/GluSDase: glucosylceramidase beta; B4GALT/LacCS: beta-1,4-galactosyltransferase
Figure 7.
Figure 7.
Validation of the linkage of AMPK-MTOR to Sphingolipid Metabolism in H2O2-activated human platelets. (A) Washed platelets (1 × 107/mL) treated with 100 μM H2O2 for 60 min in the presence or absence of compound C (10 μM). After the reaction, sphingomyelin (SM) levels were determined by the ELISA assay. (B-D) Washed platelets (1 × 106/mL) treated with 100 μM H2O2 for 60 min in the presence or absence of compound C (10 μM). After the reaction, the level of three sphingomyelins (B) SM 16:0 (d18:1/16:0); (C) SM 18:0 (d18:1/18:0); (D) SM 24:0 (d18:1/24:0) were quantified by the LC-MS/MS assay. Data (A-D) are presented as the means ± S.E.M. (n = 6). *P < 0.05, **P < 0.01, and ***P < 0.001, compared with the control group. #P < 0.05, compared with the H2O2-treated group
Figure 8.
Figure 8.
Hypothetical scheme of H2O2-mediated platelet autophagy. A novel linkage between AMPK-MTOR and sphingolipid metabolism in anucleate platelet autophagy was identified: platelet autophagy and platelet activation are positively correlated

References

    1. Nieswandt B, Pleines I, Bender M.. Platelet adhesion and activation mechanisms in arterial thrombosis and ischaemic stroke. J Thromb Haemost. 2011;9(Suppl 1):92–104. PMID: 21781245. - PubMed
    1. Koupenova M, Kehrel BE, Corkrey HA, et al. Thrombosis and platelets: an update. Eur Heart J. 2017;38:785–791. PMID: 28039338. - PMC - PubMed
    1. George JN. Platelets. Lancet. 2000;355:1531–1539. PMID: 10801186. - PubMed
    1. Van Der Meijden PEJ, Heemskerk JWM. Platelet biology and functions: new concepts and clinical perspectives. Nat Rev Cardiol. 2019;16:166–179. PMID: 30429532. - PubMed
    1. Grozovsky R, Hoffmeister KM, Falet H. Novel clearance mechanisms of platelets. Curr Opin Hematol. 2010;17:585–589. PMID:PMC4303238. - PMC - PubMed

Publication types