. 2021 Mar 22;9(3):e23215.
doi: 10.2196/23215.

Clinical Decision Support for Traumatic Brain Injury: Identifying a Framework for Practical Model-Based Intracranial Pressure Estimation at Multihour Timescales

Affiliations

Clinical Decision Support for Traumatic Brain Injury: Identifying a Framework for Practical Model-Based Intracranial Pressure Estimation at Multihour Timescales

J N Stroh et al. JMIR Med Inform. .

Abstract

Background: The clinical mitigation of intracranial hypertension due to traumatic brain injury requires timely knowledge of intracranial pressure to avoid secondary injury or death. Noninvasive intracranial pressure (nICP) estimation that operates sufficiently fast at multihour timescales and requires only common patient measurements is a desirable tool for clinical decision support and improving traumatic brain injury patient outcomes. However, existing model-based nICP estimation methods may be too slow or require data that are not easily obtained.

Objective: This work considers short- and real-time nICP estimation at multihour timescales based on arterial blood pressure (ABP) to better inform the ongoing development of practical models with commonly available data.

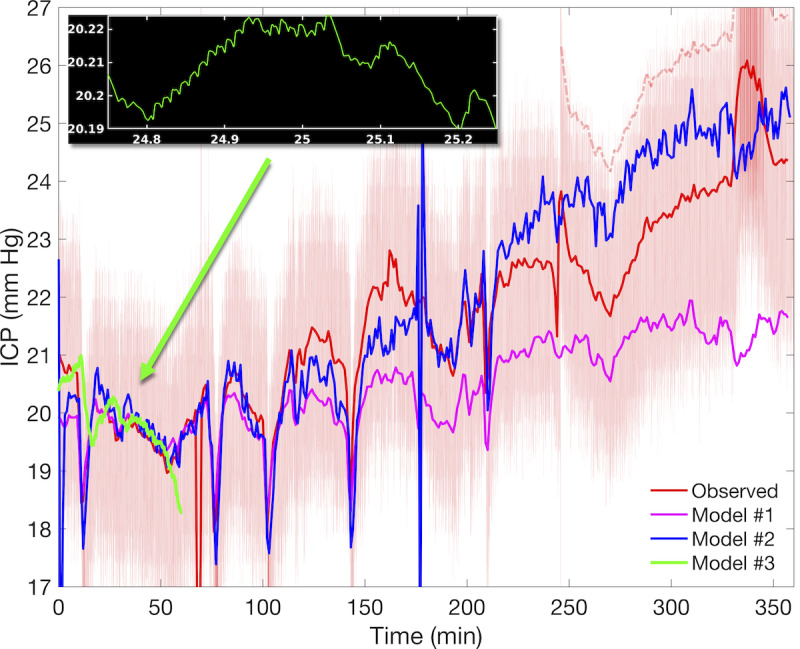
Methods: We assess and analyze the effects of two distinct pathways of model development, either by increasing physiological integration using a simple pressure estimation model, or by increasing physiological fidelity using a more complex model. Comparison of the model approaches is performed using a set of quantitative model validation criteria over hour-scale times applied to model nICP estimates in relation to observed ICP.

Results: The simple fully coupled estimation scheme based on windowed regression outperforms a more complex nICP model with prescribed intracranial inflow when pulsatile ABP inflow conditions are provided. We also show that the simple estimation data requirements can be reduced to 1-minute averaged ABP summary data under generic waveform representation.

Conclusions: Stronger performance of the simple bidirectional model indicates that feedback between the systemic vascular network and nICP estimation scheme is crucial for modeling over long intervals. However, simple model reduction to ABP-only dependence limits its utility in cases involving other brain injuries such as ischemic stroke and subarachnoid hemorrhage. Additional methodologies and considerations needed to overcome these limitations are illustrated and discussed.

Keywords: intracranial hypertension; intracranial pressure; patient-specific modeling; theoretical models; traumatic brain injury.


Conflict of interest statement

Conflicts of Interest: None declared.

Figures

Figure 1
Figure 1
Conceptual overview of the relation among 4 models. The single-compartment model forced by prescribed hemodynamic time series (model #1) is the baseline model for comparison. Model #2 bidirectionally integrates the lower arterial network with the single-component intracranial model. In contrast, model #3 uses a more complex 6-compartment intracranial model with prescribed hemodynamic forcing. Model #4 represents of a multicompartment intracranial model fully integrated with the systemic arteries.
Figure 2
Figure 2
Diagram of model configurations 1–4. Schematic view of the various model configurations where green and pink boxes identify the AN and Circle of Willis vascular components, respectively, and intracranial models at right. Purple and orange boxes in the AN identify represented anatomy for reference. The vascular component is structured as in the source studies but uses 3-element electrical representations of each vessel, shown in the dashed white box. The single-compartment intracranial model is shown in the upper tan box; below it is a conceptual illustration of the 6-compartment model where red arrows indicate variable state components related to autoregulation and adaptive capacity. Unidirectional and bidirectional green arrows indicate the type of coupling between vascular and intracranial model components to distinguish configurations #1-4. ACA: anterior cerebral artery; ICP: intracranial pressure; MCA: middle cerebral artery; PCA: posterior cerebral artery.
Figure 3
Figure 3
Ranked sensitivities of arterial network scaling parameters. Normalized empirical estimates of sensitivity ranking, shown here for key signal features (mean, variance, and maximum) of pressure (top row) and flow (bottom row) in the middle cerebral artery, summarize Monte Carlo experiments using global structured random uniform variations of scaling parameters (vertical axis of each panel). Parameter variations in vessel length (θl) and radius (θr) are most influential, whereas resistance scale (Rterm) and Windkessel scales (ωl, ωr) had relatively little impact on the solutions. The vessel dimension parameters have considerable influence on intracranial model inflow signals and provide global control while reducing the number of parameters needed to specify the hemodynamic model. MCA: middle cerebral artery.
Figure 4
Figure 4
Timescales of ABP inflow data. The complex models can run on data from any part of the sampling spectrum. Simple models require pulsatile inflow from the rightmost portion of the scale (above about 10 Hz), which may not be typically available. The central scale is desirable for hour-scale applications, as this resolution both qualitatively minimizes computational overhead and supports parameter stationarity assumed in the regressive single-compartment models. The quaque 1-min data sampling frequency is indicated in red. The left-most scale offers strong smoothing and low noise but fails to resolve pulsatile waveform and violates assumptions of the simple models. ABP: arterial blood pressure.
Figure 5
Figure 5
Observed and estimated noninvasive ICP for patient #6. Depicted are the observed (red) and estimated noninvasive ICP for Charis patient #6 using models #1-3, with model #2 showing the best accuracy. The noninvasive ICP estimated by model #1 (magenta) requires less than 5 minutes to run but has larger long-term errors. Model #2 (blue) takes approximately 45 minutes but produces a more accurate noninvasive ICP trend. Model #3 (green) estimates 1 hour of noninvasive ICP in approximately 6 hours of clock time; it requires variance inflation to obtain the curve shown. Model biases over the first hour are approximately 6.5 mm Hg, excluding spin-up errors. The black inset illustrates model #3 pulse resolution during a 30-second interval. Bidirectionality in model #2 has better low-frequency resolution and trend tracking than model #1, but makes it susceptible to feedback-driven instability under noisy inflow data (models #1 and #2 near 180 minutes). ICP: intracranial pressure.
Figure 6
Figure 6
Strong local tracking of the ICP signal in model #2 at the expense of computational time. The mean noninvasive intracranial pressure estimates over 30-second intervals (blue curve) using the output of model #2 (light blue) with raw arterial blood pressure strongly track the observed ICP (red curve). The model simulation accurately reproduces local trends and O(10−2) Hz waves of the averaged observed ICP. This simulation calculated resistance and compliance parameters at 1-second intervals using a 30-second moving window (ie, with a 29-second overlap). The corresponding mean ICP estimates are plotted as solid curves for comparison with the observed ICP, with an inset showing the lack of subminute resolution. Although 4 times slower than real time, this simulation is roughly twice as fast as model #3 under pulsatile aortic inflow and requires no additional data or external inference. ICP: intracranial pressure.
Figure 7
Figure 7
Model #2 performance using quaque 1-min (q1m) summary arterial blood pressure (ABP) data for Charis patient #6. Various simulations using q1m inflow data are compared with observed intracranial pressure (ICP; red curve) and noninvasive intracranial pressure (nICP) estimate based on raw 50 Hz data (dashed blue). Also shown are estimates using minute-wise constant continuous representatives of q1m ABP data generated by correct (blue) and incorrect (magenta and cyan) waveform parameters. The figure inset shows ABP waveform shapes for patients #6 (solid blue), #8 (cyan), and #9 (magenta), respectively, which yield qualitatively indistinguishable nICP estimates in the main plot. This shows that q1m ABP is sufficient for the aortic inflow and that patient-specific parametrization of ABP waveforms has little advantage in the simple model. ICP: intracranial pressure; Ps: systolic pressure; Pd: diastolic pressure; ts: systolic upswing duration; tc: cardiac cycle time.
Figure 8
Figure 8
The ICP record for Charis patient #5 during hours 30–34 is shown in light red with its minute-to-minute mean traced in dark red. The observed signal includes stronger signal noise and high-frequency variability than that of patient #6. Slow wave pressure dynamics are observed, but they are absent from the model #2 solution (blue curve), which fails to track the rise and peak of the 7 mm Hg intracranial hypertensive event observed over 100–180 min. The solution using external inflow control specified at 10-minute intervals (cyan curve, using 24 independent parameters) features greatly improved trend tracking during these more dynamic regimes than the solution using parameters specified at 30-minute intervals (magenta curve, using 8 independent parameters). ICP: intracranial pressure.

Similar articles

Cited by

References

    1. Balestreri M, Czosnyka M, Hutchinson P, Steiner LA, Hiler M, Smielewski P, Pickard JD. Impact of intracranial pressure and cerebral perfusion pressure on severe disability and mortality after head injury. Neurocritical Care. 2006;4(1):8–13. doi: 10.1385/ncc:4:1:008. - DOI - PubMed
    1. Adams CA, Stein DM, Morrison JJ, Scalea TM. Does intracranial pressure management hurt more than it helps in traumatic brain injury? Trauma Surg Acute Care Open. 2018 Jan 12;3(1):e000142. doi: 10.1136/tsaco-2017-000142. doi: 10.1136/tsaco-2017-000142. - DOI - DOI - PMC - PubMed
    1. Lassen NA. Cerebral blood flow and oxygen consumption in man. Physiol Rev. 1959 Apr 01;39(2):183–238. doi: 10.1152/physrev.1959.39.2.183. https://journals.physiology.org/doi/10.1152/physrev.1959.39.2.183?url_ve... - DOI - DOI - PubMed
    1. Baumbach GL, Heistad DD. Regional, segmental, and temporal heterogeneity of cerebral vascular autoregulation. Ann Biomed Eng. 1985 May;13(3-4):303–10. doi: 10.1007/bf02584248. - DOI - PubMed
    1. Armstead WM. Cerebral blood flow autoregulation and dysautoregulation. Anesthesiol Clin. 2016 Sep;34(3):465–77. doi: 10.1016/j.anclin.2016.04.002. http://europepmc.org/abstract/MED/27521192 - DOI - PMC - PubMed

LinkOut - more resources