. 2021 Mar 22;6(6):e144350.
doi: 10.1172/jci.insight.144350.

Genomic diversity of SARS-CoV-2 during early introduction into the Baltimore-Washington metropolitan area

Affiliations

Genomic diversity of SARS-CoV-2 during early introduction into the Baltimore-Washington metropolitan area

Peter M Thielen et al. JCI Insight. .

Abstract

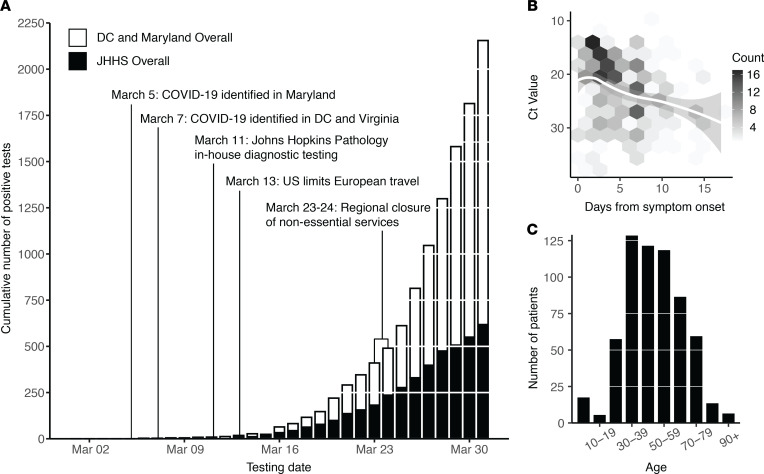
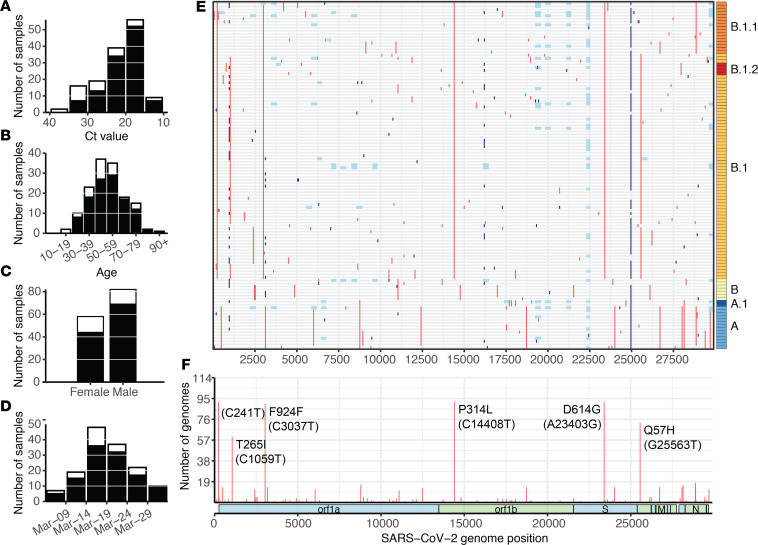
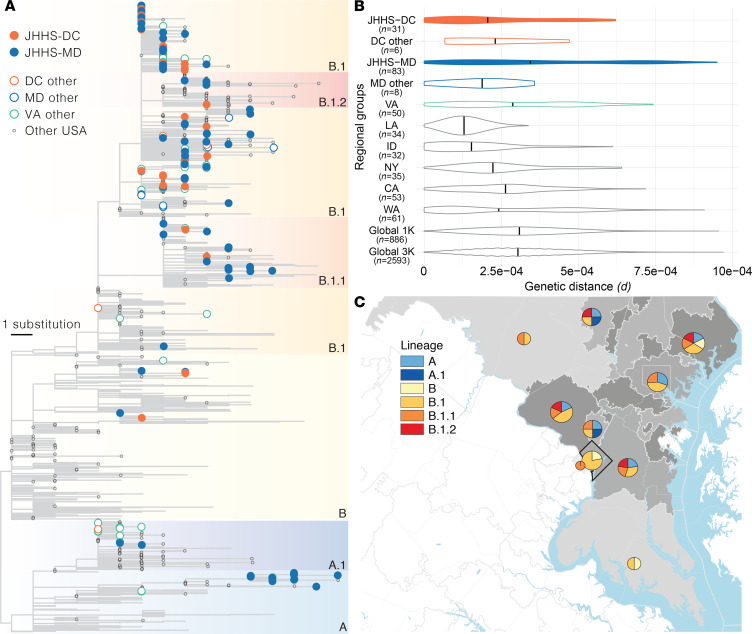
The early COVID-19 pandemic was characterized by rapid global spread. In Maryland and Washington, DC, United States, more than 2500 cases were reported within 3 weeks of the first COVID-19 detection in March 2020. We aimed to use genomic sequencing to understand the initial spread of SARS-CoV-2 - the virus that causes COVID-19 - in the region. We analyzed 620 samples collected from the Johns Hopkins Health System during March 11-31, 2020, comprising 28.6% of the total cases in Maryland and Washington, DC. From these samples, we generated 114 complete viral genomes. Analysis of these genomes alongside a subsampling of over 1000 previously published sequences showed that the diversity in this region rivaled global SARS-CoV-2 genetic diversity at that time and that the sequences belong to all of the major globally circulating lineages, suggesting multiple introductions into the region. We also analyzed these regional SARS-CoV-2 genomes alongside detailed clinical metadata and found that clinically severe cases had viral genomes belonging to all major viral lineages. We conclude that efforts to control local spread of the virus were likely confounded by the number of introductions into the region early in the epidemic and the interconnectedness of the region as a whole.

Keywords: COVID-19; Genetic variation.


Conflict of interest statement

Conflict of interest: WT has 2 patents (8,748,091 and 8,394,584) licensed to Oxford Nanopore Technologies.

Figures

Figure 1
Figure 1. COVID-19 diagnostic response during initial SARS-CoV-2 surveillance in the JHHS.
(A) Cumulative number of positive tests in Washington, DC, and the state of Maryland (white bars) and within the JHHS (black bars). (B) SARS-CoV-2 RT-PCR CT value (S-gene) versus days from patient symptom onset. Data fit with LOESS curve (white regression line). Two outliers (days from onset = 5 weeks, CT value = 30 and days from onset = 28 days, CT value = 31) are not shown. (C) Age distribution of SARS-CoV-2 patients within the JHHS. JHHS, Johns Hopkins Health System; CT, threshold cycle.
Figure 2
Figure 2. SARS-CoV-2 samples selected for whole genome sequencing.
(AD) Distribution of CT value (A), age (B), sex (C), and collection date (D) for specimens selected for whole genome sequencing (white bars), and specimens that produced complete genomes (black bars). Only specimens with known values are included in each plot. (E) Mutations across the SARS-CoV-2 genome in all 114 complete genomes (rows), binned into 60-nucleotide windows. Red, single nucleotide variant; light blue, base masked as N due to amplicon dropout; and dark blue, ambiguous base (N) due to variant-calling issues in homopolymer regions. Rows are clustered by Hamming distance between sequences and colored by Pango lineage (see Figure 3). (F) Count of complete genomes (out of 114) with a variant at each site. Key lineage-defining mutations are labeled. CT, threshold cycle.
Figure 3
Figure 3. JHHS sequences and patient outcome.
(A) Maximum likelihood tree of subsampled SARS-CoV-2 global data set and all 114 sequences generated in this study. Ambulatory (blue) includes all patients with no known admission to the hospital. Hospital admission (light red) includes admitted patients with no known admission to the ICU, including patients administered oxygen. (B) Clinical metadata and virus lineage. Each column represents 1 of the 114 patients with virus sequenced in this study, and columns are grouped by disposition within each lineage. Unless otherwise specified: black, yes; white, no; gray, unknown. Disposition: black, still in hospital or deceased as of May 15, 2020; dark gray, discharged; and white, never admitted. Race: black, Black; white, White; gray, other. “Other” includes < 10 each of American Indian/Alaska Native, Hispanic ethnicity (not otherwise specified as Black or White), other race not specified, or unknown. Sex: black, female; white, male. Enrollment criteria (top down): Fever, cough, and shortness of breath. Symptoms (top down): body ache, GI. Comorbidities (top down): cardiac disease, lung disease, diabetes, obese, alcohol, history of smoking (current and former smokers), and immunocompromised. Outcome (top down): hospital admission, supplementary oxygen, ICU admission, and ventilator administration. JHHS, Johns Hopkins Health System.
Figure 4
Figure 4. Geographical context of sequences from the Baltimore–Washington metropolitan area.
(A) Maximum likelihood tree. Filled tips belong to sequences generated in this study. Major phylogenetic lineages (defined as lineages from the Pango nomenclature system (14) found in greater than 5% of samples in our subsampled global data set) are indicated by color blocks and labeled. (B) Evolutionary divergence in geographic groups. Violin plots represent the distribution of pairwise genetic distances between all sequences for samples collected in each listed geographic group. Colors are as in A, with filled violins containing sequences from this study. Black vertical lines depict the mean pairwise genetic distance between all samples in each regional group. (C) Map of the Baltimore–Washington metropolitan area. The number of sequences in this study with home locations in each area as defined by the first 3 digits of the patient zip code (ZIP3 area; Washington, DC outlined in black, all others gray) is indicated by shading of that region (darker, more sequences) and pie chart area. Pie charts show the proportion of sequences from each ZIP3 area belonging to each major lineage. Sequence counts between 1 and 5 are shown as 5 sequences. MD, Maryland; VA, Virginia; DC, District of Columbia; WA, Washington; CA, California; ID, Idaho; LA, Louisiana; NY, New York.

Update of

Similar articles

Cited by

References

    1. World Health Organization. Coronavirus disease 2019 (COVID-19) Situation Report – 51. https://www.who.int/docs/default-source/coronaviruse/situation-reports/2... Accessed February 12, 2021.
    1. Dong E, et al. An interactive web-based dashboard to track COVID-19 in real time. Lancet Infect Dis. 2020;20(5):533–534. doi: 10.1016/S1473-3099(20)30120-1. - DOI - PMC - PubMed
    1. et al. Genomic epidemiology of SARS-CoV-2 in Guangdong province, China. Cell. 2020;181(5):997–1003. doi: 10.1016/j.cell.2020.04.023. - DOI - PMC - PubMed
    1. Bedford T, et al. Cryptic transmission of SARS-CoV-2 in Washington State. Science. 2020;370(6):571–575. - PMC - PubMed
    1. Gonzalez-Reiche AS, et al. Introductions and early spread of SARS-CoV-2 in the New York City area. Science. 2020;369(6501):297–301. - PMC - PubMed

Publication types

MeSH terms