. 2021 Jun 25;38(7):2767-2777.
doi: 10.1093/molbev/msab065.

Limited Predictability of Amino Acid Substitutions in Seasonal Influenza Viruses

Affiliations

Limited Predictability of Amino Acid Substitutions in Seasonal Influenza Viruses

Pierre Barrat-Charlaix et al. Mol Biol Evol. .

Abstract

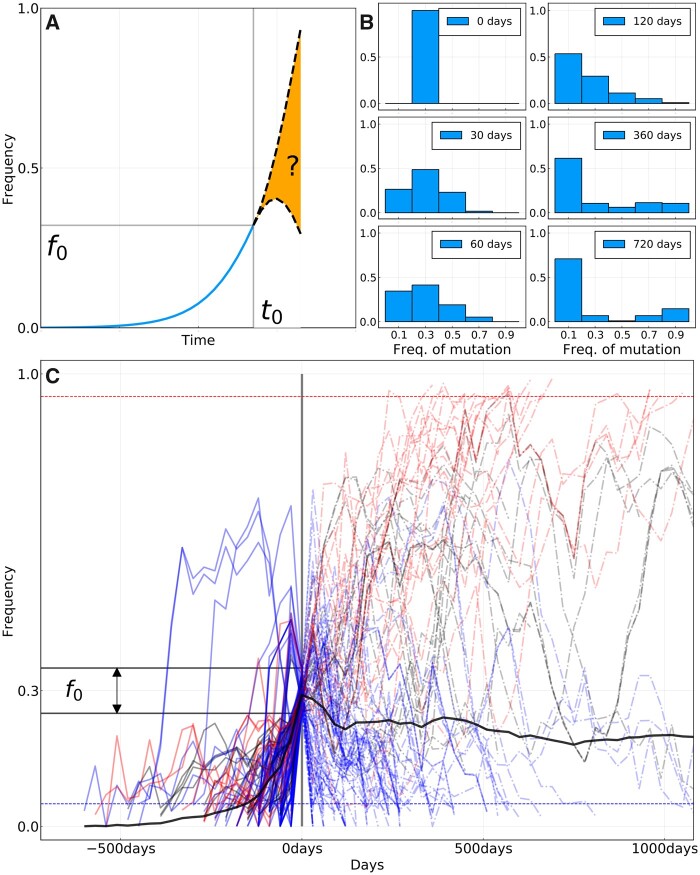
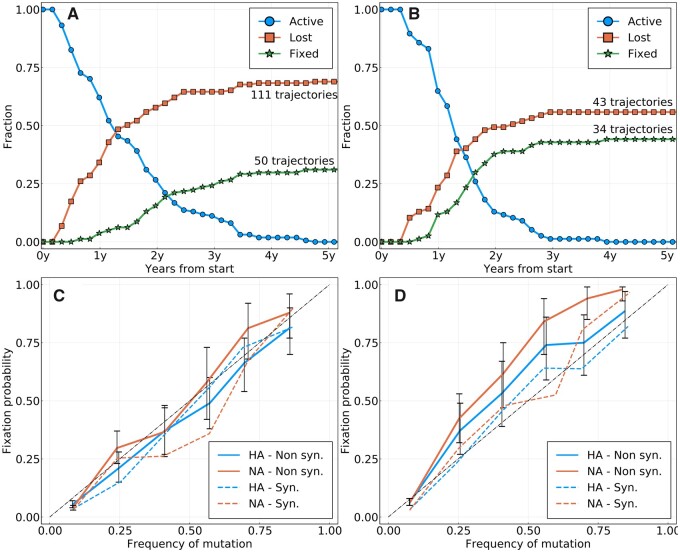
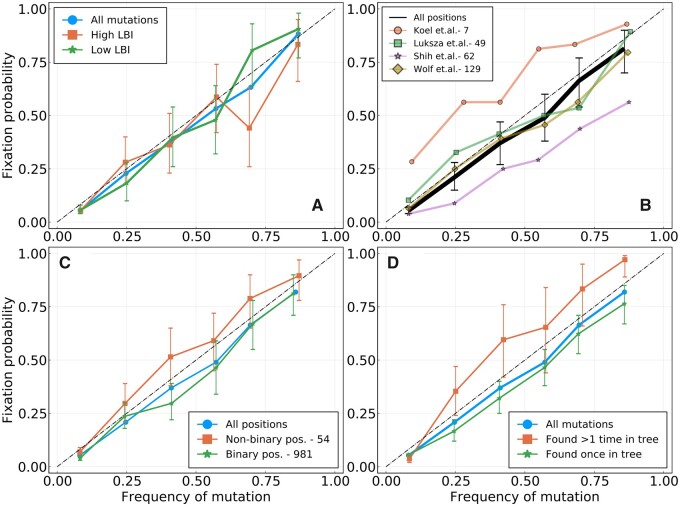
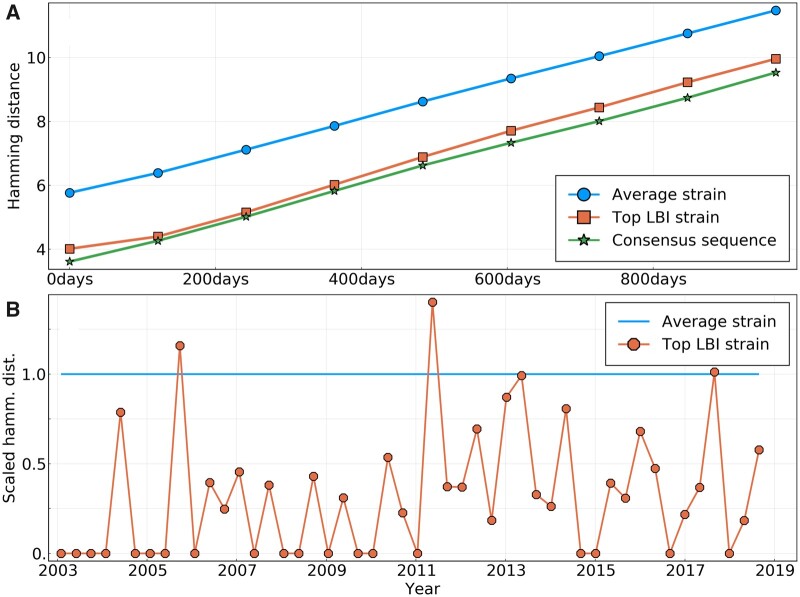
Seasonal influenza viruses repeatedly infect humans in part because they rapidly change their antigenic properties and evade host immune responses, necessitating frequent updates of the vaccine composition. Accurate predictions of strains circulating in the future could therefore improve the vaccine match. Here, we studied the predictability of frequency dynamics and fixation of amino acid substitutions. Current frequency was the strongest predictor of eventual fixation, as expected in neutral evolution. Other properties, such as occurrence in previously characterized epitopes or high Local Branching Index (LBI) had little predictive power. Parallel evolution was found to be moderately predictive of fixation. Although the LBI had little power to predict frequency dynamics, it was still successful at picking strains representative of future populations. The latter is due to a tendency of the LBI to be high for consensus-like sequences that are closer to the future than the average sequence. Simulations of models of adapting populations, in contrast, show clear signals of predictability. This indicates that the evolution of influenza HA and NA, while driven by strong selection pressure to change, is poorly described by common models of directional selection such as traveling fitness waves.

Keywords: evolution; influenza; population genetics.


Figures

<sc>Fig</sc>. 1.
Fig. 1.
(A) Sketch of the idea behind the short-term prediction of frequency trajectories. Given a mutation that we have seen increasing in frequency and that we “catch” at frequency f0 at time t0, what can we say about the distribution of future frequencies PΔt(f|f0)? (B) Distribution of future frequencies PΔt(f|f0) for the trajectories shown in (C) and for specific values of Δt. (C) All frequency trajectories of amino acid mutations in the A/H3N2 HA and NA genes that were absent in the past, are seen around f0=30% frequency at time t0=0, and are based on more than ten sequences at each time point. Red curves represent mutations that will ultimately fix, blue the ones that will be lost, and black the ones for which we do not know the final status. Dashed horizontal lines (blue and red) represent loss and fixation thresholds. The thick black line is the average of all trajectories, counting those that fix (resp. disappear) as being at frequency 1 (resp. 0). Supplementary figure S12, Supplementary Material online, shows equivalent figures for other values of f0.
<sc>Fig</sc>. 2.
Fig. 2.
(A) Activity of all rising frequency trajectories seen above 25% frequency for A/H3N2 HA and NA. (B) Same as (A) for A/H1N1pdm. (C) Probability of fixation of a mutation (amino acid or synonymous) Pfix(f) as a function of the frequency f at which it is measured, for A/H3N2 HA and NA. Only new mutations are considered, that is, mutations that were absent in the past. The diagonal dashed line is the expectation from a neutrally evolving population. Colored dashed lines represent synonymous mutations. Colored solid lines represent amino acid mutations. Error bars represent a 95% confidence interval. (D) Same as (C) for A/H1N1pdm.
<sc>Fig</sc>. 3.
Fig. 3.
Fixation probability Pfix(f) as a function of frequency, for A/H3N2 influenza. Supplementary figure S15, Supplementary Material online, shows the same analysis for A/H1N1pdm. (A) HA mutations with higher or lower LBI values, based on their position with respect to the median LBI value. (B) Different lists of epitope positions in the HA protein. The authors and the number of positions are indicated in the legend. (C) HA and NA mutations for binary positions, that is, positions for which we never see more than two amino acids in the same time bin. (D) HA and NA mutations that appear once or more than once in the tree for a given time bin.
<sc>Fig</sc>. 4.
Fig. 4.
(A) Average amino acid Hamming distance of the sequences of different predictors to HA sequences of future influenza populations, themselves averaged over all “present” populations from years 2003 to 2019. Predictors are: a randomly picked sequence in the present population; the sequence of the strain with the highest LBI in the present population; the consensus sequence of the present population. (B) Scaled Hamming distance between the sequence of the top LBI strain and the consensus sequence for populations at different dates. The scaling is such that for each date, the Hamming distance between a strain from the population and the consensus is on an average 1. The strain with the highest LBI is almost always closer to the consensus sequence than the average strain.

References

    1. Bhatt S, Holmes EC, Pybus OG.. 2011. The genomic rate of molecular adaptation of the human influenza A virus. Mol Biol Evol. 28(9):2443–2451. - PMC - PubMed
    1. Bogner P, Capua I, Lipman DJ, Cox NJ, et al.2006. A global initiative on sharing avian flu data. Nature 442(7106):981–981.
    1. Bush RM, Bender CA, Subbarao K, Cox NJ, Fitch WM.. 1999. Predicting the evolution of human influenza A. Science 286(5446):1921–1925. - PubMed
    1. Desai MM, Walczak AM, Fisher DS.. 2013. Genetic diversity and the structure of genealogies in rapidly adapting populations. Genetics 193(2):565–585. - PMC - PubMed
    1. Dunning I, Huchette J, Lubin M.. 2017. Jump: a modeling language for mathematical optimization. SIAM Rev. 59(2):295–320.

Publication types

MeSH terms

Substances

LinkOut - more resources