. 2021 Apr;35(4):e21443.
doi: 10.1096/fj.202002078R.

Dermal fibroblast phagocytosis of apoptotic cells: A novel pathway for wound resolution

Affiliations

Dermal fibroblast phagocytosis of apoptotic cells: A novel pathway for wound resolution

Bruna Romana-Souza et al. FASEB J. 2021 Apr.

Abstract

The effective clearance of apoptotic cells is an essential step in the resolution of healing wounds. In particular, blood vessel regression during wound resolution produces a significant number of apoptotic endothelial cells (ApoEC) that must be cleared. In considering the fate of ApoEC and the presence of fibroblasts during wound resolution, we hypothesized that fibroblasts might serve as phagocytes involved in endothelial cell removal. The current study investigated whether dermal fibroblasts engulf ApoEC, whether this uptake alters the phenotype of dermal fibroblasts, and the biological molecules involved. In both in vitro and in vivo studies, following ApoEC engulfment, fibroblasts acquired a pro-healing phenotype (increased cell migration, contractility, α-smooth muscle actin expression, and collagen deposition). In addition, fibroblast uptake of ApoEC was shown to be mediated in part by the milk fat globule-EGF factor 8 protein/integrin αv β5 pathway. Our study demonstrates a novel function of fibroblasts in the clearance of ApoEC and suggests that this capability has significant implications for tissue repair and fibrosis.

Keywords: apoptosis; endothelial cell; fibroblasts; milk fat globule-EGF factor 8 protein; phagocytosis; wound healing.


Conflict of interest statement

CONFLICT OF INTEREST

The authors do not declare any financial interest. No ghostwriters were involved.

Figures
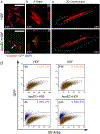
Fig. 1
Fig. 1. Dermal fibroblasts engulf apoptotic endothelial cells in vitro.
a) Representative confocal microscopy images of human dermal fibroblasts (HDF) stained with antibodies against vimentin (red) (3–6 independent experiments). Nuclei were stained with DAPI (blue). The apoptotic human dermal microvascular endothelial cells (ApoEC) expressed green fluorescent protein (GFP) (green). White arrow indicates apoptotic particles of ApoEC inside dermal fibroblast at 24 hours. Scale, 50 μm. b, c) In Z-stack (b) and 3D construction (c) confocal microscopy images, HDF show apoptotic particles of ApoEC (green) inside vimentin-positive fibroblasts at 24 hours. d) Flow cytometry analysis showing the percentage of HDF engulfing ApoEC at 8 or 24 hours. Media ± standard deviation (3–6 independent experiments).
Fig. 2
Fig. 2. Dermal fibroblast uptake of apoptotic endothelial cells increases the rate of cell migration through AKT phosphorylation in vitro.
a) Representative photos of the cell migration assay in both co-cultures of human dermal fibroblast (HDF) with apoptotic human dermal microvascular endothelial cells (ApoEC) and HDF cultured alone (3–6 independent experiments). The uncovered area is surrounded by a yellow line. Scale, 100 μm. b) The rate of cell migration expressed as a percentage of the covered area. Bars indicate mean ± standard deviation (SD) (3–6 independent experiments). *p=0.0453, t=2.453, DF=6.723; **p=0.0305, t=2.559, DF=9.099; ***p<0.0001, t=15.40, DF=5.000; two-tailed unpaired t-test (versus HDF). c) Representative immunoblots of AKT phosphorylation (3–6 independent experiments). d) Densitometry of phospho-AKT (p-AKT) normalized to total AKT (t-AKT), expressed as arbitrary units (a.u.). Bars indicate mean ± SD (3–6 independent experiments). *p=0.03, t=2.6, DF=10; n.s. = not significant (p=0.385), two-tailed unpaired t-test (versus HDF). e) Inhibition of AKT-1/2 (Akti-1/2) in the cell migration assay, expressed as the percentage of area open at 24 hours. Bars indicate mean ± SD (3–6 independent experiments). *p=0.02, **p=0.002, ****p<0.0001, F=24.90, DF=19; one-way ANOVA with Bonferroni’s test (versus HDF+DMSO or ApoEC+HDF+DMSO). DMSO - dimethyl sulfoxide.
Fig. 3
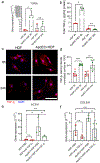
Fig. 3. Dermal fibroblast uptake of apoptotic endothelial cells increases α-SMA expression and collagen gel contraction in vitro.
a) Representative photos of the collagen gel contraction assay in both co-cultures of human dermal fibroblasts (HDF) with apoptotic human dermal microvascular endothelial cells (ApoEC) and HDF cultured alone for 24 hours (3–6 independent experiments). Scale, 1 cm. b) The rate of collagen gel contraction expressed as percentage of the original surface area. Bars indicate mean ± standard deviation (SD) (2–3 independent experiments in triplicate). n.s.= not significant (p=0.9026), ****p=<0.0001 (8h: t=8.309, DF=10; 12h: t=8.944, DF=10; 24h: t=9.918, DF=10; 48h: t=11.26, DF=10), two-tailed unpaired t-test (versus HDF). c) Gene expression levels of α-smooth muscle actin (ACTA1) normalized to GAPDH, expressed as 2-ΔΔCT. Bars indicate mean ± SD (3–6 independent experiments in duplicate). *p=0.03, t=3.001, DF=5; n.s. = not significant (p=0.2527), two-tailed unpaired t-test (versus HDF). d) Representative immunoblots of α-smooth muscle actin (α-SMA) and α-tubulin (α-Tub) (3–6 independent experiments). e) Densitometry of α-SMA protein levels normalized to α-tubulin expressed as arbitrary units (a.u.). Bars indicate mean ± SD (3–6 independent experiments). *p<0.0001, t=14.85, DF=4; n.s. = not significant (p=0.1583), two-tailed unpaired t-test (versus HDF). f) Intensity of α-SMA staining, normalized to control (HDF) as 100%. Bars indicate mean ± standard deviation (3–6 independent experiments in triplicate). **p=0.0053, t=3.797, DF=8; n.s. = not significant (p=0.1565), two-tailed unpaired t-test (versus HDF). g) Representative fluorescence microscopy images of α-SMA (red) (3–6 independent experiments). Nuclei in blue (DAPI) and ApoEC expressing green fluorescent protein (GFP). White arrow shows an α-SMA-positive HDF containing apoptotic particles of ApoEC. Scale, 50 μm.
Fig. 4
Fig. 4. Dermal fibroblast uptake of apoptotic endothelial cells increases collagen deposition in vitro.
a) Gene expression levels of collagen type III alpha 1 chain (COL3A1) normalized to GAPDH, expressed as 2-ΔΔCT in both co-cultures of human dermal fibroblasts (HDF) with apoptotic human dermal microvascular endothelial cells (ApoEC) and HDF cultured alone. Bars indicate mean ± SD (3–6 independent experiments). *p=0.0483, t=2.472, DF=6; n.s. = not significant (p=0.6063), two-tailed unpaired t-test (versus HDF). b) Representative immunoblots of collagen type III (Col III) and α-tubulin (α-Tub) (3–6 independent experiments). c) Densitometry of collagen type III protein levels normalized to α-tubulin, expressed as arbitrary units (a.u.). Bars indicate mean ± SD (3–6 independent experiments). ****p<0.0001 (8h: t=26.81, DF=4; 24h: t=29.70, DF=4), two-tailed unpaired t-test (versus HDF). d) Representative fluorescence microscopy images of collagen type III (red) (3–6 independent experiments). Nuclei in blue (DAPI) and ApoEC expressing green fluorescent protein (GFP). Scale, 50 μm. e) Content of collagen type III staining normalized to control (HDF) as 100% at 4 days. Bars indicate mean ± SD (3–6 independent experiments). *p=0.0279, t=2.570, DF=10, two-tailed unpaired t-test (versus HDF).
Fig. 5
Fig. 5. Dermal fibroblast uptake of apoptotic endothelial cells increases TGF-β1 expression in vitro.
a) Gene expression levels of transforming growth factor-β1 (TGFB1) normalized to GAPDH, expressed as 2-ΔΔCT in both co-cultures of human dermal fibroblasts (HDF) with apoptotic human dermal microvascular endothelial cells (ApoEC) and HDF cultures alone. Bars indicate mean ± standard deviation (SD) (3–6 independent experiments). *p=0.0286, t=2.172, DF=6; n.s. = not significant (p=0.6039), two-tailed unpaired t-test (versus HDF). b) Protein levels of TGF-β1 in the conditioned media from HDF incubated with ApoEC, expressed as pg per mg of total protein using an ELISA assay. Bars indicate mean ± SD (3–6 independent experiments in triplicate). *p=0.0002, t=13.13, DF=4; n.s. = not significant (p=0.2177), two-tailed unpaired t-test (versus HDF). c) Representative fluorescence microscopy images of TGF-β1 (red) (3–6 independent experiments). Nuclei in blue (DAPI). Scale, 50 μm. d) Intensity of TGF-β1 staining normalized to control (HDF) as 100%. Bars indicate mean ± SD (3–6 independent experiments in triplicate). ****p<0.0001, t=8.611, DF=10; **p=0.0028, t=3.940, DF=10, two-tailed unpaired t-test (versus HDF). e, f) Gene expression levels of α-smooth muscle actin (ACTA1) (e) and collagen type III alpha 1 chain (COL3A1) (f) in HDF incubated with ApoEC and antibodies against human TGF-β1 for 8 hours. Bars indicate mean ± SD (3 independent experiments). ACTA1: n.s. = not significant (p=0.2345), HDF+PBS versus HDF+anti-TGF-β1; *p=0.0409, t=2.44, DF=4, HDF+PBS versus ApoEC+HDF+PBS or ApoEC+HDF+PBS versus ApoEC+HDF+anti-TGF-β1; **p=0.0067, t=6.078, DF=4, HDF+PBS versus ApoEC+ anti-TGF-β1. COL3A1: n.s. = not significant (p=0.1245), HDF+PBS versus HDF+anti-TGF-β1; *p=0.0235, t=3.566; DF=4, HDF+PBS versus ApoEC+HDF+PBS; n.s. = not significant (p=0.7757), HDF+PBS versus ApoEC+HDF+anti-TGF-β1; *p=0.0119, t=2.976, DF=4 ApoEC+HDF+PBS versus ApoEC+HDF+anti-TGF-β1. One-way ANOVA, two-tailed unpaired t-test. PBS - phosphate buffered saline.
Fig. 6
Fig. 6. Dermal fibroblasts engulf apoptotic endothelial cells in vivo.
a, b) Representative fluorescence microscopy images of α-smooth muscle actin (α-SMA) (red) in the subcutaneous tissue of mice treated with phosphate buffered saline (PBS) or apoptotic mouse primary dermal microvascular endothelial cells (ApoEC) for 24 hours. Nuclei in blue (DAPI). ApoEC stained with pHrodo™ Green STP ester (green). Scale, 30 μm. ST- subcutaneous tissue. a’, b’ Inserts: Subcutaneous tissue of ApoEC-treated mice shows α-SMA-positive cells (red) containing apoptotic particles of ApoEC (green) (white arrows). Scale, 50 μm. c, d) In 3D construction (c) and Z-stack (d) confocal microscopy images, α-SMA-positive cells (red) contain apoptotic particles of ApoEC (green) inside the cytoplasm. e) Representative photos of mouse skin and subcutaneous tissue (ST) stained with Picrosirius red under polarized light. Scale, 50 μm. f) Total content of collagen stained with Picrosirius red in the subcutaneous tissue, normalized to control (normal skin) as 100%. Bars indicate mean ± standard deviation (SD) (n=3 animals per group). *p=0.02 versus normal skin or PBS (F=11.85, DF=6), one-way ANOVA with Bonferroni’s test. g) Percentage of greenish and reddish collagen in the subcutaneous tissue. Bars indicate mean ± SD (n=3 animals per group). *p=0.02 versus normal skin or PBS (F=6.462, DF=12), one-way ANOVA with Bonferroni’s test. h-k) Gene expression levels of α-smooth muscle actin (Acta1) (h), collagen type I (Col1a1) (i) (p<0.0008, F=14.84, DF=15), collagen type III alpha 1 chain (Col3a1) (j) (p=0.0207, F=6.130, DF=15), and transforming growth factor-β1 (Tgfb1) (k) (*p=0.007, F=7.237, DF=15). Bars indicate mean ± SD (n=3 animals per group). One-way ANOVA with Bonferroni’s test or Kruskal-Wallis test with Dunn’ test (versus normal skin or PBS).
Fig. 7
Fig. 7. MFG-E8 promotes apoptotic endothelial cell uptake and pro-healing fibroblast phenotype.
a) mRNA levels of milk fat globule-EGF factor 8 (MFGE8) identified by qRT-PCR in subpopulation of fibroblasts engulfing (eApoEC_HDF) and non-engulfing (nApoEC_HDF) apoptotic endothelial cells at 8 hours after cell sorting. Mean ± standard deviation (SD) (n=5 per group). *p=0.002, F=16.12, DF=12; n.s. = not significant (p>0.99), one-way ANOVA Bonferroni’s test (versus CT_HDF or nApoEC_HDF). b) MFGE8 gene expression in HDF incubated with ApoEC. Mean ± SD (3–6 independent experiments), *p=0.0384, t=2.642, DF=6; n.s. = not significant (p=0.7704); two-tailed unpaired t-test (versus HDF). c) Representative images of MFG-E8 (red) in HDF incubated with ApoEC (green). Nuclei in blue (DAPI). Scale, 50 μm. d, e) Western blot analysis of MFG-E8, normalized to α-tubulin, in HDF incubated with ApoEC for 8 hours. Mean ± SD (3–6 independent experiments). *p=0.0463, t=2.186, DF=6, two-tailed unpaired t-test (versus HDF). f) Representative images of MFG-E8 (red) in the subcutaneous tissue of phosphate buffered saline (PBS)-treated and ApoEC-treated mice at 24 hours. Nuclei in blue (DAPI). Scale, 50 μm. g) MFG-E8 gene expression in normal skin, PBS-treated, and ApoEC-treated mouse skin at 24 hours. Mean ± SD (n=3 animals per group). *p=0.0270, F=4.714, DF=6, one-way ANOVA Bonferroni’s test (versus normal skin). h, i) Flow cytometry analysis showing the percentage of the cell population in which phagocytosis occurs in HDF incubated with ApoEC and antibodies against MFG-E8. Mean ± SD (3–6 independent experiments). 8h: *p=0.02, t=2.791, DF=10; 24h: *p=0.0373, t=2.401, DF=10; two-tailed unpaired t-test (versus ApoEc+HDF+IgG). j, k, l) α-Smooth muscle actin (ACTA1) (j), collagen type III alpha 1 chain (COL3A1) (k), and transforming growth factor-β1 (TGF-β1) (l) gene expression levels in HDF incubated with ApoEC and antibodies against MFG-E8 for 8 hours. Mean ± SD (3–6 independent experiments). ACTA1: *p=0.041 HDF+IgG versus ApoEC+HDF+IgG; *p=0.0312 ApoEC+HDF+IgG versus ApoEC+HDF+anti-MFG-E8 (F=4.131, DF=20). COL3A1: *p=0.0443 HDF+IgG versus ApoEC+HDF+IgG; *p=0.0244 ApoEC+HDF+IgG versus ApoEC+HDF+anti-MFG-E8 (F=4.253, DF=20). TGFB1: ****p<0.0001 versus HDF+IgG or ApoEC+HDF+IgG (F=38.52, DF=18). n.s. = not significant (p>0.99), one-way ANOVA Bonferroni’s test.
Fig. 8
Fig. 8. Proposed model of MFG-E8-mediated uptake of apoptotic endothelial cells by dermal fibroblasts and their differentiation into a pro-healing phenotype.
The interaction between apoptotic endothelial cells (ApoEC) and dermal fibroblasts stimulates the expression of milk fat globule-EGF factor 8 protein (MFG-E8). The MFG-E8 triggers a bridge binding phosphatidylserine (PS) on the ApoEC surface to the integrin αvβ5 on the dermal fibroblast surface, which leads to engulfment of the ApoEC by the dermal fibroblast. In addition, this interaction leads to AKT phosphorylation, which promotes an increase in the rate of fibroblast migration and stimulates an increase in α-smooth muscle actin (α-SMA) and collagen type III expression through the production of transforming growth factor-β1 (TGF-β1).

References

    1. Zeng R, Lin C, Lin Z, Chen H, Lu W, Lin C, and Li H Approaches to cutaneous wound healing: basics and future directions. Cell Tissue Res. 2018;374:217–232. - PubMed
    1. Zomer HD, and Trentin AG Skin wound healing in humans and mice: Challenges in translational research. J Dermatol Sci. 2018;90:3–12. - PubMed
    1. DiPietro LA Angiogenesis and wound repair: when enough is enough. J. Leukoc. Biol. 2016;100:979–984. - PMC - PubMed
    1. Watson EC, Grant ZL, and Coultas L Endothelial cell apoptosis in angiogenesis and vessel regression. Cell. Mol. Life Sci. 2017;74:4387–4403. - PMC - PubMed
    1. Dimmeler S, and Zeiher AM Endothelial cell apoptosis in angiogenesis and vessel regression. Circ. Res. 2000;87:434–439. - PubMed

Publication types

LinkOut - more resources