

Integrated intra- and intercellular signaling knowledge for multicellular omics analysis
- PMID: 33749993
- PMCID: PMC7983032
- DOI: 10.15252/msb.20209923
Integrated intra- and intercellular signaling knowledge for multicellular omics analysis
Abstract
Molecular knowledge of biological processes is a cornerstone in omics data analysis. Applied to single-cell data, such analyses provide mechanistic insights into individual cells and their interactions. However, knowledge of intercellular communication is scarce, scattered across resources, and not linked to intracellular processes. To address this gap, we combined over 100 resources covering interactions and roles of proteins in inter- and intracellular signaling, as well as transcriptional and post-transcriptional regulation. We added protein complex information and annotations on function, localization, and role in diseases for each protein. The resource is available for human, and via homology translation for mouse and rat. The data are accessible via OmniPath's web service (https://omnipathdb.org/), a Cytoscape plug-in, and packages in R/Bioconductor and Python, providing access options for computational and experimental scientists. We created workflows with tutorials to facilitate the analysis of cell-cell interactions and affected downstream intracellular signaling processes. OmniPath provides a single access point to knowledge spanning intra- and intercellular processes for data analysis, as we demonstrate in applications studying SARS-CoV-2 infection and ulcerative colitis.
Keywords: intercellular signaling; ligand-receptor interactions; omics integration; pathways; signaling network.
© 2021 The Authors. Published under the terms of the CC BY 4.0 license.
Conflict of interest statement
JSR receives funding from GSK and Sanofi and consultant fees from Travere Therapeutics.
Figures
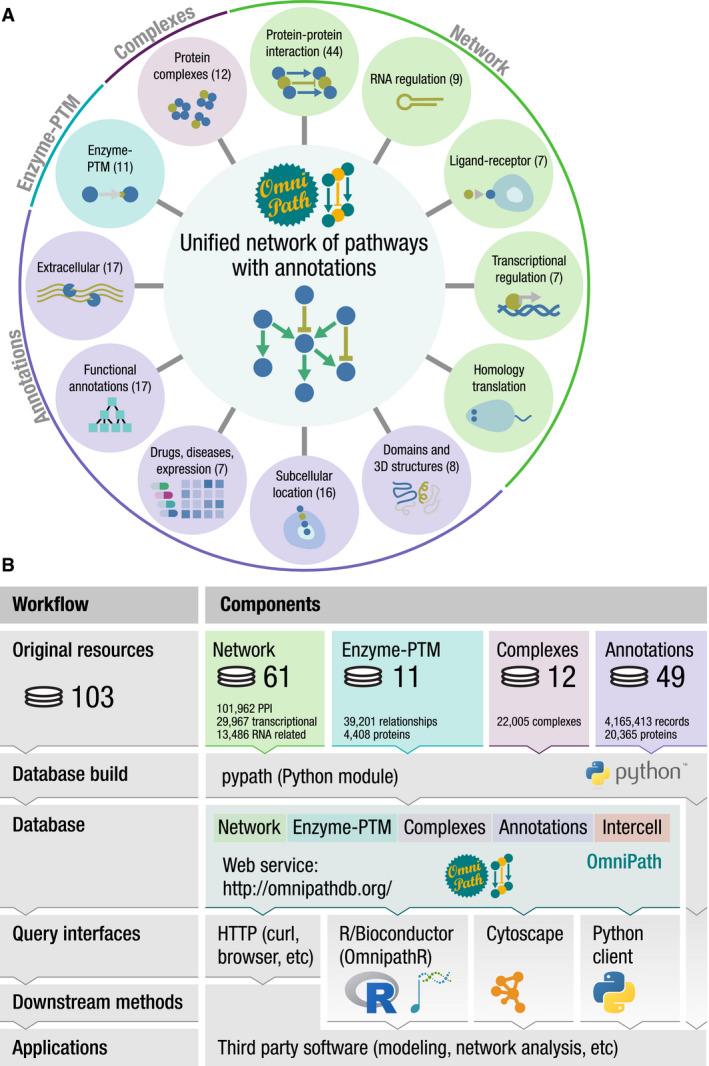
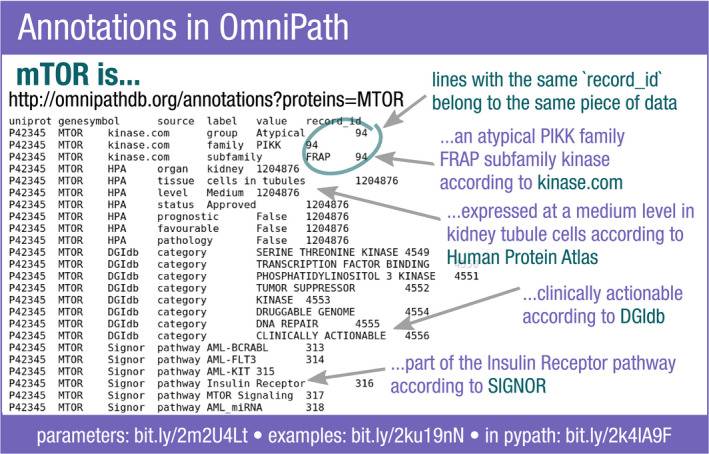
Database contents with the respective number of resources in parentheses.
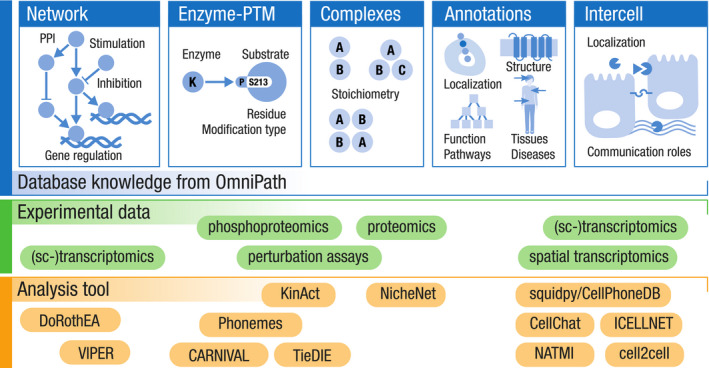
Workflow and design: OmniPath is based on four major types of resources, and the pypath Python package combines the resources to build five databases. The databases are available by the database builder software pypath, the web resource at
https://omnipathdb.org/ , the R package OmnipathR, the Python client omnipath, the Cytoscape plug‐in and can be exported to formats such as Biological Expression Language (BEL).
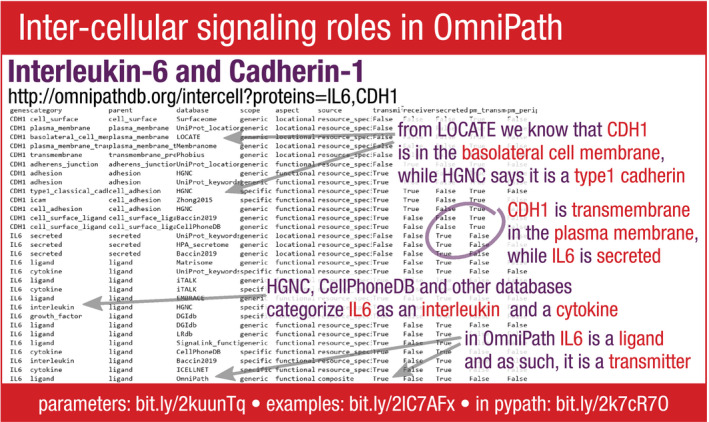
 —transmitter;
  —receiver.
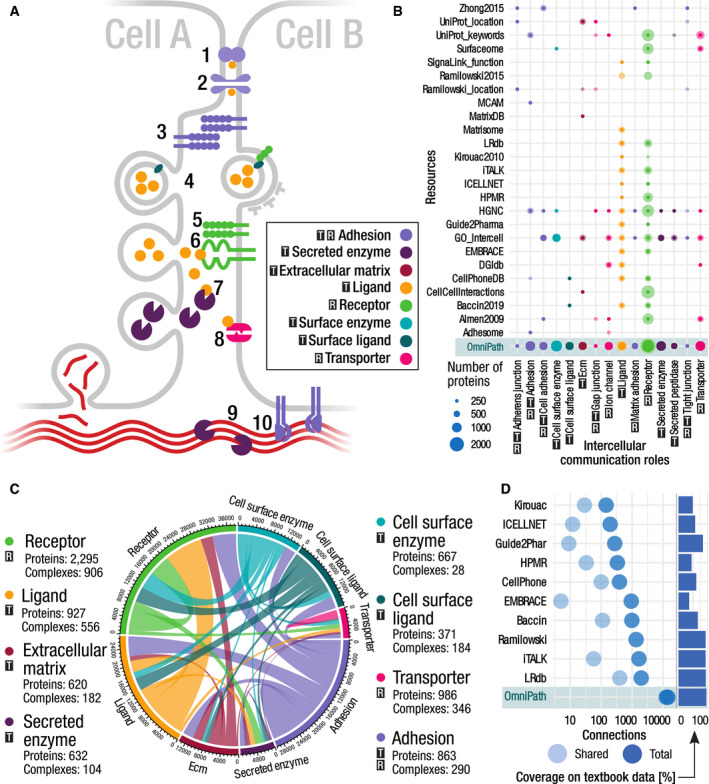
Schematic illustration of the intercellular communication roles and their possible connections. Cells are physically connected by proteins forming tight junctions (1), gap junctions (2), and other adhesion proteins (3); they release vesicles which can be taken up by other cells (4); some receptors form complexes (5) to detect secreted ligands (6); transporters might also be affected by factors released by other cells (8); enzymes released into the extracellular space act on ligands and the extracellular matrix (7, 9); cells release the components of the extracellular matrix and bind to the matrix by adhesion proteins (10).
The main intercellular communication roles (x axis) and the major contributing resources (y axis). Size of the dots represents the number of proteins annotated to have a certain role in a given resource. The darker areas represent the overlaps (proteins annotated in more than one resource for the same role) while the lighter color denotes those unique to that resource.
The intercellular communication network. The circle segments represent the eight main intercellular communication roles. The edges are proportional to the number of interactions in the OmniPath PPI network connecting proteins of one role to the other.
Number of unique, directed transmitter–receiver (e.g., ligand–receptor) connections by resources. Bars on the right show the coverage of each resource on a textbook dataset of 131 well‐known ligand–receptor interactions.
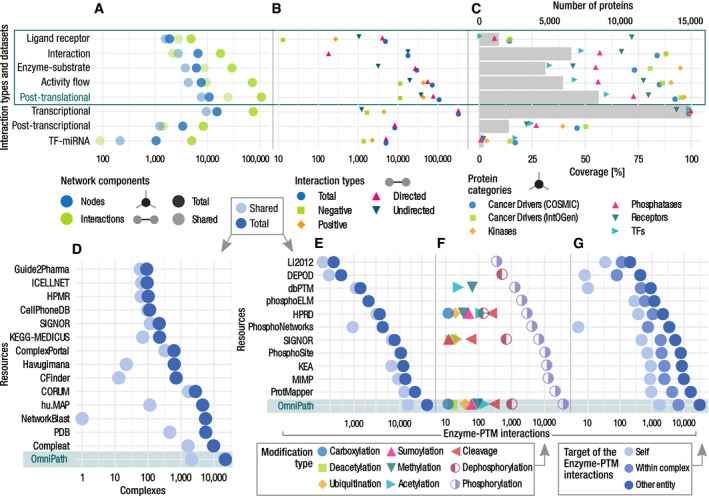
- A–C
Networks by interaction types and the network datasets within the PPI network. (A) Number of nodes and interactions. The light dots represent the shared nodes and edges (in more than one resource), while the dark ones show their total numbers. (B) Causality: number of connections by direction and effect sign. (C) Coverage of the networks on various groups of proteins. Dots show the percentage of proteins covered by network resources for the following groups: cancer driver genes from COSMIC and IntOGen, kinases from kinase.com, phosphatases from Phosphatome.net, receptors from the Human Plasma Membrane Receptome (HPMR) and transcription factors from the TF census. Gray bars show the number of proteins in the networks. The information for individual resources is in Figs EV1 and EV2, Appendix Fig S1.
- D–G
On each panel, the bottom rows represent the combined complex and enzyme–PTM databases contained in OmniPath (D, E). Number of complexes (D) and enzyme–PTM (E) interactions by resource. (F) Enzyme–PTM relationships by PTM type. (G) Enzyme–PTM interactions by their target. Light, medium, and dark dots represent the number of enzyme–PTM relationships targeting the enzyme itself, another protein within the same molecular complex or an independent protein, respectively.
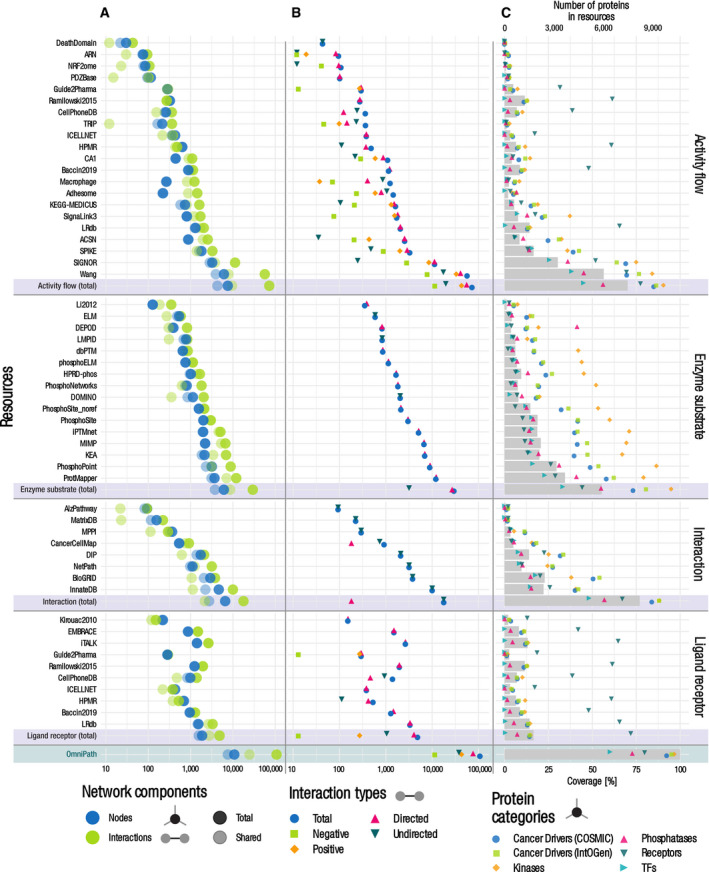
Number of nodes and interactions. The light dots represent the shared nodes and edges (in more than one resource), while the dark ones show their total numbers.
Causality: number of connections by direction and effect sign.
Coverage of the networks on various groups of proteins. Dots show the percentage of proteins covered by network resources for the following groups: cancer driver genes from COSMIC and IntOGen, kinases from kinase.com, phosphatases from Phosphatome.net, receptors from the Human Plasma Membrane Receptome (HPMR) and transcription factors from the TF census. Gray bars show the number of proteins in the networks.
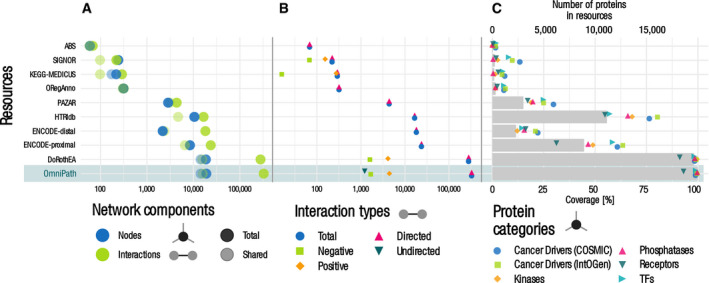
- A–C
Panels and notations are the same as on Fig EV1.
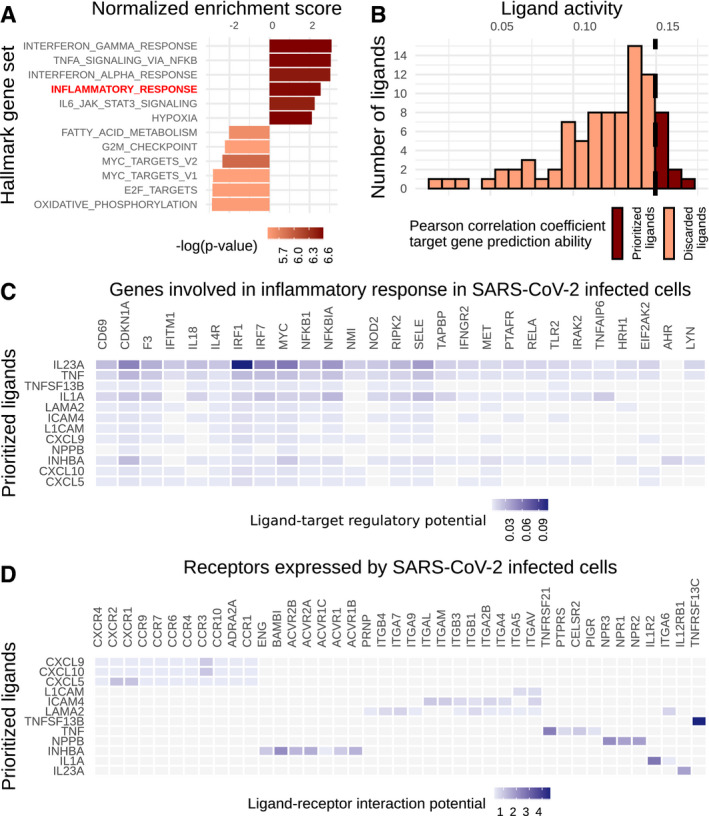
Most significantly enriched gene sets after SARS‐CoV‐2 infection on the Calu3 cell line. Inflammatory response is highlighted in red.
Results of NicheNet’s ligand activity analysis: Number of over‐expressed ligands after SARS‐CoV‐2 infection and their potential to predict the inflammatory response gene set based on the Pearson correlation coefficient. The top 12 ranked ligands, out of a total of 117 over‐expressed ligands, were selected.
Regulatory potential of the top ranked ligands and target genes from the inflammatory response program based on NicheNet’s prior knowledge model.
Ligand–receptor interaction potential based on NicheNet’s prior knowledge model between the top ranked ligands and the receptors expressed in the Calu3 cell line.
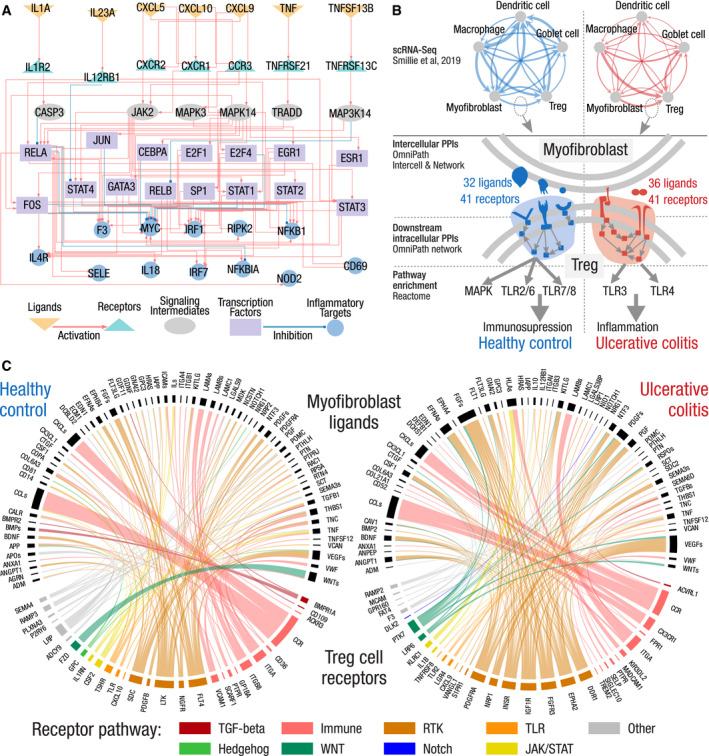
Inter‐ and intracellular signaling interactions linking the top predicted ligands over‐expressed after SARS‐CoV‐2 infection to their potential immune response targets in the Calu3 cell line. Top ranked ligands (orange) connect to their potential receptors (turquoise) that trigger an intracellular cascade until reaching TFs (purple), that in turn regulate the expression of the target genes (blue). Signaling intermediates (gray) connect receptors to TFs across their shortest path.
Intercellular connections and their downstream effect in UC compared with healthy control. Top: communication network of five cell types reconstructed from scRNA‐Seq; the thickness of the edges is proportional to the number of intercellular connections. Bottom: condition‐specific ligand–receptor connections between myofibroblasts and regulatory T cells trigger an immunosuppressive versus an inflammatory signaling in T cells, in healthy and UC, respectively.
Condition‐specific connections between myofibroblast ligands (upper semicircles, black) and Treg cell receptors (lower semicircles, colored by pathways) in ulcerative colitis (right) and healthy control (left). Pathway annotations from SignaLink. Immune—innate immune response, RTK—receptor tyrosine kinase, TLR—Toll‐like receptor.
References
-
- Armstrong JF, Faccenda E, Harding SD, Pawson AJ, Southan C, Sharman JL, Campo B, Cavanagh DR, Alexander SPH, Davenport AP et al (2019) The IUPHAR/BPS guide to PHARMACOLOGY in 2020: extending immunopharmacology content and introducing the IUPHAR/MMV guide to MALARIA PHARMACOLOGY. Nucleic Acids Res 48: D1006–D1021 - PMC - PubMed
Publication types
MeSH terms
Substances
Grants and funding
- BB/CSP17270/1/UKRI|Biotechnology and Biological Sciences Research Council (BBSRC)
- BB/P016774/1/UKRI|Biotechnology and Biological Sciences Research Council (BBSRC)
- BB/R012490/1/UK Research and Innovation|Biotechnology and Biological Sciences Research Council, ISP grant for Gut Microbes and Health
- SA 3554/1-2/Deutsche Forschungsgemeinschaft (DFG)
- BBS/E/T/000PR9817/BB_/Biotechnology and Biological Sciences Research Council/United Kingdom
- BBS/E/F/000PR10355/BB_/Biotechnology and Biological Sciences Research Council/United Kingdom
- BB/J004529/1/UKRI|Biotechnology and Biological Sciences Research Council (BBSRC)
- 116030/European Union Innovative Medicines Initiative TransQST
- 031L0181B/Federal Ministry of Education (BMFB, Computational Life Sciences grant)
- JRC COMBINE, partially funded by Bayer AG
- BB/J004529/1/BB_/Biotechnology and Biological Sciences Research Council/United Kingdom
- BB/M011216/1/UK Research and Innovation|Biotechnology and Biological Sciences Research Council, Norwich Research Park Biosciences Doctoral Training Partnership grant
LinkOut - more resources
Full Text Sources
Other Literature Sources
Medical
Miscellaneous
