. 2021 Sep;73(9):1601-1613.
doi: 10.1002/art.41726. Epub 2021 Aug 9.

Inclusion of Synovial Tissue-Derived Characteristics in a Nomogram for the Prediction of Treatment Response in Treatment-Naive Rheumatoid Arthritis Patients

Affiliations

Inclusion of Synovial Tissue-Derived Characteristics in a Nomogram for the Prediction of Treatment Response in Treatment-Naive Rheumatoid Arthritis Patients

Stefano Alivernini et al. Arthritis Rheumatol. 2021 Sep.

Abstract

Objective: This study applied a synovitis score obtained during routine care from ultrasound (US)-guided biopsies of synovial tissue (ST) in patients with rheumatoid arthritis (RA) and patients with other inflammatory and noninflammatory joint diseases to identify pretreatment synovial biomarkers associated with disease characteristics, and to integrate the findings into a multiparameter nomogram for use in baseline prediction of diagnosis and treatment response in treatment-naive rheumatoid arthritis (RA) patients.

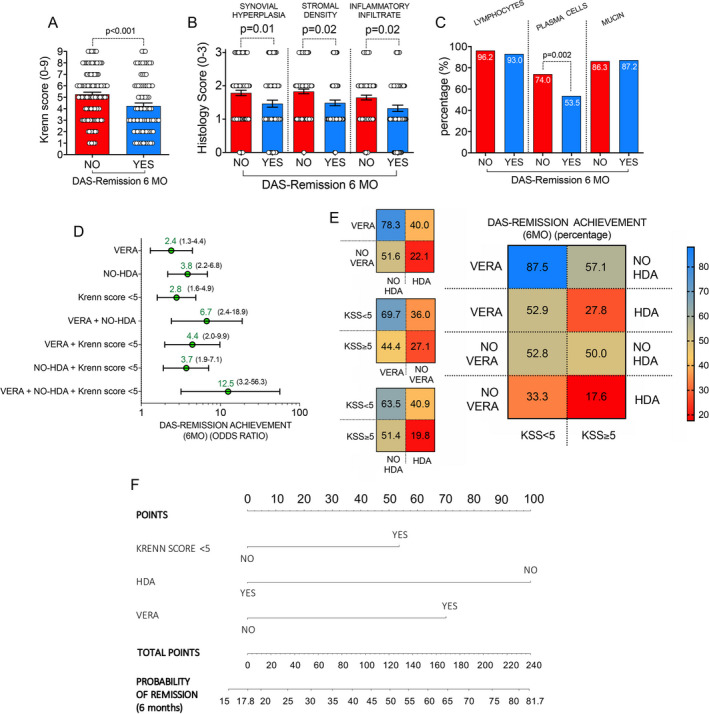
Methods: The study enrolled a total of 1,015 patients with various autoimmune diseases (545 patients with RA, 167 patients with psoriatic arthritis [PsA], 199 patients with undifferentiated peripheral inflammatory arthritis [UPIA], 18 patients with crystal-induced arthritis, 26 patients with connective tissue diseases, and 60 patients with osteoarthritis [OA] [as part of the SYNGem cohort]). All patients underwent a US-guided ST biopsy at baseline, and patients were then stratified according to disease phase. The KSS, along with disease characteristics and clinical outcomes, were incorporated into a nomogram for prediction of achievement of clinical remission in RA patients who were previously naive to treatment. In patients in whom a treat-to-target strategy was applied, remission was defined as change in the Disease Activity Score in 28 joints (DAS28) at 6 months after treatment initiation.

Results: The KSS significantly differed among RA patients, as well as PsA patients and UPIA patients, when compared to OA patients. In RA, the KSS directly correlated with the DAS28 and was related to autoantibody positivity in treatment-naive RA patients. Moreover, at baseline, treatment-naive RA patients achieving 6-month remission according to DAS28 had a lower KSS, shorter duration of symptoms (very early RA [VERA]), and lower disease activity than treatment-naive RA patients not achieving remission according to DAS28. Results of logistic regression analysis identified the following synergistic predictive factors of achievement of DAS28-based disease remission at 6 months: having a short disease duration (VERA), not having high disease activity, and having a KSS of <5 at baseline. A nomogram integrating these baseline clinical and histologic characteristics in treatment-naive RA patients yielded an up to 81.7% probability of achieving 6-month remission according to the DAS28.

Conclusion: The KSS is a reliable tool for synovitis assessment on US-guided ST biopsy, contingent on the phase of the disease and the autoimmune profile of each patient. This tool could be integrated within a therapeutic response-predictive nomogram for the prediction of treatment response in RA patients who were previously naive to treatment.


Figures

Figure 1
Figure 1
Degree of synovial tissue (ST) inflammation in relation to disease category among patients with inflammatory and noninflammatory joint conditions in the SYNGem cohort. A, Distribution of Krenn synovitis scores (KSS) according to disease category among patients with osteoarthritis (OA) (n = 60), patients who achieved sustained clinical remission (Rem) and ultrasound (US) imaging–based remission (psoriatic arthritis [PsA] n = 27, rheumatoid arthritis [RA] n = 92), patients with crystal‐induced arthritis (n = 18), patients with connective tissue diseases (CTDs) (n = 26), patients with undifferentiated peripheral inflammatory arthritis (UPIA) (n = 199), patients resistant to treatment with conventional disease‐modifying antirheumatic drugs (PsA n = 48, RA n = 47), and treatment‐naive patients (PsA n = 103, RA n = 240). B, Degree of synovitis according to disease category. C, Distribution of mean KSS scores according to disease category. Each circle represents a single patient; values are the mean ± SEM. D, Follicular synovitis based on presence versus absence of inflammatory cell aggregates within 2 sequential ST sections from OA patients and RA patients stratified by disease category. E, Correlation between KSS scores and Disease Activity Scores in 28 joints (DAS28) in RA patients (n = 545) stratified by disease category.
Figure 2
Figure 2
Features of US‐assessed synovitis in relation to disease category among patients with RA and other chronic inflammatory joint diseases in the SYNGem cohort. A, Images from power Doppler sonography (PDS) assessment of knee ST from patients in each disease category. B, Distribution of the degree of synovial membrane hypertrophy (SMH), measured as ST thickness on PDS, in the biopsied joints of patients according to disease category. In treatment‐naive RA patients, ST thickness was significantly higher than that in OA patients (mean ± SEM 1.10 ± 0.03 cm versus 0.75 ± 0.04 cm; P < 0.001), but did not differ from that in UPIA patients (1.01 ± 0.02 cm; P = 0.1733). C, Distribution of PD synovial hypertrophy scores in the ST biopsy samples from patients according to disease category. In treatment‐naive RA patients, PD scores were significantly higher than those in UPIA patients (1.71 ± 0.10 versus 1.24 ± 0.07; P < 0.001), CTD patients (1.26 ± 0.19; P = 0.03), and OA patients (0.38 ± 0.07; P < 0.001), but were similar to that in RA patients resistant to treatment (1.58 ± 0.10; P = 0.27) and patients with crystal‐induced arthritis (1.67 ± 0.25; P = 0.88). In B and C, each circle represents a single patient; values are the mean ± SEM. See Figure 1 for other definitions.
Figure 3
Figure 3
ST inflammation in relation to disease characteristics in treatment‐naive RA patients. A, Hematoxylin and eosin staining of ST obtained using minimally invasive US‐guided biopsy of the knees of treatment‐naive RA patients. Each image shows a biopsy sample from an individual patient according to disease duration (time since symptom onset to time of biopsy <3 months [MO], 3–12 months, or >12 months). B, Distribution of mean KSS scores in treatment‐naive RA patients according to disease duration. C, Heatmap showing distribution of KSS scores in treatment‐naive RA patients according to disease duration. Each bar represents a single patient. D, Distribution of mean scores for subcomponents of the KSS (synovial hyperplasia, stromal cell density, and inflammatory infiltrates) in treatment‐naive RA patients according to disease duration. In B and D, each circle represents a single patient; values are the mean ± SEM. E, Follicular synovitis based on presence versus absence of inflammatory cell aggregates in treatment‐naive RA patients according to disease duration. See Figure 1 for other definitions.
Figure 4
Figure 4
Composition of ST inflammation in relation to disease category and autoantibody status. A–C, Left, Hematoxylin and eosin (H&E) staining of ST obtained using minimally invasive US‐guided biopsy of the knee. Images show ST from treatment‐naive RA patients positive for ACPA and/or IgM/IgA–rheumatoid factor autoantibodies (Abpos), displaying enrichment of plasma cells (A) and infiltration of lymphocytes (B) and mucin (C) (indicated by green arrowheads). Original magnification × 40. Right, Results of H&E staining quantified as the percentage of plasma cells (A), lymphocytes (B), and mucin (C) among patients with PSA in each disease category, RA patients in each disease category stratified by autoantibody status, UPIA patients stratified by autoantibody status, and OA patients. See Figure 1 for other definitions.
Figure 5
Figure 5
Nomogram for the prediction of early achievement of clinical remission based on the Disease Activity Score in 28 joints (DAS28) in treatment‐naive RA patients. A and B, Distribution of mean KSS scores (A) and mean histology scores for subcomponents of the KSS (B) in treatment‐naive RA patients based on achievement versus lack of achievement of DAS28‐based clinical remission at 6 months (MO). Each circle represents a single patient; values are the mean ± SEM. C, Distribution of lymphocytes, plasma cells, and mucin presence in ST from treatment‐naive RA patients based on presence versus absence of achievement of DAS28‐based clinical remission at 6 months. D and E, Odds of achieving DAS28‐based remission at 6 months (D) and percentage of patients achieving DAS28‐based remission at 6 months (E) among treatment‐naive RA patients according to different baseline characteristics, including presence versus absence of very early RA (VERA), presence versus absence of high disease activity (HDA), and a KSS score categorized as <5 versus ≥5. Values in D are the odds ratio (with 95% confidence interval) for achievement of DAS28‐based remission at 6 months. F, Nomogram for the computation of the probability of achieving DAS28‐based remission at 6 months in treatment‐naive RA patients. See Figure 1 for other definitions.

References

    1. Lliso‐Ribera G, Humby F, Lewis M, Nerviani A, Mauro D, Rivellese F, et al. Synovial tissue signatures enhance clinical classification and prognostic/treatment response algorithms in early inflammatory arthritis and predict requirement for subsequent biological therapy: results from the pathobiology of early arthritis cohort (PEAC). Ann Rheum Dis 2019;78:1642–52. - PMC - PubMed
    1. Orange DE, Agius P, DiCarlo EF, Robine N, Geiger H, Szymonifka J, et al. Identification of three rheumatoid arthritis disease subtypes by machine learning integration of synovial histologic features and RNA sequencing data. Arthritis Rheumatol 2018;70:690–701. - PMC - PubMed
    1. Smolen JS, Landewé R, Bijlsma J, Burmester GR, Dougados M, Kerschbaumer A, et al. EULAR recommendations for the management of rheumatoid arthritis with synthetic and biological disease‐modifying antirheumatic drugs: 2019 update. Ann Rheum Dis 2020;79:685–99. - PubMed
    1. Humby F, Lewis M, Ramamoorthi N, Hackney JA, Barnes MR, Bombardieri M, et al. Synovial cellular and molecular signatures stratify clinical response to csDMARD therapy and predict radiographic progression in early rheumatoid arthritis patients. Ann Rheum Dis 2019;78:761–72. - PMC - PubMed
    1. Krenn V, Morawietz L, Burmester GR, Kinne RW, Mueller‐Ladner U, Muller B, et al. Synovitis score: discrimination between chronic low‐grade and high‐grade synovitis. Histopathology 2006;49:358–64. - PubMed

Publication types

Substances