. 2021 Mar 10;19(1):41.
doi: 10.1186/s12915-021-00975-9.

The genome of the stable fly, Stomoxys calcitrans, reveals potential mechanisms underlying reproduction, host interactions, and novel targets for pest control

Affiliations

The genome of the stable fly, Stomoxys calcitrans, reveals potential mechanisms underlying reproduction, host interactions, and novel targets for pest control

Pia U Olafson et al. BMC Biol. .

Erratum in

Abstract

Background: The stable fly, Stomoxys calcitrans, is a major blood-feeding pest of livestock that has near worldwide distribution, causing an annual cost of over $2 billion for control and product loss in the USA alone. Control of these flies has been limited to increased sanitary management practices and insecticide application for suppressing larval stages. Few genetic and molecular resources are available to help in developing novel methods for controlling stable flies.

Results: This study examines stable fly biology by utilizing a combination of high-quality genome sequencing and RNA-Seq analyses targeting multiple developmental stages and tissues. In conjunction, 1600 genes were manually curated to characterize genetic features related to stable fly reproduction, vector host interactions, host-microbe dynamics, and putative targets for control. Most notable was characterization of genes associated with reproduction and identification of expanded gene families with functional associations to vision, chemosensation, immunity, and metabolic detoxification pathways.

Conclusions: The combined sequencing, assembly, and curation of the male stable fly genome followed by RNA-Seq and downstream analyses provide insights necessary to understand the biology of this important pest. These resources and new data will provide the groundwork for expanding the tools available to control stable fly infestations. The close relationship of Stomoxys to other blood-feeding (horn flies and Glossina) and non-blood-feeding flies (house flies, medflies, Drosophila) will facilitate understanding of the evolutionary processes associated with development of blood feeding among the Cyclorrhapha.

Keywords: Chemoreceptor genes; Gene regulation; Insect adaptation; Insect immunity; Insect orthology; Metabolic detoxification genes; Muscid genomics; Opsin gene duplication; Stable fly genome.


Conflict of interest statement

The authors declare that they have no competing interests.

Figures
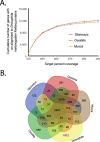
Fig. 1
Fig. 1
Quality assessment of the Stomoxys calcitrans genome. a Number of genes with alignment to Drosophila melanogaster genome. b Ortholog group comparison between S. calcitrans (Stomoxys), Musca domestica (Musca), Ceratitis capitata (Ceratitis), Glossina morsitans (Glossina), and D. melanogaster (Drosophila) based on comparison to the OrthoDB8 database
Fig. 2
Fig. 2
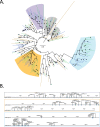
Phylogenetic tree of the Stomoxys calcitrans OBPs with those of Drosophila melanogaster and Musca domestica and locations of OBPs on Stomoxys scaffolds. a Maximum likelihood phylogeny was constructed using the web server version of IQ-TREE software ([114]; best-fit substitution model, branch support assessed with 1000 replicates of UFBoot bootstrap approximation). The full phylogenetic tree can be found in Additional file 1: Figure S8. The S. calcitrans and M. domestica lineages are in green and blue, respectively, while D. melanogaster lineages are in mustard. Clades that are expanded in the muscids relative to Drosophila or lost in Drosophila are shaded in orange and gray. Purple shading comprises a clade of muscid OBPs with no apparent ortholog in Drosophila, while blue shading comprises a clade that includes the Drosophila Minus-C OBP subfamily and represents an apparent muscid expansion relative to DmelObp99c. b Three Stomoxys scaffolds on which 51 of 90 OBPs are organized. The location of each OBP gene is indicated by a horizontal line. Transcriptional directions are indicated by (+) for same direction as the scaffold or (−) for the opposite direction. The color of the box reflects the shaded clades in a
Fig. 3
Fig. 3
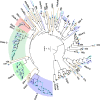
Phylogenetic tree of the Stomoxys calcitrans GRs with those of Drosophila melanogaster and Musca domestica. Maximum likelihood tree rooted by divergent carbon dioxide and sugar receptor subfamilies as the outgroup. The S. calcitrans and M. domestica lineages are highlighted in teal and blue, respectively, while D. melanogaster lineages are in mustard. Support levels from the approximate likelihood-ratio test (aLRT) from the PhyML v3.0 web server are shown. Subfamilies and individual or clustered Drosophila genes are indicated outside the circle to facilitate finding them in the tree. Four clades of candidate bitter receptors that are expanded in the muscids are highlighted. Scale bar indicates amino acid substitutions per site. The full phylogenetic tree can be found in Additional file 1: Figure S11
Fig. 4
Fig. 4
Phylogenetic tree of the Stomoxys calcitrans IRs with those of Drosophila melanogaster and Musca domestica. Maximum likelihood tree rooted with the Ir8a/25a lineage as the outgroup. The S. calcitrans and M. domestica lineages are in teal and blue, respectively, while D. melanogaster lineages are in mustard. Support levels from the approximate likelihood-ratio test from the PhyML v3.0 are shown. Subfamilies, clades, and individual Drosophila genes are indicated outside the circle to facilitate finding them in the tree. Pseudogenic sequences are indicated with the suffix P. Scale bar indicates amino acid substitutions per site. The full phylogenetic tree can be found in Additional file 1: Figure S12
Fig. 5
Fig. 5
Opsin gene family members detected in Stomoxys calcitrans and other higher Diptera. A phylogenetic tree of dipteran opsin gene relationships is presented, as is the genomic organization and evolution of the S. calcitrans Rh1 opsin subfamily [200]. Protein sequences of S. calcitrans Rh1 genes were aligned with MUSCLE [201], and ambiguous alignment regions were filtered with Gblocks [202] using least stringent settings. Maximum likelihood tree was estimated in MEGA version 6.0 [203] applying the Jones-Taylor-Thornton (JTT) model of amino acid sequence evolution and assuming Gamma Distributed substitution rates across sites with 3 categories. Rhabdomeric opsins depicted: Rh7, Rh7 gene; UV, UV-sensitive; B, Blue-sensitive; LW, long wavelength-sensitive expressed in BR, compound eye, and OC, ocelli
Fig. 6
Fig. 6
Maximum likelihood phylogenetic analysis of yolk protein genes from Drosophila melanogaster, Glossina morsitans, Musca domestica, and Stomoxys calcitrans. Gene sequences with significant homology were aligned using the ClustalO software package [221], and the alignment used to estimate a Maximum likelihood phylogeny in CLC Main Workbench (construction method: neighbor joining, Protein substitution model: WAG, Bootstrap analysis: 1000 replicates). Numerical annotations indicate bootstrap values for each branch point in the tree. Heat map of gene expression (transcripts per million, TPM) is based on RNA-Seq data (see Additional file 4). RS, reproductive system
Fig. 7
Fig. 7
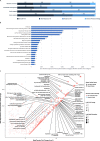
Analysis of male reproductive biased genes in Stomoxys calcitrans. a Results of reciprocal BLAST analysis of male reproductive tract biased genes. b Expression analysis of top 20 most abundant gene classes in the male reproductive tract RNA-Seq dataset versus the female reproductive tract, as annotated by BLAST best hits. Bar length represents combined expression values in TPM for the genes included in that category. Numbers associated with the bars represent the number of genes in that functional classification that had a male reproductive tract-biased expression. c Scatter plot of the 763 Stomoxys male reproductive biased genes. The plot shows on the x-axis - log2 fold change expression in males relative to females and the y-axis represents the log2 transformed expression value in TPM in the male reproductive tissue. Triangular points are genes predicted to contain signal peptides and blue points are genes with orthology to seminal proteins in other species. Genes with a log2 expression value above 10 and log2 Male/female fold change value above 5 are annotated with putative functional descriptions
Fig. 8
Fig. 8
Analysis of salivary gland biased genes in Stomoxys calcitrans. Number of Illumina reads versus fold enrichment in the salivary gland related to the whole body. Each point represents the average among all genes in that specific category. Expression levels are based on results in Additional file 11
Fig. 9
Fig. 9
Phylogenetic analysis of cytochrome P450 genes from Stomoxys calcitrans. Amino acid sequences from each family were aligned with the MUSCLE algorithm [201], and the alignments trimmed with the trimAl tool using the –strictplus option [266]. The trimmed alignment was used to construct a maximum likelihood phylogeny, rooted with Mus musculus CYP51 as the outgroup, with the web server version of IQ-TREE software (best-fit substitution model, branch support assessed with 1000 replicates of UFBoot bootstrap approximation; bootstrap percentages reported [114]). The CYP clades are identified by different colored lineages, and CYP gene clusters that are found in tandem within the genome are shaded in gray. P450 gene names were assigned based on comparative analyses (see Additional file 13), and the full phylogenetic tree can be found in Additional file 1: Figure S21
Fig. 10
Fig. 10
Transcription factors associated with Stomoxys calcitrans. a Number of transcription factors identified in S. calcitrans compared to other flies. b, c Overlap between transcription factors with increased binding sites in differentially expressed genes that have noted expression in the same tissue (F, teneral female; FRS, female reproductive system; M, male; MRS, male reproductive system; SG, salivary glands). d Expression of specific TFs associated with female, male, and salivary glands among multiple tissues and developmental stages

Similar articles

Cited by

References

    1. Krafsur ES, Moon RD. Bionomics of the face fly, Musca autumnalis. Annu Rev Entomol. 1997;42:503–523. doi: 10.1146/annurev.ento.42.1.503. - DOI - PubMed
    1. Foil LD, Hogsette JA. Biology and control of tabanids, stable flies and horn flies. Rev Sci Tech. 1994;13:1125–1158. doi: 10.20506/rst.13.4.821. - DOI - PubMed
    1. Dougherty CT, Knapp FW, Burrus PB, Willis DC, Burg JG, Cornelius PL, Bradley NW. Stable flies (Stomoxys calcitrans L) and the behavior of grazing beef cattle. Appl Anim Behav Sci. 1993;35:215–233. doi: 10.1016/0168-1591(93)90138-F. - DOI
    1. Dougherty CT, Knapp FW, Burrus PB, Willis DC, Cornelius PL. Moderation of grazing behavior of beef cattle by stable flies (Stomoxys calcitrans L) Appl Anim Behav Sci. 1994;40:113–127. doi: 10.1016/0168-1591(94)90076-0. - DOI
    1. Dougherty CT, Knapp FW, Burrus PB, Willis DC, Cornelius PL. Behavior of grazing cattle exposed to small populations of stable flies (Stomoxys calcitrans L) Appl Anim Behav Sci. 1995;42:231–248. doi: 10.1016/0168-1591(94)00546-Q. - DOI

Publication types