

Classification Models for COVID-19 Test Prioritization in Brazil: Machine Learning Approach
- PMID: 33750734
- PMCID: PMC8034680
- DOI: 10.2196/27293
Classification Models for COVID-19 Test Prioritization in Brazil: Machine Learning Approach
Abstract
Background: Controlling the COVID-19 outbreak in Brazil is a challenge due to the population's size and urban density, inefficient maintenance of social distancing and testing strategies, and limited availability of testing resources.
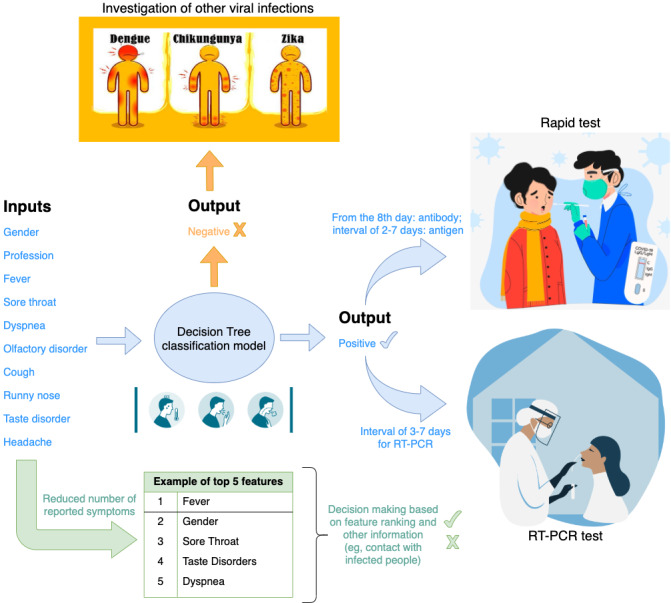
Objective: The purpose of this study is to effectively prioritize patients who are symptomatic for testing to assist early COVID-19 detection in Brazil, addressing problems related to inefficient testing and control strategies.
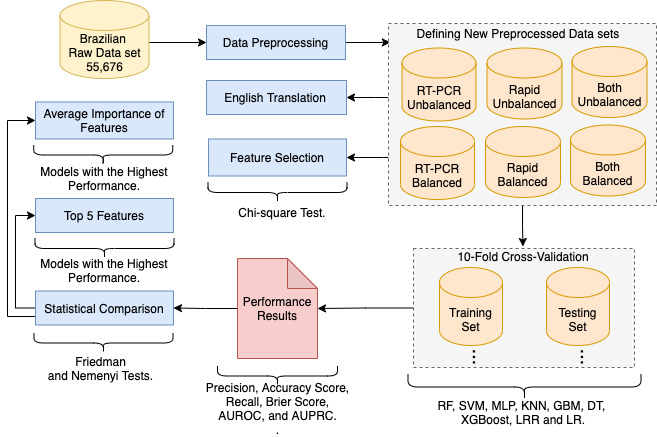
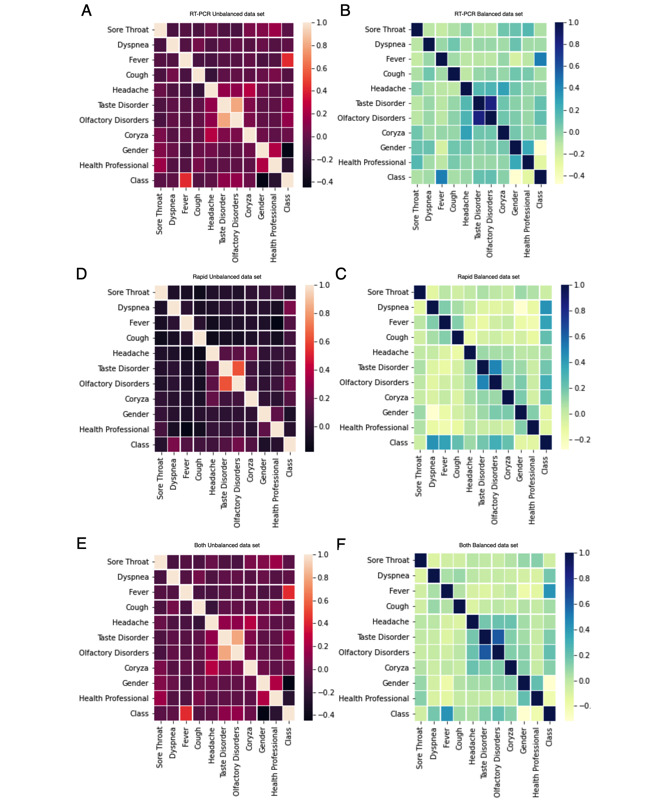
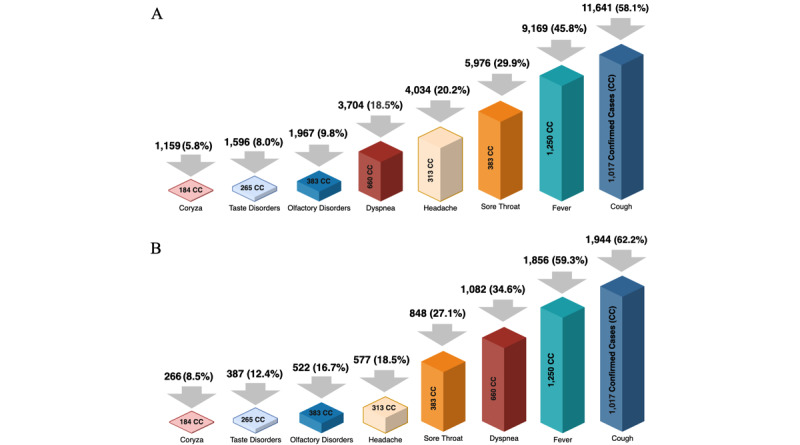
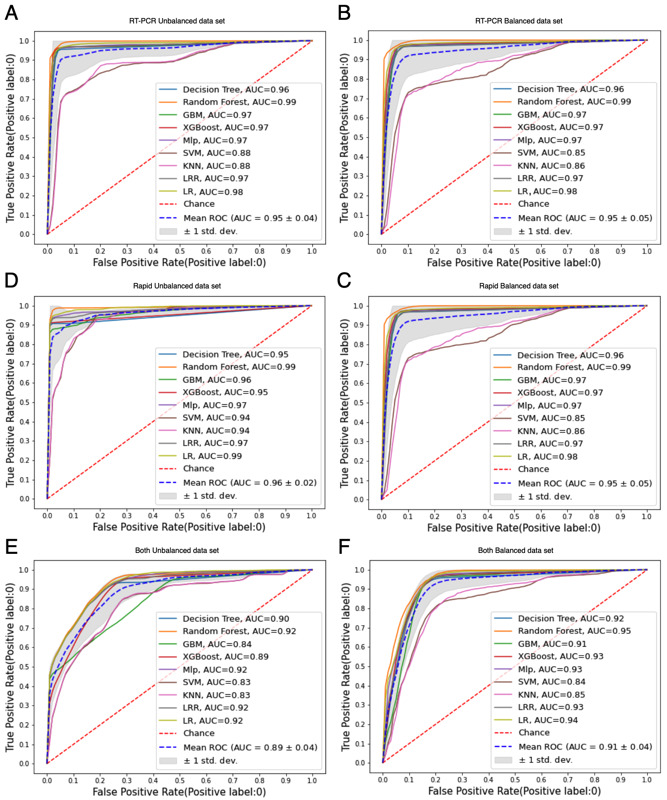
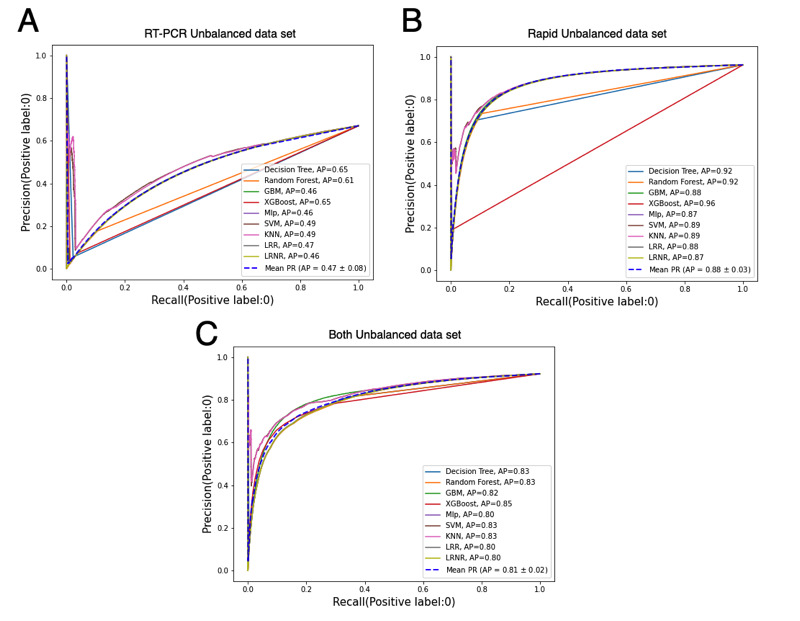
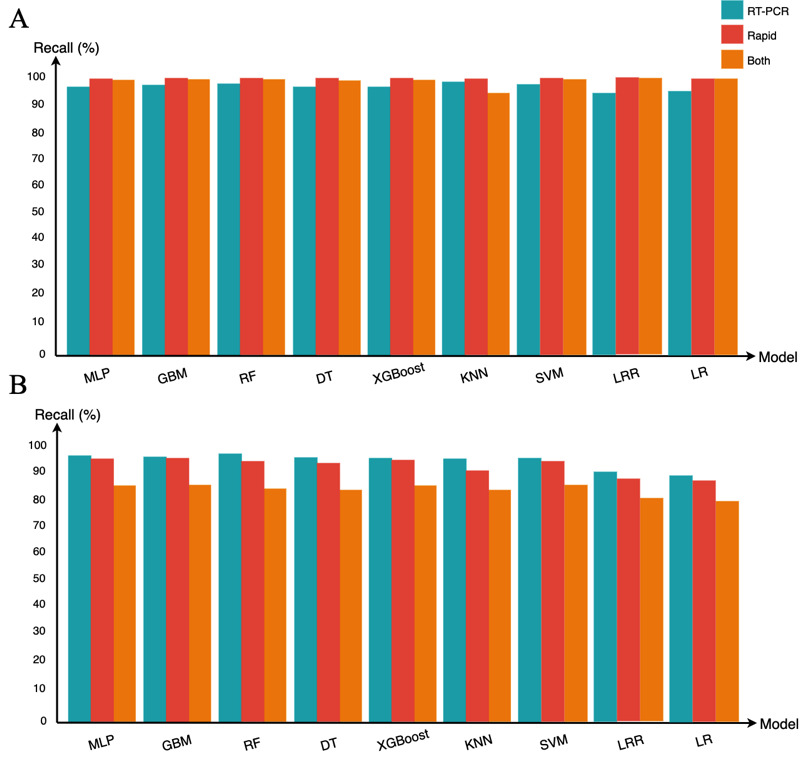
Methods: Raw data from 55,676 Brazilians were preprocessed, and the chi-square test was used to confirm the relevance of the following features: gender, health professional, fever, sore throat, dyspnea, olfactory disorders, cough, coryza, taste disorders, and headache. Classification models were implemented relying on preprocessed data sets; supervised learning; and the algorithms multilayer perceptron (MLP), gradient boosting machine (GBM), decision tree (DT), random forest (RF), extreme gradient boosting (XGBoost), k-nearest neighbors (KNN), support vector machine (SVM), and logistic regression (LR). The models' performances were analyzed using 10-fold cross-validation, classification metrics, and the Friedman and Nemenyi statistical tests. The permutation feature importance method was applied for ranking the features used by the classification models with the highest performances.
Results: Gender, fever, and dyspnea were among the highest-ranked features used by the classification models. The comparative analysis presents MLP, GBM, DT, RF, XGBoost, and SVM as the highest performance models with similar results. KNN and LR were outperformed by the other algorithms. Applying the easy interpretability as an additional comparison criterion, the DT was considered the most suitable model.
Conclusions: The DT classification model can effectively (with a mean accuracy≥89.12%) assist COVID-19 test prioritization in Brazil. The model can be applied to recommend the prioritizing of a patient who is symptomatic for COVID-19 testing.
Keywords: COVID-19; classification models; medical diagnosis; test prioritization.
©Íris Viana dos Santos Santana, Andressa CM da Silveira, Álvaro Sobrinho, Lenardo Chaves e Silva, Leandro Dias da Silva, Danilo F S Santos, Edmar C Gurjão, Angelo Perkusich. Originally published in the Journal of Medical Internet Research (http://www.jmir.org), 08.04.2021.
Conflict of interest statement
Conflicts of Interest: None declared.
Figures
Similar articles
-
Machine learning algorithms for predicting COVID-19 mortality in Ethiopia.BMC Public Health. 2024 Jun 28;24(1):1728. doi: 10.1186/s12889-024-19196-0. BMC Public Health. 2024. PMID: 38943093 Free PMC article.
-
Prediction and feature selection of low birth weight using machine learning algorithms.J Health Popul Nutr. 2024 Oct 12;43(1):157. doi: 10.1186/s41043-024-00647-8. J Health Popul Nutr. 2024. PMID: 39396025 Free PMC article.
-
Comparative Study of Classification Algorithms for Various DNA Microarray Data.Genes (Basel). 2022 Mar 11;13(3):494. doi: 10.3390/genes13030494. Genes (Basel). 2022. PMID: 35328048 Free PMC article.
-
Artificial intelligence in clinical care amidst COVID-19 pandemic: A systematic review.Comput Struct Biotechnol J. 2021;19:2833-2850. doi: 10.1016/j.csbj.2021.05.010. Epub 2021 May 7. Comput Struct Biotechnol J. 2021. PMID: 34025952 Free PMC article. Review.
-
An Overview of Supervised Machine Learning Methods and Data Analysis for COVID-19 Detection.J Healthc Eng. 2021 Nov 22;2021:4733167. doi: 10.1155/2021/4733167. eCollection 2021. J Healthc Eng. 2021. PMID: 34853669 Free PMC article. Review.
Cited by
-
Web-Based Skin Cancer Assessment and Classification Using Machine Learning and Mobile Computerized Adaptive Testing in a Rasch Model: Development Study.JMIR Med Inform. 2022 Mar 9;10(3):e33006. doi: 10.2196/33006. JMIR Med Inform. 2022. PMID: 35262505 Free PMC article.
-
COVID-19 Diagnosis from Chest X-ray Images Using a Robust Multi-Resolution Analysis Siamese Neural Network with Super-Resolution Convolutional Neural Network.Diagnostics (Basel). 2022 Mar 18;12(3):741. doi: 10.3390/diagnostics12030741. Diagnostics (Basel). 2022. PMID: 35328294 Free PMC article.
-
An overview of deep learning techniques for COVID-19 detection: methods, challenges, and future works.Multimed Syst. 2023;29(3):1603-1627. doi: 10.1007/s00530-023-01083-0. Epub 2023 Mar 25. Multimed Syst. 2023. PMID: 37261262 Free PMC article.
-
Signs and symptoms to determine if a patient presenting in primary care or hospital outpatient settings has COVID-19.Cochrane Database Syst Rev. 2022 May 20;5(5):CD013665. doi: 10.1002/14651858.CD013665.pub3. Cochrane Database Syst Rev. 2022. PMID: 35593186 Free PMC article.
-
Radiomics models to predict bone marrow metastasis of neuroblastoma using CT.Cancer Innov. 2024 Jun 28;3(5):e135. doi: 10.1002/cai2.135. eCollection 2024 Oct. Cancer Innov. 2024. PMID: 38948899 Free PMC article.
References
-
- Elhoseny M, Abdelaziz A, Salama AS, Riad A, Muhammad K, Sangaiah AK. A hybrid model of Internet of Things and cloud computing to manage big data in health services applications. Future Generation Computer Syst. 2018 Sep;86:1383–1394. doi: 10.1016/j.future.2018.03.005. - DOI
-
- Chatterjee A, Gerdes MW, Martinez S. eHealth initiatives for the promotion of healthy lifestyle and allied implementation difficulties. International Conference on Wireless and Mobile Computing, Networking and Communications; October 21-23, 2019; Barcelona, Spain. 2019. pp. 1–8. - DOI
-
- Guimarães VHA, de Oliveira-Leandro M, Cassiano C, Marques ALP, Motta C, Freitas-Silva AL, de Sousa MAD, Silveira LAM, Pardi TC, Gazotto FC, Silva MV, Rodrigues V, Rodrigues WF, Oliveira CJF. Knowledge about COVID-19 in Brazil: cross-sectional web-based study. JMIR Public Health Surveill. 2021 Jan 21;7(1):e24756. doi: 10.2196/24756. https://publichealth.jmir.org/2021/1/e24756/ - DOI - PMC - PubMed
MeSH terms
LinkOut - more resources
Full Text Sources
Other Literature Sources
Medical
