

Evolving Epidemiological Characteristics of COVID-19 in Hong Kong From January to August 2020: Retrospective Study
- PMID: 33750740
- PMCID: PMC8054773
- DOI: 10.2196/26645
Evolving Epidemiological Characteristics of COVID-19 in Hong Kong From January to August 2020: Retrospective Study
Abstract
Background: COVID-19 has plagued the globe, with multiple SARS-CoV-2 clusters hinting at its evolving epidemiology. Since the disease course is governed by important epidemiological parameters, including containment delays (time between symptom onset and mandatory isolation) and serial intervals (time between symptom onsets of infector-infectee pairs), understanding their temporal changes helps to guide interventions.
Objective: This study aims to characterize the epidemiology of the first two epidemic waves of COVID-19 in Hong Kong by doing the following: (1) estimating the containment delays, serial intervals, effective reproductive number (Rt), and proportion of asymptomatic cases; (2) identifying factors associated with the temporal changes of the containment delays and serial intervals; and (3) depicting COVID-19 transmission by age assortativity and types of social settings.
Methods: We retrieved the official case series and the Apple mobility data of Hong Kong from January-August 2020. The empirical containment delays and serial intervals were fitted to theoretical distributions, and factors associated with their temporal changes were quantified in terms of percentage contribution (the percentage change in the predicted outcome from multivariable regression models relative to a predefined comparator). Rt was estimated with the best fitted distribution for serial intervals.
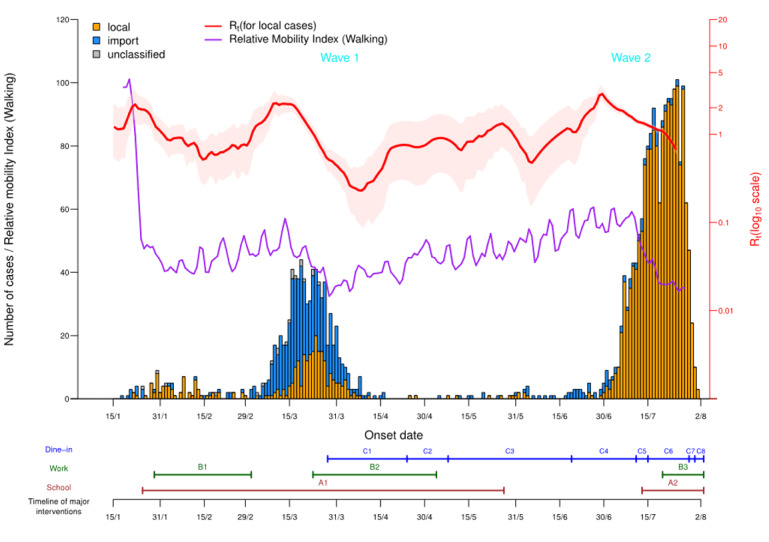
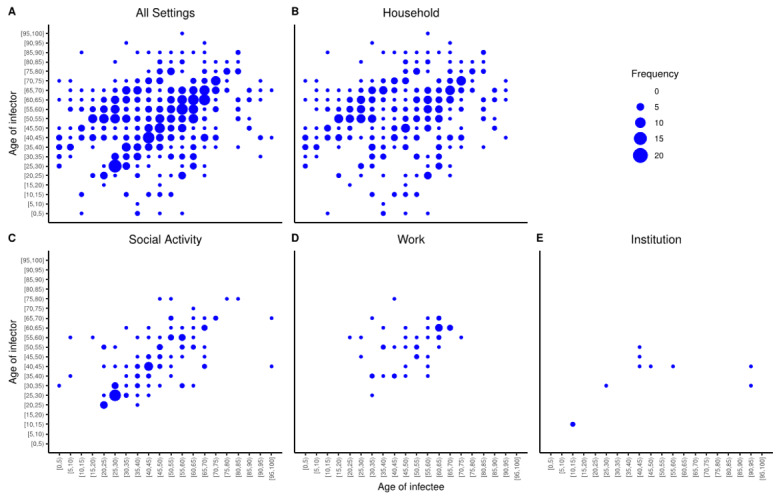
Results: The two epidemic waves were characterized by imported cases and clusters of local cases, respectively. Rt peaked at 2.39 (wave 1) and 3.04 (wave 2). The proportion of asymptomatic cases decreased from 34.9% (0-9 years) to 12.9% (≥80 years). Log-normal distribution best fitted the 1574 containment delays (mean 5.18 [SD 3.04] days) and the 558 serial intervals (17 negative; mean 4.74 [SD 4.24] days). Containment delays decreased with involvement in a cluster (percentage contribution: 10.08%-20.73%) and case detection in the public health care sector (percentage contribution: 27.56%, 95% CI 22.52%-32.33%). Serial intervals decreased over time (6.70 days in wave 1 versus 4.35 days in wave 2) and with tertiary transmission or beyond (percentage contribution: -50.75% to -17.31%), but were lengthened by mobility (percentage contribution: 0.83%). Transmission within the same age band was high (18.1%). Households (69.9%) and social settings (20.3%) were where transmission commonly occurred.
Conclusions: First, the factors associated with reduced containment delays suggested government-enacted interventions were useful for achieving outbreak control and should be further encouraged. Second, the shorter serial intervals associated with the composite mobility index calls for empirical surveys to disentangle the role of different contact dimensions in disease transmission. Third, the presymptomatic transmission and asymptomatic cases underscore the importance of remaining vigilant about COVID-19. Fourth, the time-varying epidemiological parameters suggest the need to incorporate their temporal variations when depicting the epidemic trajectory. Fifth, the high proportion of transmission events occurring within the same age group supports the ban on gatherings outside of households, and underscores the need for residence-centered preventive measures.
Keywords: COVID-19; China; Hong Kong; SARS-CoV-2; case study; containment delay; epidemiology; evolving epidemiology; intervention; public health; serial interval; transmission.
©Kin On Kwok, Wan In Wei, Ying Huang, Kai Man Kam, Emily Ying Yang Chan, Steven Riley, Ho Hin Henry Chan, David Shu Cheong Hui, Samuel Yeung Shan Wong, Eng Kiong Yeoh. Originally published in the Journal of Medical Internet Research (http://www.jmir.org), 16.04.2021.
Conflict of interest statement
Conflicts of Interest: None declared.
Figures
Similar articles
-
Epidemiological characteristics of the first 53 laboratory-confirmed cases of COVID-19 epidemic in Hong Kong, 13 February 2020.Euro Surveill. 2020 Apr;25(16):2000155. doi: 10.2807/1560-7917.ES.2020.25.16.2000155. Euro Surveill. 2020. PMID: 32347198 Free PMC article.
-
Stringent containment measures without complete city lockdown to achieve low incidence and mortality across two waves of COVID-19 in Hong Kong.BMJ Glob Health. 2020 Oct;5(10):e003573. doi: 10.1136/bmjgh-2020-003573. BMJ Glob Health. 2020. PMID: 33028700 Free PMC article.
-
Insights into COVID-19 epidemiology and control from temporal changes in serial interval distributions in Hong Kong.Am J Epidemiol. 2025 Apr 8;194(4):1079-1089. doi: 10.1093/aje/kwae220. Am J Epidemiol. 2025. PMID: 39013785
-
Serial Intervals and Case Isolation Delays for Coronavirus Disease 2019: A Systematic Review and Meta-Analysis.Clin Infect Dis. 2022 Mar 1;74(4):685-694. doi: 10.1093/cid/ciab491. Clin Infect Dis. 2022. PMID: 34037748 Free PMC article.
-
Evolution and Control of COVID-19 Epidemic in Hong Kong.Viruses. 2022 Nov 14;14(11):2519. doi: 10.3390/v14112519. Viruses. 2022. PMID: 36423128 Free PMC article. Review.
Cited by
-
Improved time-varying reproduction numbers using the generation interval for COVID-19.Front Public Health. 2023 Jun 30;11:1185854. doi: 10.3389/fpubh.2023.1185854. eCollection 2023. Front Public Health. 2023. PMID: 37457248 Free PMC article.
-
Evaluation of the EsteR Toolkit for COVID-19 Decision Support: Sensitivity Analysis and Usability Study.JMIR Form Res. 2023 Jun 27;7:e44549. doi: 10.2196/44549. JMIR Form Res. 2023. PMID: 37368487 Free PMC article.
-
The non-pharmaceutical interventions may affect the advantage in transmission of mutated variants during epidemics: A conceptual model for COVID-19.J Theor Biol. 2022 Jun 7;542:111105. doi: 10.1016/j.jtbi.2022.111105. Epub 2022 Mar 21. J Theor Biol. 2022. PMID: 35331730 Free PMC article.
-
Epidemiology, clinical spectrum, viral kinetics and impact of COVID-19 in the Asia-Pacific region.Respirology. 2021 Apr;26(4):322-333. doi: 10.1111/resp.14026. Epub 2021 Mar 9. Respirology. 2021. PMID: 33690946 Free PMC article. Review.
-
Dynamic characteristics of a COVID-19 outbreak in Nanjing, Jiangsu province, China.Front Public Health. 2022 Nov 22;10:933075. doi: 10.3389/fpubh.2022.933075. eCollection 2022. Front Public Health. 2022. PMID: 36483256 Free PMC article.
References
-
- World Health Organization Weekly Epidemiological Update - Coronavirus disease 2019 (COVID-19) 2020. Sep 27, [2020-09-30]. https://www.who.int/docs/default-source/coronaviruse/situation-reports/2....
-
- Covid: How are European countries tackling the pandemic? BBC News. https://www.bbc.com/news/explainers-53640249.
-
- Park M, Cook AR, Lim JT, Sun Y, Dickens BL. A Systematic Review of COVID-19 Epidemiology Based on Current Evidence. J Clin Med. 2020 Mar 31;9(4):967. doi: 10.3390/jcm9040967. https://www.mdpi.com/resolver?pii=jcm9040967 - DOI - PMC - PubMed
-
- Yang X, Dong N, Chan EW, Chen S. Genetic cluster analysis of SARS-CoV-2 and the identification of those responsible for the major outbreaks in various countries. Emerg Microbes Infect. 2020 Dec 11;9(1):1287–1299. doi: 10.1080/22221751.2020.1773745. https://www.tandfonline.com/doi/full/10.1080/22221751.2020.1773745 - DOI - DOI - PMC - PubMed
MeSH terms
Grants and funding
LinkOut - more resources
Full Text Sources
Medical
Miscellaneous
