. 2021 Mar 9;12(1):1524.
doi: 10.1038/s41467-021-21747-7.

The impact of contact tracing and household bubbles on deconfinement strategies for COVID-19

Affiliations

The impact of contact tracing and household bubbles on deconfinement strategies for COVID-19

Lander Willem et al. Nat Commun. .

Abstract

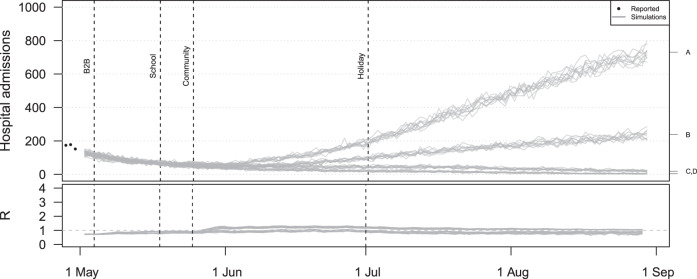
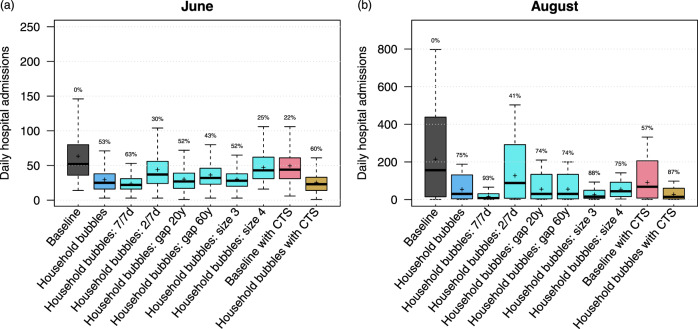
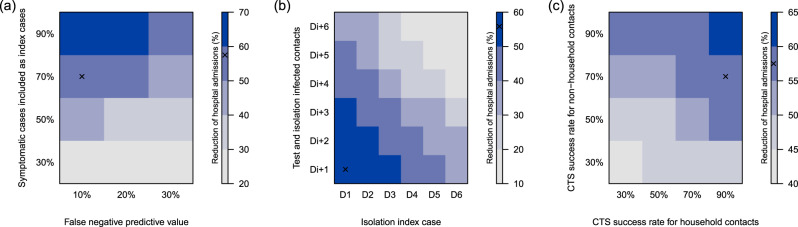
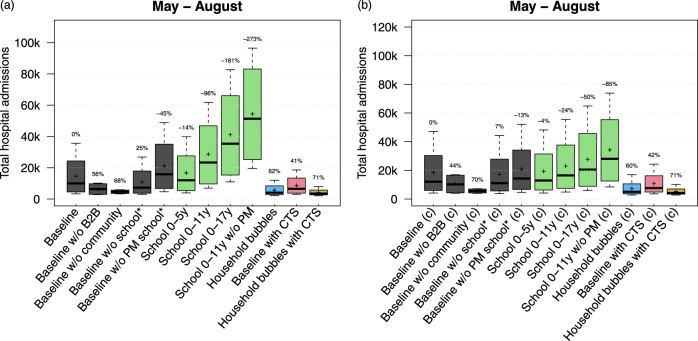
The COVID-19 pandemic caused many governments to impose policies restricting social interactions. A controlled and persistent release of lockdown measures covers many potential strategies and is subject to extensive scenario analyses. Here, we use an individual-based model (STRIDE) to simulate interactions between 11 million inhabitants of Belgium at different levels including extended household settings, i.e., "household bubbles". The burden of COVID-19 is impacted by both the intensity and frequency of physical contacts, and therefore, household bubbles have the potential to reduce hospital admissions by 90%. In addition, we find that it is crucial to complete contact tracing 4 days after symptom onset. Assumptions on the susceptibility of children affect the impact of school reopening, though we find that business and leisure-related social mixing patterns have more impact on COVID-19 associated disease burden. An optimal deployment of the mitigation policies under study require timely compliance to physical distancing, testing and self-isolation.


Conflict of interest statement

The authors declare no competing interests.

Figures

Fig. 1
Fig. 1. Hospital admissions and effective reproduction number (R) from the baseline scenario including four mixing assumptions.
All simulations include social restrictions from March 14th and the partial school reopening in May. For the B2B, the social mixing after the lockdown is assumed to double from the indicated point in time (marked on the right hand side with A and C) or to remain constant (B,D). Social mixing in the community is assumed to double (A,B) or to remain constant (C,D).
Fig. 2
Fig. 2. Impact of household bubbles and contact tracing on hospital admissions.
Hospital admissions over time when community mixing occurs in household bubbles (a), contact tracing strategy is in place (b), or both (c). All scenarios are based on the same natural disease history and quantitative mixing assumptions, but differ from the baseline in terms of the network structure and application of contact tracing from the given point in time. The mixing assumptions A,B,C,D are explained in the caption of Fig. 1. CST contact tracing strategy.
Fig. 3
Fig. 3. Daily hospital admissions per scenario.
Distribution of the daily hospital admissions by June (a) and August (b) per scenario. The results are presented as the median (line), quartiles (box), 2.5 and 97.5 percentiles (whiskers) and average (cross) of 40 model realisations (i.e., ten stochastic runs for each of the four social contact behaviour assumptions). The percentage on top of the whiskers indicates relative reduction of the scenario average with respect to the baseline. CTS contact tracing strategy.
Fig. 4
Fig. 4. Reduction of hospital admissions due to contact tracing according to the symptomatic cases included as an index case, the false-negative predictive value of testing, delays and the success rate of tracing, testing and isolating household and (non-)household contacts.
Timings are expressed relative to symptom onset of the index case (D0), and days after testing the index case (e.g., Di + 1). All simulations start from the baseline scenario and assume a 50% and 30% reduction of B2B and community contacts, respectively, compared to pre-lockdown observations. The “x” marks the default settings, which are used if a parameter is not shown. CST contact tracing strategy.
Fig. 5
Fig. 5. Impact of location-specific re-openings and age-specific susceptibility.
Total hospital admissions per scenario from May to August assuming that children between 0 and 17 years are equally susceptible as adults (a) or only half as susceptible compared to adults (b). The results are presented as the median (line), quartiles (box), 2.5 and 97.5 percentiles (whiskers) and average (cross) of 40 model realisations (i.e., ten stochastic runs for each of the four social contact behaviour assumptions). The percentages on top of the whiskers indicate the average reduction in hospital admissions with respect to the baseline. CTS contact tracing strategy, w/o without, PM precautionary measures at school.

References

    1. Keeling MJ, Hollingsworth TD, Read JM. The efficacy of contact tracing for the containment of the 2019 novel coronavirus (COVID-19) J. Epidemiol. Community Health. 2020;74:861–866. - PMC - PubMed
    1. Willem L, Verelst F, Bilcke J, Hens N, Beutels P. Lessons from a decade of individual-based models for infectious disease transmission: a systematic review (2006–2015) BMC Infect. Dis. 2017;17:612. doi: 10.1186/s12879-017-2699-8. - DOI - PMC - PubMed
    1. Panovska-Griffiths J, et al. Determining the optimal strategy for reopening schools, the impact of test and trace interventions, and the risk of occurrence of a second COVID-19 epidemic wave in the UK: a modelling study. The Lancet Child & Adolescent Health. 2020;4:817–827. doi: 10.1016/S2352-4642(20)30250-9. - DOI - PMC - PubMed
    1. Verelst F, Willem L, Beutels P. Behavioural change models for infectious disease transmission: a systematic review (2010–2015) J. R. Soc. Interface. 2016;13:20160820. doi: 10.1098/rsif.2016.0820. - DOI - PMC - PubMed
    1. Hoang TV, et al. A systematic review of social contact surveys to inform transmission models of close-contact infections. Epidemiology. 2019;30:723–736. doi: 10.1097/EDE.0000000000001047. - DOI - PMC - PubMed

Publication types

MeSH terms