. 2021 Mar 9;12(1):1526.
doi: 10.1038/s41467-020-20811-y.

Recovery of logged forest fragments in a human-modified tropical landscape during the 2015-16 El Niño

Affiliations

Recovery of logged forest fragments in a human-modified tropical landscape during the 2015-16 El Niño

Matheus Henrique Nunes et al. Nat Commun. .

Abstract

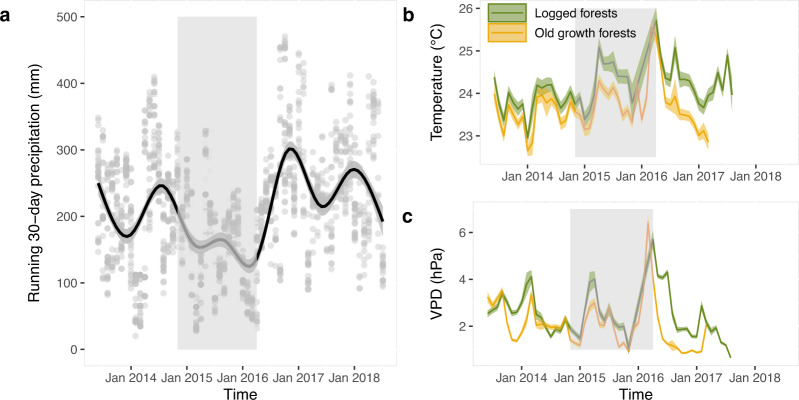
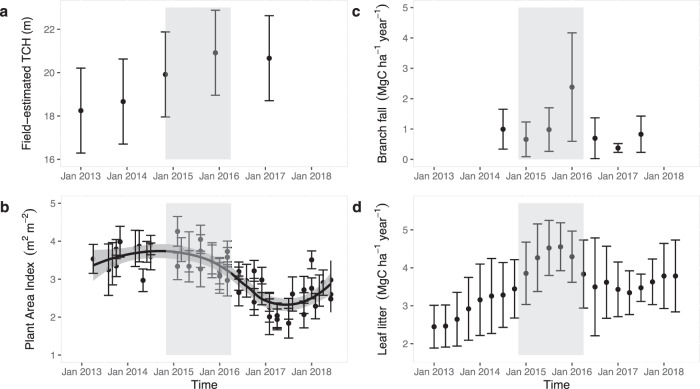
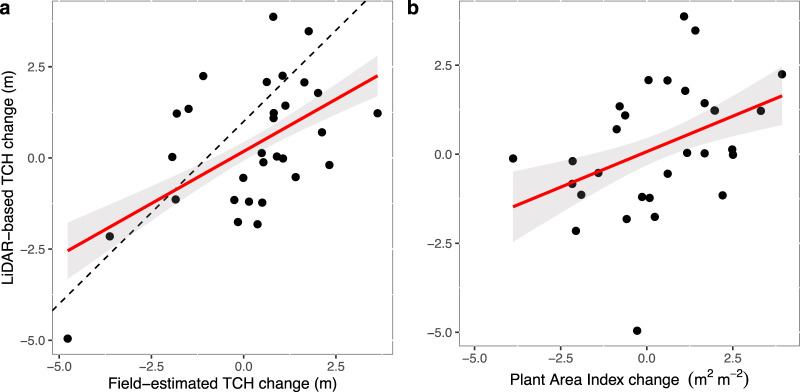
The past 40 years in Southeast Asia have seen about 50% of lowland rainforests converted to oil palm and other plantations, and much of the remaining forest heavily logged. Little is known about how fragmentation influences recovery and whether climate change will hamper restoration. Here, we use repeat airborne LiDAR surveys spanning the hot and dry 2015-16 El Niño Southern Oscillation event to measure canopy height growth across 3,300 ha of regenerating tropical forests spanning a logging intensity gradient in Malaysian Borneo. We show that the drought led to increased leaf shedding and branch fall. Short forest, regenerating after heavy logging, continued to grow despite higher evaporative demand, except when it was located close to oil palm plantations. Edge effects from the plantations extended over 300 metres into the forests. Forest growth on hilltops and slopes was particularly impacted by the combination of fragmentation and drought, but even riparian forests located within 40 m of oil palm plantations lost canopy height during the drought. Our results suggest that small patches of logged forest within plantation landscapes will be slow to recover, particularly as ENSO events are becoming more frequent.


Conflict of interest statement

The authors declare no competing interests.

Figures

Fig. 1
Fig. 1. Reduced precipitation and increased temperatures and vapour pressure deficit during the 2015–2016 ENSO event.
Changes in climatic variables between 2013 and 2018 with the period between both LiDAR surveys (November 2014–April 2016) which were coincident with the ENSO event highlighted in light grey. a The running 30-day precipitation at the SAFE project in Northern Malaysian Borneo (mm) with 2191 grey points showing daily values in each month and a solid black line representing a cubic smoothing spline with 95% confidence intervals as the shaded area. b Mean daily local air temperature (in °C) and c mean daily vapour pressure deficit (VPD) computed from 939,388 relative humidity (RH, in %) measurements recorded within 129 permanent forest plots across old-growth and logged forests with shaded areas representing the 95% confidence intervals. VPD is the difference between how much moisture the air can hold before becoming saturated and the amount of moisture present in the air.
Fig. 2
Fig. 2. The 2015–2016 ENSO effects on canopy properties measured in the field.
Time series of a top-of-canopy height (TCH), b plant area index, c branch fall and d mean leaf fall measured in forest inventory plots between 2013 and 2018. The period between LiDAR surveys, shown in grey, coincided with the ENSO event. Means with 95% confidence intervals are shown.
Fig. 3
Fig. 3. Correlation between LiDAR-derived and field-estimated change in canopy structure during the 2016–2015 ENSO event.
LiDAR-based top-of-canopy height (TCH) change (m) versus a field-estimated TCH change (m) and b plant area index (PAI) change (m2 m−2) between November 2014 and February 2017 from 38 permanent forest inventory plots (SAFE plots, each 25 × 25 m in size). Black dots represent the permanent plots (and missing plots are due to the presence of clouds during the first and/or second flights). The red lines represent values predicted by multiple linear regression, with the shaded grey area depicting the 95% confidence intervals.
Fig. 4
Fig. 4. Correlation between canopy height and forest plot dynamics rates.
The effects of a basal area (BA) loss arising from stem mortality and b basal area growth on the field-estimated top-of-canopy height from 38 permanent forest inventory plots (SAFE plots, each 25 × 25 m in size). Black dots represent the permanent plots (and missing plots are due to the presence of clouds during the first and/or second flights). The red lines represent predicted values from multiple linear regression (i.e. field-estimated TCH change = β0 + β1 BA mortality + β2 BA growth) with 95% confidence intervals shown in grey.
Fig. 5
Fig. 5. Fragmentation and topographic effects on canopy height change during the 2015–2016 ENSO event.
Predicted effects of distance from oil palm plantations and topographic position (TPI) on canopy height growth, obtained by fitting nonlinear models with a spatial autocorrelation structure. The solid black curves are predictions based on median parameter values obtained by fitting models to 24 subsets of the dataset, each composed of 5000 measurements; 95% confidence intervals are based on uncertainty in those parameter estimates (see Supplementary Methods 7 and 12 for details). Predictions are shown for short, medium and tall canopies, with initial heights of 5, 20, and 35 m.

References

    1. Le Quéré C, et al. Global Carbon Budget 2018. Earth Syst. Sci. Data. 2018;10:2141–2194. doi: 10.5194/essd-10-2141-2018. - DOI
    1. Cook-Patton SC, et al. Mapping carbon accumulation potential from global natural forest regrowth. Nature. 2020;585:545–550. doi: 10.1038/s41586-020-2686-x. - DOI - PubMed
    1. Houghton RA, Byers B, Nassikas AA. A role for tropical forests in stabilizing atmospheric CO2. Nat. Clim. Chang. 2015;5:1022–1023. doi: 10.1038/nclimate2869. - DOI
    1. Chazdon RL, et al. Carbon sequestration potential of second-growth forest regeneration in the Latin American tropics. Sci. Adv. 2016;2:e1501639. doi: 10.1126/sciadv.1501639. - DOI - PMC - PubMed
    1. Philipson CD, et al. Active restoration accelerates the carbon recovery of human-modified tropical forests. Science. 2020;369:838–841. doi: 10.1126/science.aay4490. - DOI - PubMed

Publication types

LinkOut - more resources