. 2021 Mar 9;12(1):1540.
doi: 10.1038/s41467-021-21795-z.

Comprehensive single-cell sequencing reveals the stromal dynamics and tumor-specific characteristics in the microenvironment of nasopharyngeal carcinoma

Affiliations

Comprehensive single-cell sequencing reveals the stromal dynamics and tumor-specific characteristics in the microenvironment of nasopharyngeal carcinoma

Lanqi Gong et al. Nat Commun. .

Abstract

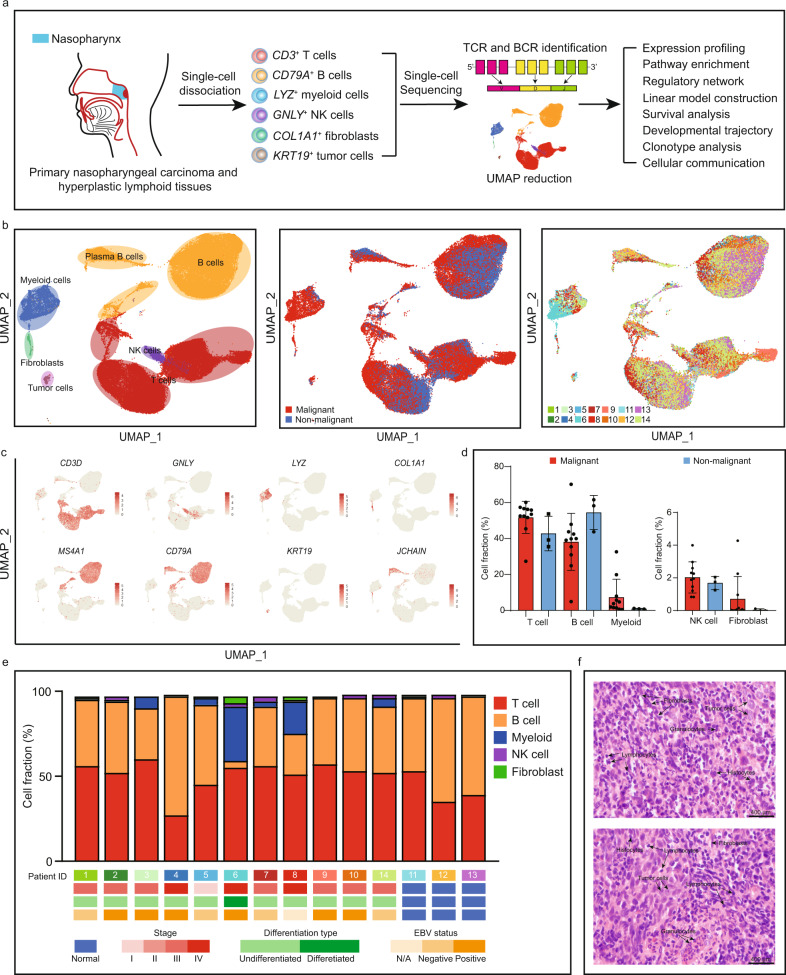
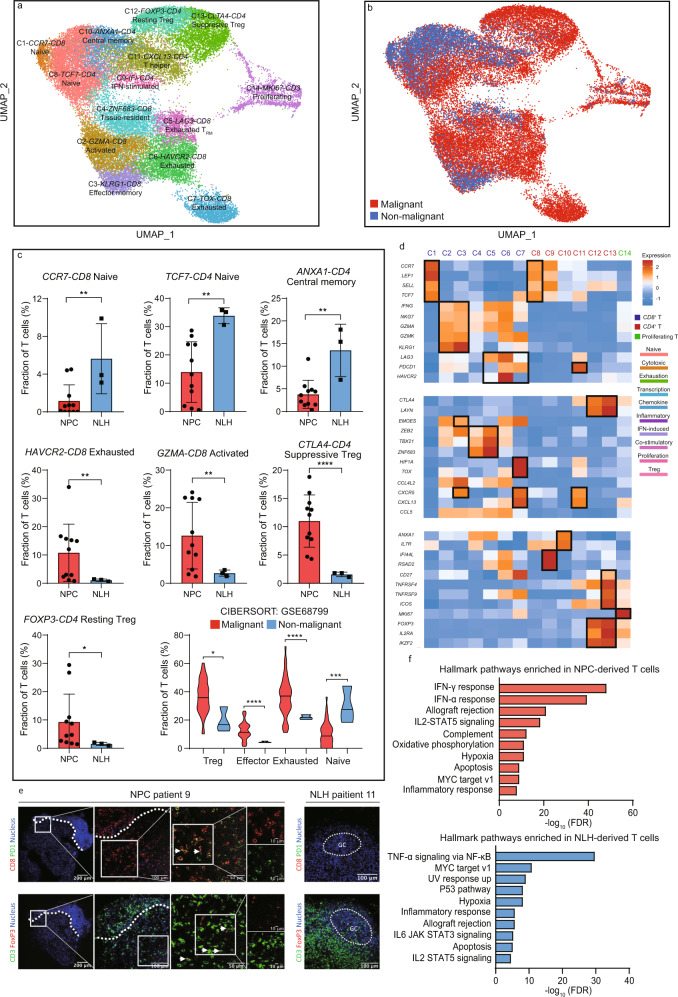
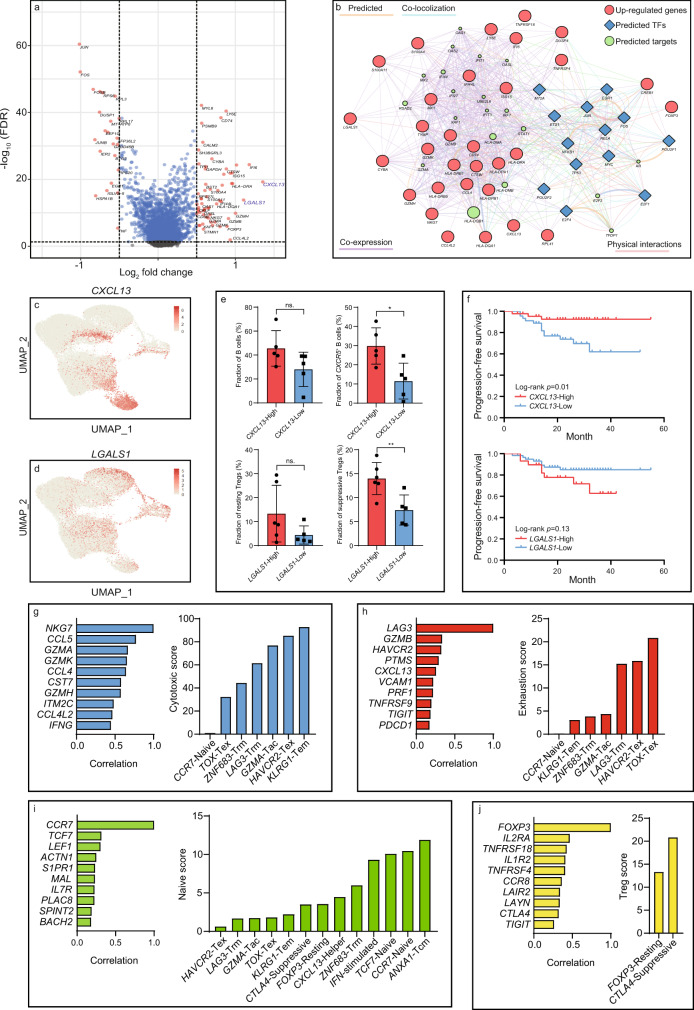
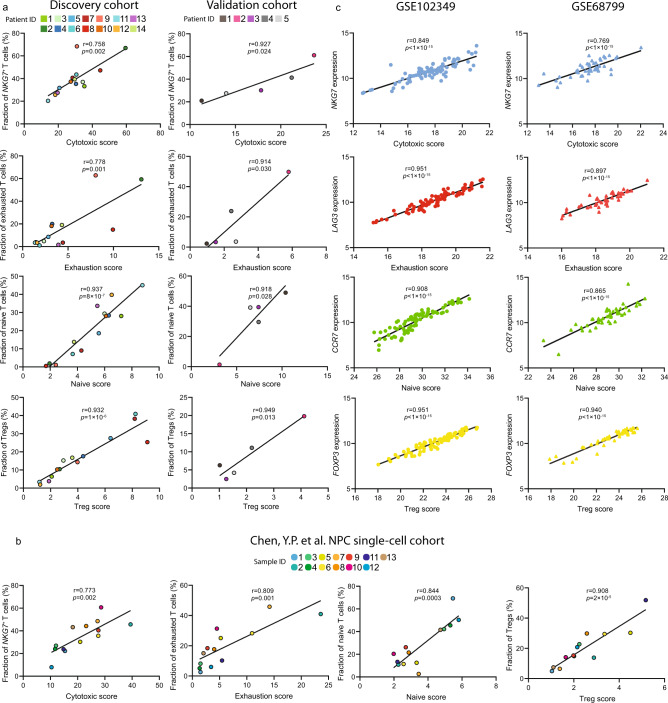
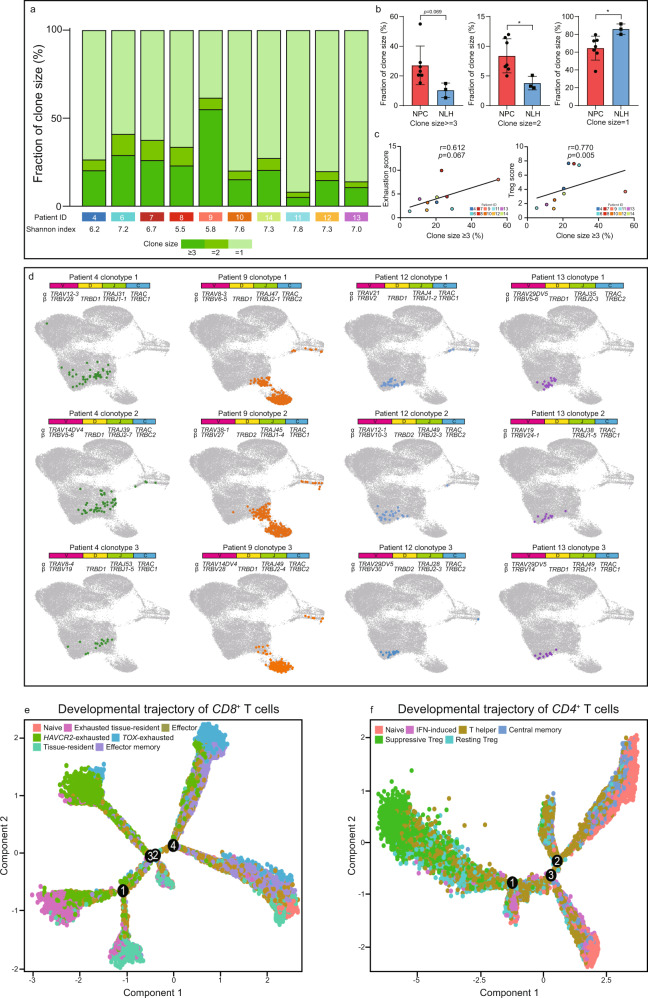
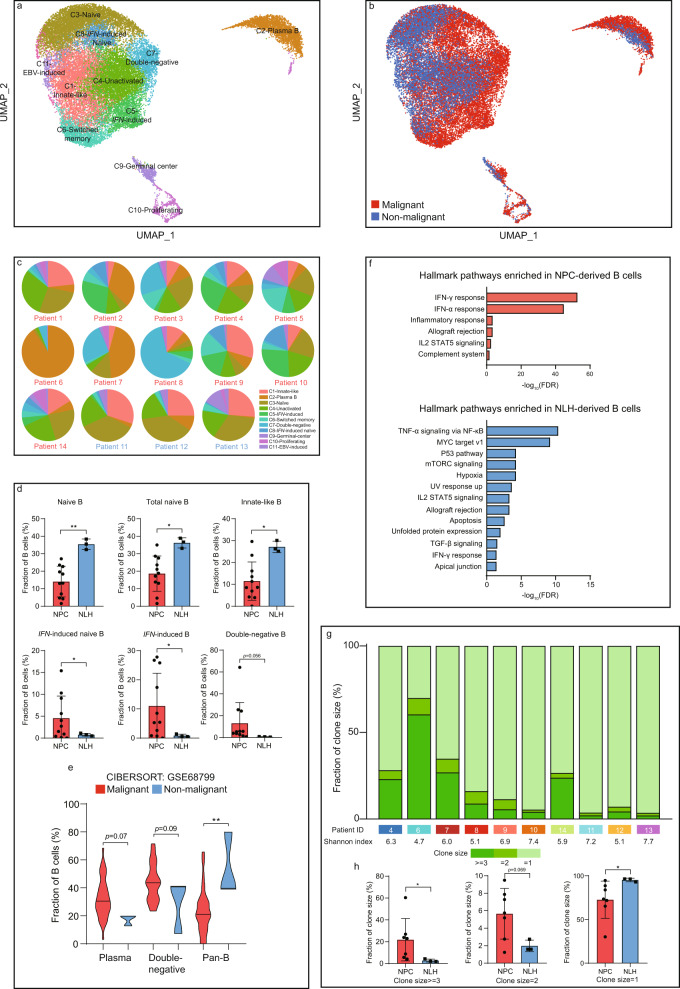
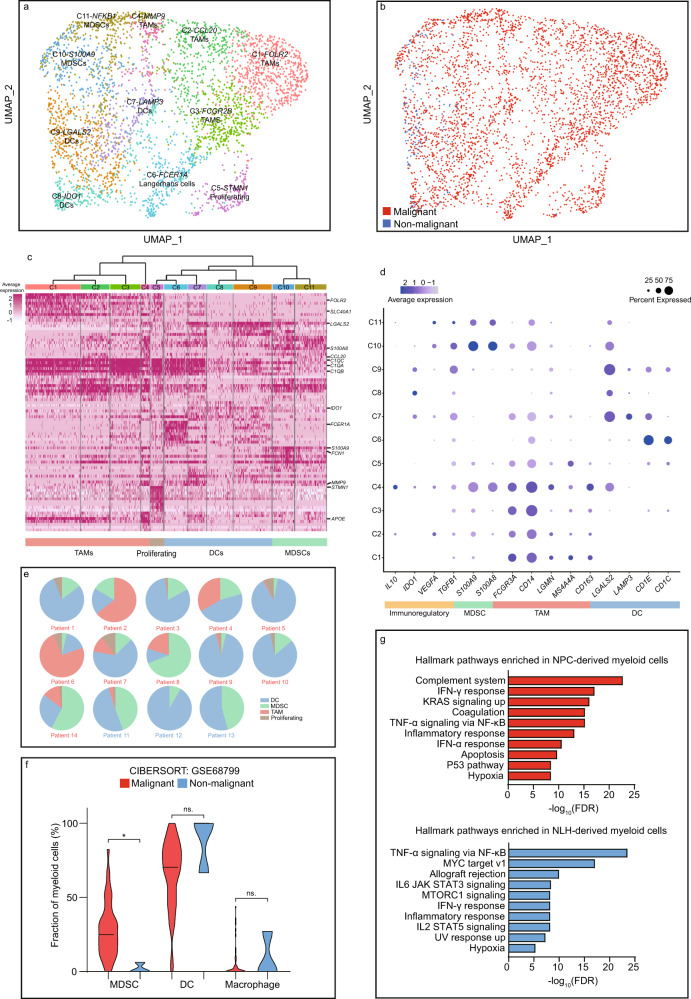
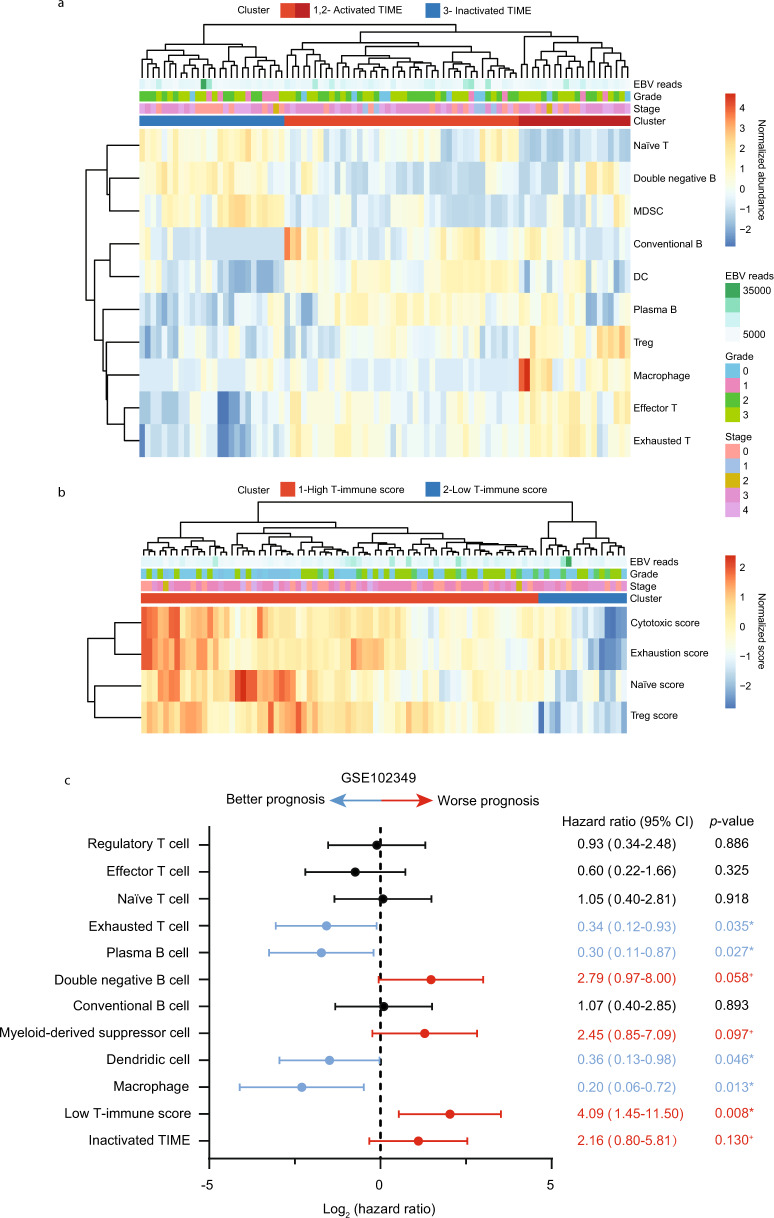
The tumor microenvironment (TME) of nasopharyngeal carcinoma (NPC) harbors a heterogeneous and dynamic stromal population. A comprehensive understanding of this tumor-specific ecosystem is necessary to enhance cancer diagnosis, therapeutics, and prognosis. However, recent advances based on bulk RNA sequencing remain insufficient to construct an in-depth landscape of infiltrating stromal cells in NPC. Here we apply single-cell RNA sequencing to 66,627 cells from 14 patients, integrated with clonotype identification on T and B cells. We identify and characterize five major stromal clusters and 36 distinct subpopulations based on genetic profiling. By comparing with the infiltrating cells in the non-malignant microenvironment, we report highly representative features in the TME, including phenotypic abundance, genetic alternations, immune dynamics, clonal expansion, developmental trajectory, and molecular interactions that profoundly influence patient prognosis and therapeutic outcome. The key findings are further independently validated in two single-cell RNA sequencing cohorts and two bulk RNA-sequencing cohorts. In the present study, we reveal the correlation between NPC-specific characteristics and progression-free survival. Together, these data facilitate the understanding of the stromal landscape and immune dynamics in NPC patients and provides deeper insights into the development of prognostic biomarkers and therapeutic targets in the TME.


Conflict of interest statement

The authors declare no competing interests.

Figures

Fig. 1
Fig. 1. The landscape of the microenvironment in nasopharyngeal carcinoma and nasopharyngeal lymphoid hyperplasia at a single-cell resolution.
a Graphical summary of the experimental design. Stromal cells and cancer cells from the NPC and NLH patients were collected and processed by single-cell 5’ RNA sequencing for transcriptomics analysis and coupled V(D)J sequencing for clonal profiling on T and B cells. b UMAP plot of 66,627 cells showing the components in the NPC and NLH microenvironment, color-coded by the major cell lineage (left), sample type (middle) and corresponding patient (right). c The expression of marker genes for the major lineages defined in a. d The relative abundance of the major cell lineages in the malignant (n = 11 biologically independent samples) and non-malignant (n = 3 biologically independent samples) microenvironment. Data are presented as mean values ± SD. e The fraction of major cell lineages originating from the 14 patients, with their clinical information. Source data are provided as a Source Data file. f The representative H&E staining images (400×) taken from two NPC patients, showing the high stromal infiltration in the NPC microenvironment. Scale bar = 400 µm.
Fig. 2
Fig. 2. Enrichment of exhausted and immunosuppressive T cell phenotype is a tumor-specific characteristic in the NPC microenvironment.
a UMAP plot of 32,656 T cells from 14 patients, identifying 14 subpopulations. Each dot represents one single cell, color-coded by the cluster. b UMAP plot of 32,656 T cells from the NPC microenvironment and NLH microenvironment. Each dot represents one single cell, color-coded by the sample type. c The relative abundance of significantly enriched T cell subpopulations in the malignant (For single-cell data, n = 11 biologically independent samples; for CIBERSORTx estimation, n = 42 biologically independent samples) and non-malignant (For single-cell data, n = 3 biologically independent samples; for CIBERSORTx estimation, n = 3 biologically independent samples) microenvironment. Each dot represents one patient. The two-sided Student’s t test was used to determine the statistical significance. p values ≤ 0.05 were represented as *, ≤0.01 as **, ≤0.001 as ***, ≤0.0001 as ****. Data are presented as mean values ± SD. Source data are provided as a Source Data file. d The normalized average expression of functional signatures for T cells subpopulations defined in a. e Infiltration of exhausted CD8+ T cells and Treg in the NPC and NLH microenvironment. Representative images of PD1+ CD8+ T cells and FOXP3+ Treg cells in the NPC patient 9 (white arrows). The left photo shows a low magnification overview (×100); the right photo shows the boxed area in the left photo. Representative images of expression of PD1 (FITC) on CD8+ T cells (TRITC, white arrow) and FOXP3 (TRITC) on CD3+ T cells (FITC) in NLH patient 11 (original magnification, ×200). GC, germinal center. Three independent experiments were performed and generated similar results. f The GSEA hallmark pathways enriched in the NPC-derived and NLH-derived T cells, ordered by -log10 false discovery rate (FDR).
Fig. 3
Fig. 3. Identification of NPC-specific T cell signatures and characterization of their correlations to patient prognosis and T cell dynamics.
a The differentially expressed genes (log2 fold change ≥0.5, FDR ≤ 5 × 10−2) in NPC-derived and NLH-derived T cells identified by the MAST analysis. b The gene regulatory network constructed by Cytoscape, colored for the associated gene type (red: top 30 upregulated genes from NPC-derived T cells, blue: the upstream transcription factors predicted by RegNetwork, green: the targeted genes predicted by GeneMANIA). c The expression of CXCL13 in each T cell profiled on the UMAP. d The expression of LGALS1 in each T cell profiled on the UMAP. e The total B cell fraction and CXCR5+ B cell fraction in CXCL13-high (n = 5 biologically independent samples) and CXCL13-low groups (n = 5 biologically independent samples); The resting Treg fraction and suppressive Treg faction in LGALS1-high (n = 6 biologically independent samples) and LGALS1-low groups (n = 5 biologically independent samples). Each dot represents one patient. The two-sided Student’s t-test was used to determine the statistical significance, p-values >0.05 were represented as ns. (not significant), p values ≤ 0.05 were represented as *, ≤0.01 as **. Data are presented as mean values ± SD. f The progression-free survival for 88 NPC patients, stratified for the normalized average expression (binary: high expression vs. low expression) of CXCL13 and LGALS1. p values were determined based on the two-sided log-rank test. g The most correlated genes to NKG7 (the representative gene in the cytotoxic module) across cytotoxic T cells and predicted cytotoxic scores for CD8+ subpopulations based on the linear model constructed by this set of genes. h Similar to g but showing the most correlated genes to LAG3 (the representative gene in the exhaustion module) across exhausted T cells and predicted exhaustion scores for CD8+ subpopulations. i The most correlated genes to CCR7 (the representative gene in the naive module) across naïve T cells and predicted naive scores for all T cell subpopulations. j The most correlated genes to FOXP3 (the representative gene in the Treg module) across Tregs and predicted Treg scores for Treg subpopulations. Source data are provided as a Source Data file.
Fig. 4
Fig. 4. Independent validation of the functional modules in bulk RNA sequencing and single-cell RNA sequencing cohorts.
a The Pearson correlation analysis of functional scores (cytotoxic, exhaustion, naïve, and Treg) and the abundance of T cell subpopulations (NKG7+ cytotoxic T cells, exhausted T cells, naïve T cells, and Tregs) in the discovery cohort and validation cohort. b The Pearson’s correlation analysis of functional scores (cytotoxic, exhaustion, naïve, and Treg) and the abundance of T cell subpopulations (NKG7+ cytotoxic T cells, exhausted T cells, naïve T cells, and Tregs) in PY Chen, et al. NPC single-cell cohort. c The Pearson correlation analysis of functional scores and the corresponding genes in two GEO cohorts (GSE102349 and GSE68799), respectively. The two-sided p value for each functional module in GSE102349 and GSE68799 was extremely small (<1 × 10−15), therefore the exact p values cannot be shown in the figure. Source data are provided as a Source Data file.
Fig. 5
Fig. 5. Single-cell V(D)J sequencing reveals the clonal expansion and activation-to-exhaustion transition in exhausted and immunosuppressive T cell subtypes.
a Distribution of T cell clones by size, with different Shannon index showing the clonal diversity for each patient. b The relative abundance of different clone sizes in the NPC-derived (n = 7 biologically independent samples) and NLH-derived (n = 3 biologically independent samples) T cells. Each dot represents one patient. The two-sided Student’s t test was used to determine the statistical significance, p values ≤ 0.05 were represented as *, ≤0.01 as **, ≤0.001 as ***, ≤0.0001 as ****. Data are presented as mean values ± SD. c The Spearman’s correlation between the calculated exhaustion score/Treg score and the fraction of clones with ≥3 cells in patients. Source data are provided as a Source Data file. d UMAP plot of the top three largest clones in patients 4, 9 (NPC) and 12, 13 (NLH), with their associated clonotypes. (e and f) The developmental trajectory of CD8+ and CD4+ T cells, colored-coded by the associated cell subpopulations and numbered by different developmental branches.
Fig. 6
Fig. 6. Clonal expansion and enrichment of immune-activated and IFN-associated B cells is a tumor-specific characteristic in the NPC microenvironment.
a UMAP plot of 27,506 B cells, color-coded by the associated cluster. b UMAP plot of 27,506 B cells, color-coded by the sample type. c The inter-patient distribution of B cell subpopulations, shown by the percentage of total B cells. d The relative abundance of significantly enriched subpopulations in the NPC (n = 11 biologically independent samples) and NLH (n = 3 biologically independent samples) microenvironment. Each dot represents one patient. The two-sided Student’s t test was used to determine the statistical significance, p values ≤0.05 were represented as *, ≤0.01 as **. Data are presented as mean values ±SD. e The estimated abundance of selected B cell subpopulations via CIBERSORTx in the NPC patients (n = 42 biologically independent samples) and normal patients (n = 3 biologically independent samples). The two-sided Student’s t test was used to determine the statistical significance, p values ≤ 0.05 were represented as *, ≤0.01 as **. f The GSEA hallmark pathways enriched in NPC-derived and NLH-derived B cells, ordered by -log10 FDR. (g) Distribution of B cell clones by size, with different Shannon index showing the clonal diversity for each patient. h The relative abundance of different clone sizes in the NPC-derived (n = 7 biologically independent samples) and NLH-derived (n = 3 biologically independent samples) B cells. Each dot represents one patient. The two-sided Student’s t test was used to determine the statistical significance, p values ≤ 0.05 were represented as *. Data are presented as mean values ± SD. Source data are provided as a Source Data file.
Fig. 7
Fig. 7. The NPC microenvironment harbors suppressive myeloid subtypes with high patient-specific heterogeneity.
a UMAP plot of 3,671 myeloid cells, color-coded by the associated cluster. b UMAP plot of 3,671 myeloid cells, color-coded by the sample type. c The expression matrix containing the top 50 enriched genes in each subpopulation defined in a, with a clustering tree categorizing related subpopulations into major subtypes. d The expression of functional signatures that were used to identified and characterized the subpopulations. e The inter-patient distribution of major myeloid subpopulations, shown by the percentage of total myeloid cells. f The estimated abundance of major myeloid subpopulations via CIBERSORTx (malignant n = 42 biologically independent samples, non-malignant n = 3 biologically independent samples). The two-sided Student’s t test was used to determine the statistical significance, p values > 0.05 were represented as ns. (not significant), p values ≤ 0.05 were represented as *. g The GSEA hallmark pathways enriched in NPC-derived and NLH-derived myeloid cells, ordered by −log10 FDR. Source data are provided as a Source Data file.
Fig. 8
Fig. 8. Deconvolution analysis and functional modules reveal dynamic immune signatures that are associated with patient prognosis.
a Heatmap of the normalized immune abundance and clinical parameters in 88 NPC patients estimated by CIBERSORTx. Patients were clustered into three groups, representing those with activated TIME (cluster 1 and 2) or inactivated TIME (cluster 3). b Heatmap of the normalized functional scores and clinical parameters in 88 NPC patients calculated by our linear model. Patients were clustered into two groups, representing those with high T-immune score (cluster) or low T-immune score (cluster 2). c The correlation between estimated subpopulations, patient clusters and progression-free survival in 88 NPC patients. The log2 hazard ratio and the associated p-value was evaluated by the Cox proportional hazards model with 95% CI. p values ≤ 0.05 were considered statistically significant in prognosis, whereas p value > 0.05 and ≤ 0.15 were considered marginally significant in prognosis and represented as +. Source data are provided as a Source Data file.
Fig. 9
Fig. 9. Single-cell referenced communication analysis exhibits tumor-specific ligand–receptor interactions within T and B cell subpopulations.
a The cell-cell communications within major T and B cell subpopulations in the NPC microenvironment and NLH microenvironment, shown by chord diagram, colored by cell subtypes. The size of the arc represented the total number of ligand–receptor pairs, and the size of the flow represented the number of ligand-receptor pairs between two cell subtypes. b Overview of selected ligand-receptor interactions between resting Treg/suppressive Treg and functional T cell subpopulations, c between HAVCR2 exhausted T cells/TOX exhausted T cells and all B cell subpopulations. p values were calculated using the two-sided Student’s t test with 95% CI and refer to the enrichment of the interacting ligand-receptor pair in each of the interacting pairs of cell types. Log2 mean referred to the strength of a specific ligand-receptor connection in the corresponding cell types. d The total number of ligand-receptor pairs in the NPC-derived and NLH-derived T and B subpopulations. Source data are provided as a Source Data file.

References

    1. Chen YP, et al. Nasopharyngeal carcinoma. Lancet. 2019;394:64–80. doi: 10.1016/S0140-6736(19)30956-0. - DOI - PubMed
    1. Jain A, Chia WK, Toh HC. Immunotherapy for nasopharyngeal cancer-a review. Chin. Clin. Oncol. 2016;5:22. doi: 10.21037/cco.2016.03.08. - DOI - PubMed
    1. Chan KCA, et al. Analysis of plasma Epstein-Barr Virus DNA to screen for nasopharyngeal cancer. N. Engl. J. Med. 2017;377:513–522. doi: 10.1056/NEJMoa1701717. - DOI - PubMed
    1. Zhang L, Chen QY, Liu H, Tang LQ, Mai HQ. Emerging treatment options for nasopharyngeal carcinoma. Drug Des. Devel. Ther. 2013;7:37–52. - PMC - PubMed
    1. Lee AWM, et al. A multicenter, phase 3, randomized trial of concurrent chemoradiotherapy plus adjuvant chemotherapy versus radiotherapy alone in patients with regionally advanced nasopharyngeal carcinoma: 10-year outcomes for efficacy and toxicity. Cancer. 2017;123:4147–4157. doi: 10.1002/cncr.30850. - DOI - PubMed

Publication types

MeSH terms