. 2021 Mar 9;12(1):1541.
doi: 10.1038/s41467-021-21858-1.

Tumor-penetrating therapy for β5 integrin-rich pancreas cancer

Affiliations

Tumor-penetrating therapy for β5 integrin-rich pancreas cancer

Tatiana Hurtado de Mendoza et al. Nat Commun. .

Abstract

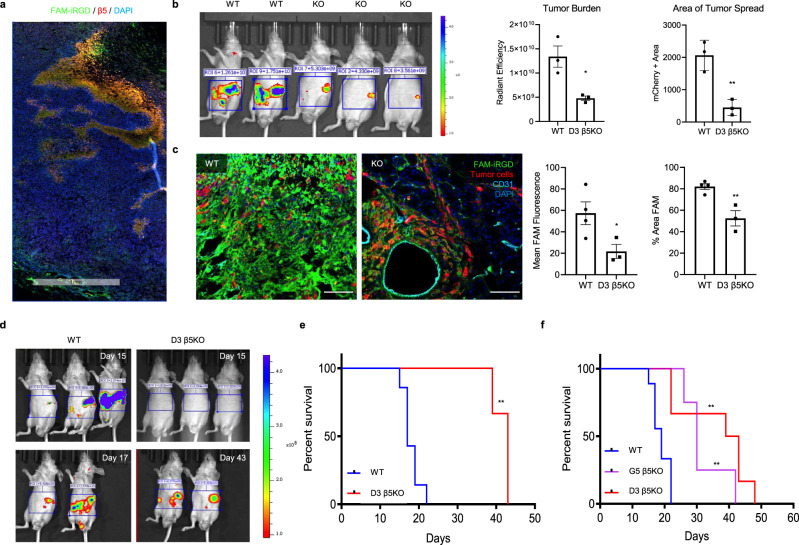
Pancreatic ductal adenocarcinoma (PDAC) is characterized by marked desmoplasia and drug resistance due, in part, to poor drug delivery to extravascular tumor tissue. Here, we report that carcinoma-associated fibroblasts (CAFs) induce β5 integrin expression in tumor cells in a TGF-β dependent manner, making them an efficient drug delivery target for the tumor-penetrating peptide iRGD. The capacity of iRGD to deliver conjugated and co-injected payloads is markedly suppressed when β5 integrins are knocked out in the tumor cells. Of note, β5 integrin knock-out in tumor cells leads to reduced disease burden and prolonged survival of the mice, demonstrating its contribution to PDAC progression. iRGD significantly potentiates co-injected chemotherapy in KPC mice with high β5 integrin expression and may be a powerful strategy to target an aggressive PDAC subpopulation.


Conflict of interest statement

K.N.S., V.R.K., T.T., and E.R. have ownership interest (including patents) in Cend Therapeutics Inc. K.N.S., T.T., and E.R. are also co-founders and stockholders of Cend Therapeutics Inc. E.R. is the chairman of the board of Cend Therapeutics Inc. No potential conflicts of interest were disclosed by the other authors.

Figures

Fig. 1
Fig. 1. iRGD penetrates desmoplastic PDAC.
a–c FAM-iRGD or iRGD-displaying T7 phage was intravenously injected into transgenic p48-CRE, LSL-KrasG12D, INK4aflox mice that develop de novo PDAC. a FAM-iRGD (green) rapidly spreads through ER-TR7-positive stroma (red) in the first 15 min, and start entering ductal structures in full blown PDAC and PanINs in 30 min. Scale bars, 50 µm. b Fluorescent signals of FAM-iRGD (green) in FAP-positive CAFs (red) after 30 min. c iRGD phage (green) penetrated into the PDAC and colocalized with FAP-positive CAFs (red). Scale bars (b and c), 50 or 20 µm (magnified views). d Longitudinal luminescence imaging of orthotopic PDAC generated with KPC-derived organoids. The organoids were pre-labeled with luciferase. H&E staining of a tumor section is shown. Scale bar, 50 µm. e Representative low magnification image of a tumor section showing the homing of intravenously injected FAM-iRGD (green) to the organoid PDAC. Red, α-SMA. White dotted line, tumor; gray dotted lines, normal pancreas. Scale bar, 2 mm. f, g Low magnification confocal micrographs of the organoid PDAC showing time-dependent spreading of FAM-iRGD (green) in areas rich in FAP-positive CAFs (red; f) and into cancerous ducts surrounded by ER-TR7-positive reticular fibroblasts and fibers (red; g). Scale bars, 50 µm. The bar diagrams show the proportion of FAP-positive CAFs f and cancerous ducts g positive for FAM-iRGD signal. The images shown in a–g are representative images from three mice per group; error bars, SEM, statistical analyses, two-tailed unpaired Student’s t test; p = 0.013 (f) and p = 0.0115 (g). Black arrowheads, ducts negative for FAM-iRGD; white arrowheads, ducts positive for FAM-iRGD (a and g). Blue, DAPI. *p < 0.05. Source data provided in Source Data file.
Fig. 2
Fig. 2. iRGD enters CAF spheroids in an αvβ5 integrin-dependent manner.
a Dot plots representing uptake of Alexa 647-labeled iRGD-AgNPs or control AgNPs by mCherry-labeled CAF spheroids. The bar diagram shows the proportion of CAFs that internalized the AgNPs. n = 4 independent experiments. Two-tailed unpaired t test; p = 0.0008. b Dot plots representing iRGD-AgNP uptake by mCherry-labeled CAF spheroids in the presence of anti-NRP-1, αvβ3, or αvβ5 antibodies or control IgG. The bar diagram shows the proportion of CAFs that internalized the AgNPs normalized against IgG. n = 4 (Rabbit IgG and NRP-1), n = 5 (Mouse IgG, αvβ3, and αvβ5) independent experiments. One-way ANOVA; p = 0.4784 (NRP-1 vs. αvβ3), p < 0.0001 (NRP-1 vs. αvβ5 and αvβ3 vs. αvβ5). c Representative confocal images from three independent experiments of GFP-positive hPCF1424 CAFs (green) treated with Alexa 647-labeled iRGD-AgNPs (red) in the presence of mouse IgG (left panels) or an anti-αvβ5 blocking antibody (right panels). The cells were etched to remove the AgNPs bound to the surface and highlight the internalized particles. Pre-etch and post-etch images are shown. Scale bars 100 µm. d Bar diagram showing the % expression of αvβ5 or NRP-1 in hPCF1424 CAFs transiently transfected with non-specific siRNA (NS), two different pools of siRNAs against integrin β5 (ITGb5-1 and -2), or NRP-1 siRNA (siNRP-1), as measured by median fluorescence intensity (left panel). Representative data of three biological replicates. e Bar diagram showing flow cytometric analysis of iRGD-AgNP uptake by the siRNA-treated CAFs in (d). The results are shown as the proportion of CAFs that internalized the AgNPs. n = 3 (NRP-1), n = 5 (ITGb5-1 and -2) independent experiments. One-way ANOVA; p < 0.0001 (NS vs. siITGb5-1 and NS vs. siITGb5-2), p = 0.9997 (NS vs. siNRP-1). All error bars, SEM. ***p < 0.001; ****p < 0.0001. Source data provided in Source Data file.
Fig. 3
Fig. 3. CAFs enhance iRGD entry into tumor cells.
a Flow cytometry analysis showing entry of iRGD-AgNP or control AgNP into spheroids made of PC3 tumor cells alone or PC3 cells mixed with mCherry-labeled hPCF1424 CAFs (co-cult). Note that iRGD-AgNPs entered PC3 cells more efficiently in the presence of CAFs. b Quantified results of (a). Proportion of cells that internalized the particles are shown. n = 5 independent experiments. Two-tailed unpaired t test; p = 0.00015 (PC3 alone vs co-cult), p = 0.0177 (CAF alone vs. co-cult). c Flow cytometry analysis showing the expression of αvβ5 and αvβ3 integrins and NRP-1 in PC3 and CAF spheroids cultured alone (gray bars) or co-cultured with each other (black bars). n = 6 independent experiments. Two-tailed unpaired Student’s t test; p = 0.000325 (αvβ5: PC3 alone vs. co-cult), p = 0.0247 (αvβ5: CAF alone vs. co-cult), p = 0.0158 (αvβ3: PC3 alone vs. co-cult), p = 0.0132 (αvβ3: CAF alone vs. co-cult), p = 0.947 (NRP-1: PC3 alone vs. co-cult), p = 0.055 (CAF alone vs. co-cult). All error bars, SEM. *p < 0.05; ***p < 0.001. Source data provided in Source Data file.
Fig. 4
Fig. 4. CAF conditioned media (CM) enhances αvβ5 expression in tumor cells.
a Expression of αvβ5 integrin in PC3 cells after 2 days of incubation in normal media (NM) or CM prepared from cultured hPCF1424 CAFs (n = 9), mPCFAA0779 CAFs (n = 7), or MIA PaCa-2 human PDAC cells (n = 4) performed in independent experiments. Fold over NM is shown. One-way ANOVA; p < 0.0001 (NM vs. hPCF1424 CM), p = 0.5085 (NM vs. mPCFAA0779 CM), p = 0.9886 (NM vs. MIA PaCa-2). b Dot plots representing iRGD-AgNP or control AgNP uptake in PC3 cells cultured in NM or CM from hPCF1424 CAFs. c The bar diagrams show the proportion of PC3 (left) or LM-PmC (right) cells that internalized iRGD-AgNPs. The cells were incubated in NM or CM from hPCF1424 CAFs for 2 days prior to study. n = 6 (PC3), n = 3 (LM-P) independent experiments. Two-tailed unpaired Student’s t test; p = 0.0001 (PC3 NM vs. CAF CM), p = 0.0127 (LM-P NM vs. CAF CM). d Expression of actin, αv, and β5 integrin mRNAs normalized against cyclophilin A analyzed by qPCR in PC3 cells incubated with NM or CM from hPCF1424 CAFs. n = 3 independent experiments. Two-tailed unpaired Student’s t test; p = 0.00016 (αv), p < 0.0001 (β5), p = 0.923 (actin). e, f Expression of αvβ5 integrin (e) or NRP-1 (f) in PC3 cells cultured in normal media (NM) or CM from hPCF1424 CAFs in the presence or absence of exogenous TGF-β, a TGF-β-specific inhibitor LY2157299, or vehicle alone. Mean fluorescence intensity (MFI) assessed by flow cytometry is shown. n = 4 independent experiments. Two-tailed unpaired Student’s t test; p = 0.0008 (e: NM vs. TGF-β), p = 0.0009 (e: TGF-β vs. TGF-β + LY2157299), p = 0.7082 (e: CAF CM vs. CAF CM + DMSO), p = 0.0177 (e: CAF CM + DMSO vs. CAF CM + LY2157299). No significant differences in (f). All error bars, SEM; *p < 0.05; **p < 0.01; ***p < 0.001; ****p < 0.0001. Source data provided in Source Data file.
Fig. 5
Fig. 5. β5 integrin is critical for iRGD penetration through extravascular tumor tissue.
a Representative confocal image of a tumor section showing in vivo homing of IV FAM-iRGD (green) to β5 integrin-positive areas (red) in a subcutaneous LM-P mouse tumor. Blue, DAPI; scale bar 1 mm. (n = 4 mice). b Mice bearing orthotopic PDAC created with LM-PmC cells (WT, n = 4) or the β5 integrin-deficient D3 clone (KO, n = 3). mCherry signals were detected with an IVIS Spectrum 19 days after tumor implantation. Representative mouse images are shown. Left bar diagram, total tumor burden (radiant efficiency) p = 0.0186; right bar diagram, degree of tumor spreading (mCherry-positive area) p = 0.0061, error bars, SEM, statistical analyses, two-tailed unpaired Student’s t test. c Confocal micrographs showing spreading of IV FAM-iRGD (green) in WT and KO tumors. Red, tumor cells; cyan, CD31; blue, DAPI; scale bars, 50 μm. The mice 19 days after tumor implantation in (b) were used. The mean FAM intensity was measured to quantify the amount of iRGD that homed to the tumor (left bar diagram, p = 0.0473), and % area positive for FAM was used to determine the degree of iRGD spreading (right bar diagram, p = 0.0071). WT (n = 4), β5 KO (n = 3). Two-tailed unpaired Student’s t test. d Mice bearing orthotopic PDAC created with WT LM-PmC cells or the β5-deficient D3 clone were subjected to IVIS imaging. mCherry was detected at the indicated time points. e Kaplan–Meier survival curves of the mice in (d). WT (n = 7), D3 β5 KO (n = 3). Log-rank (Mantel–Cox) test; p = 0.0074, HR = 3.57. f Survival curves of mice bearing orthotopic PDAC created with WT (n = 9) or two different β5 integrin-deficient clones, G5 β5 KO (n = 4) and D3 β5 KO (n = 6). Log-rank (Mantel–Cox) test; p = 0.0026, HR = 3.5 (WT vs. G5 β5 KO); p = 0.0026, HR = 3.1 (WT vs. D3 β5 KO). All error bars, SEM; *p < 0.05; **p < 0.01. Source data provided in Source Data file.
Fig. 6
Fig. 6. iRGD co-injection potentiates co-administered chemotherapy in KPC mice.
a IV delivery of fluorescent dextran by iRGD co-injection to orthotopic PDAC created with LM-PmC cells (WT; n = 5) or the β5 integrin-deficient D3 clone (KO; n = 3) in mice. Two-tailed unpaired Student’s t test; p = 0.002. b Kaplan–Meier survival curve of KPC mice treated with gemcitabine alone (n = 18) or in combination with iRGD (n = 16). Log-rank (Mantel–Cox) test; p = 0.0385, HR = 0.53. c Numbers of metastatic lung (left) and liver (right) nodules identified in the mice from (b). iRGD/Gem (n = 7); Gem (n = 8). Two-tailed unpaired Student’s t test; p = 0.0263 (lung metastasis), p = 0.4 (liver metastasis). d The weight of tumors harvested from KPC mice treated with iRGD + gemcitabine + nab-paclitaxel (n = 14) or gemcitabine + nab-paclitaxel alone (n = 13) for 6 weeks. Two-tailed unpaired Student’s t test; p = 0.0193. All error bars, SEM; *p < 0.05; **p < 0.01. Source data provided in Source Data file.

References

    1. Whatcott CJ, et al. Desmoplasia in primary tumors and metastatic lesions of pancreatic cancer. Clin. Cancer Res. 2015;21:3561–3568. doi: 10.1158/1078-0432.CCR-14-1051. - DOI - PMC - PubMed
    1. Provenzano PP, Hingorani SR. Hyaluronan, fluid pressure, and stromal resistance in pancreas cancer. Br. J. Cancer. 2013;108:1–8. doi: 10.1038/bjc.2012.569. - DOI - PMC - PubMed
    1. Diop-Frimpong B, Chauhan VP, Krane S, Boucher Y, Jain RK. Losartan inhibits collagen I synthesis and improves the distribution and efficacy of nanotherapeutics in tumors. Proc. Natl Acad. Sci. USA. 2011;108:2909–2914. doi: 10.1073/pnas.1018892108. - DOI - PMC - PubMed
    1. Provenzano PP, et al. Enzymatic targeting of the stroma ablates physical barriers to treatment of pancreatic ductal adenocarcinoma. Cancer Cell. 2012;21:418–429. doi: 10.1016/j.ccr.2012.01.007. - DOI - PMC - PubMed
    1. Rhim AD, et al. Stromal elements act to restrain, rather than support, pancreatic ductal adenocarcinoma. Cancer Cell. 2014;25:735–747. doi: 10.1016/j.ccr.2014.04.021. - DOI - PMC - PubMed

Publication types

MeSH terms