. 2021 Mar 22;33(1):85-103.
doi: 10.1093/plcell/koaa006.

Mutation of the imprinted gene OsEMF2a induces autonomous endosperm development and delayed cellularization in rice

Affiliations

Mutation of the imprinted gene OsEMF2a induces autonomous endosperm development and delayed cellularization in rice

Kaoru Tonosaki et al. Plant Cell. .

Abstract

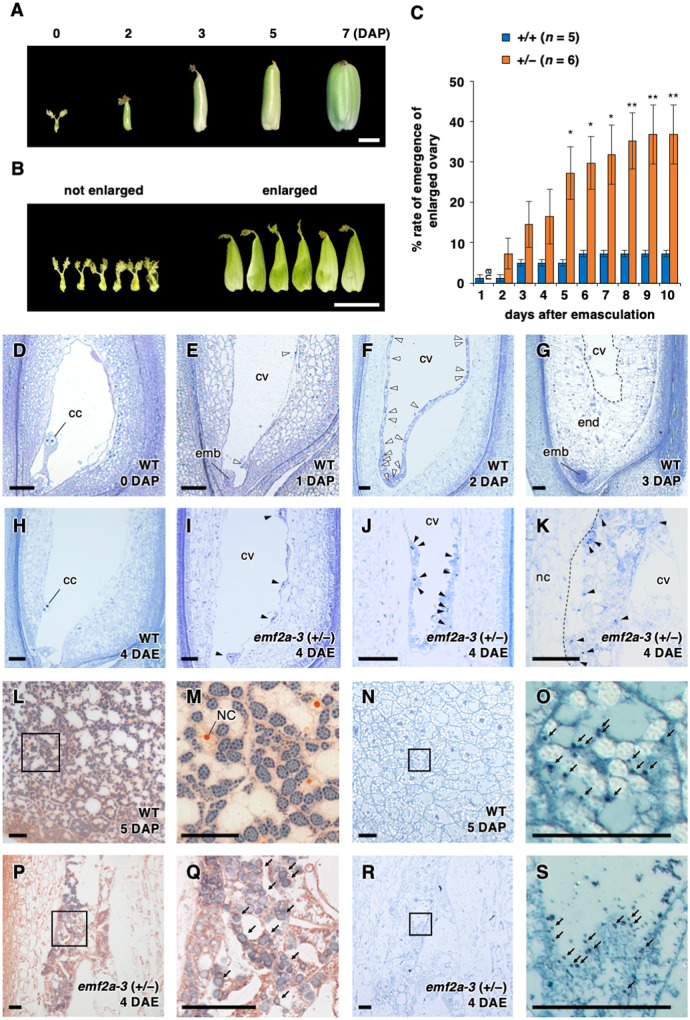
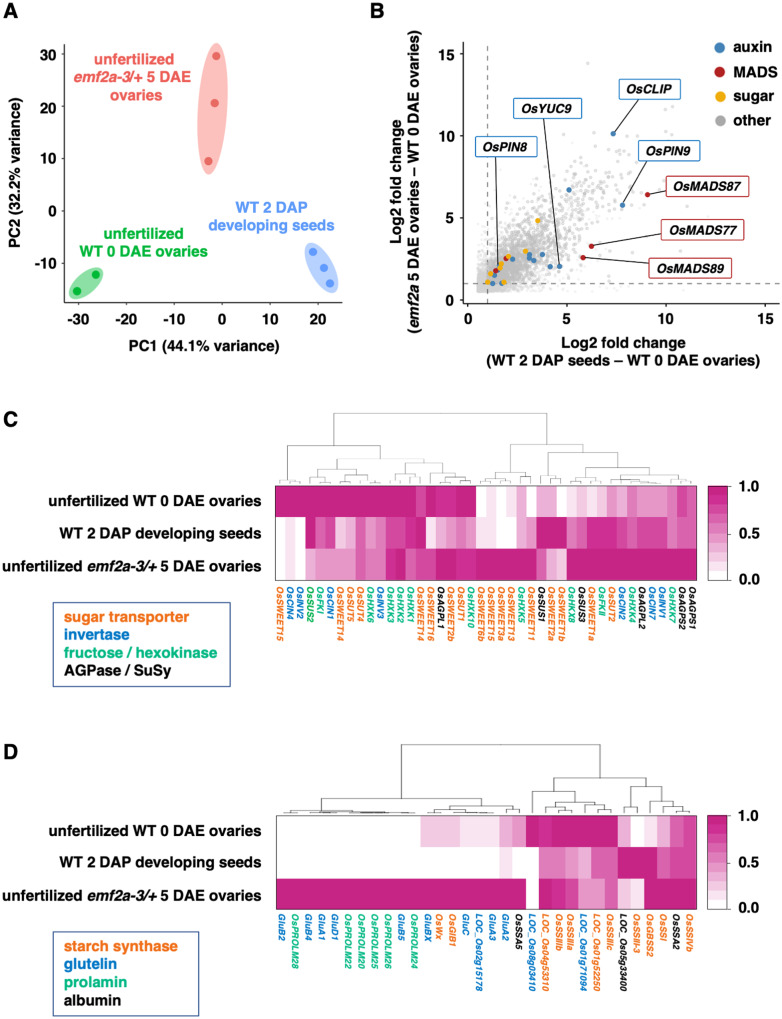
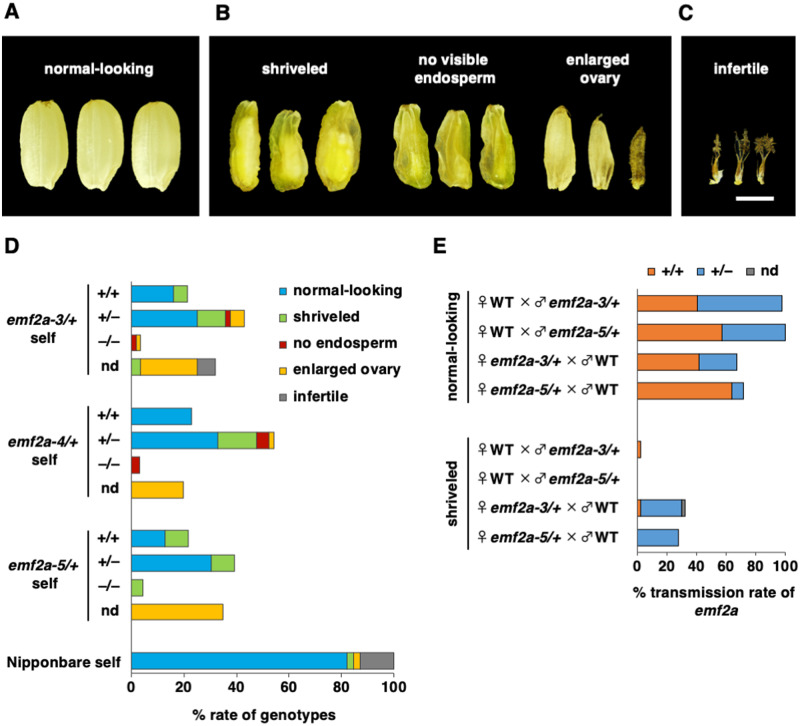
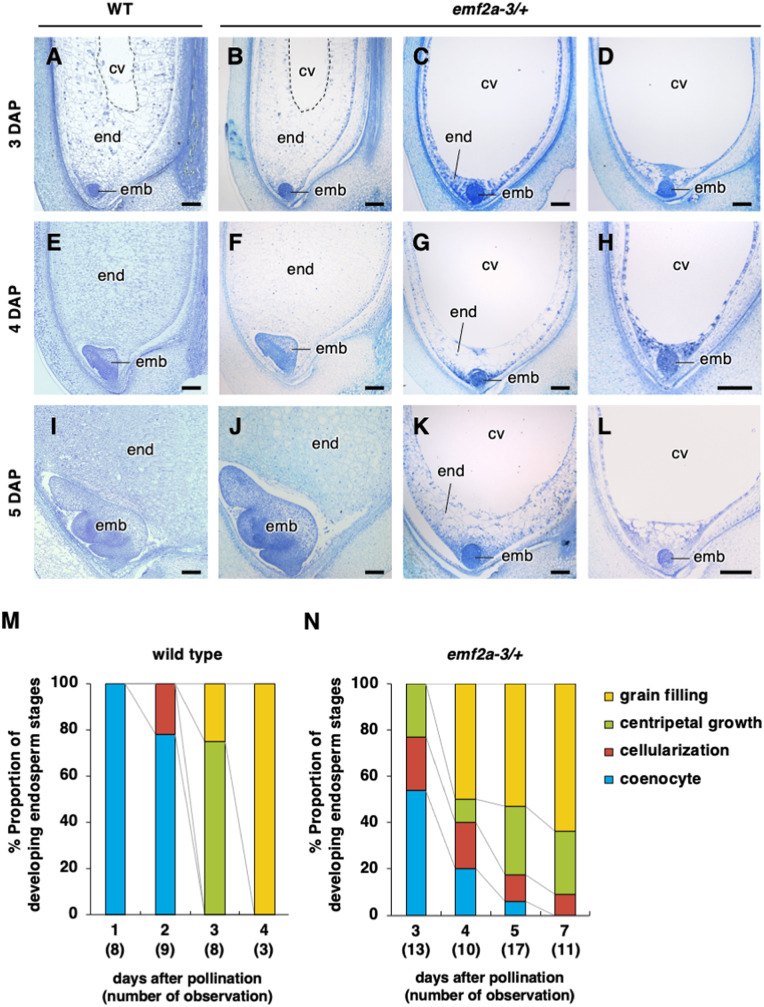
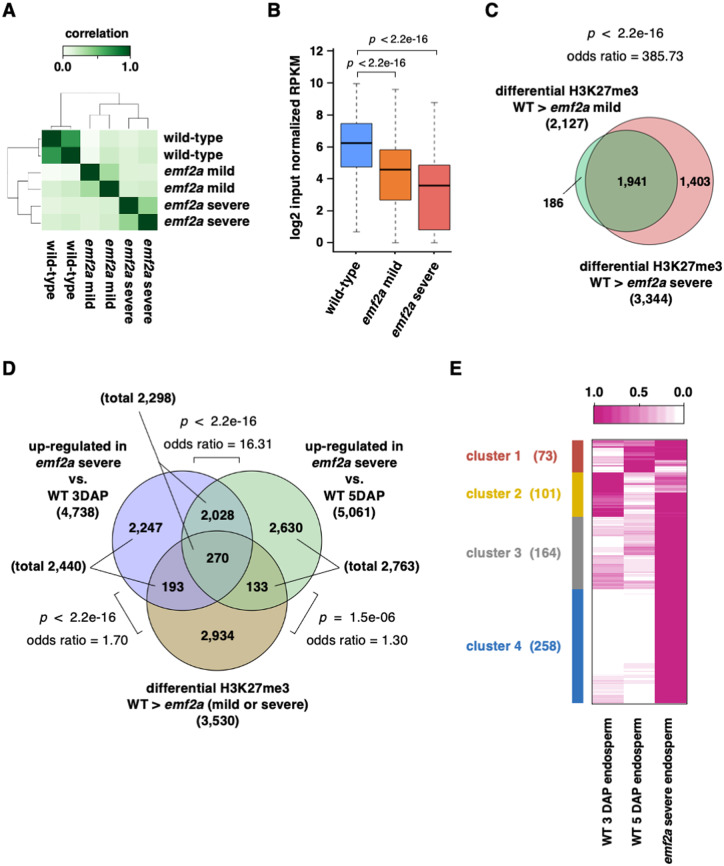
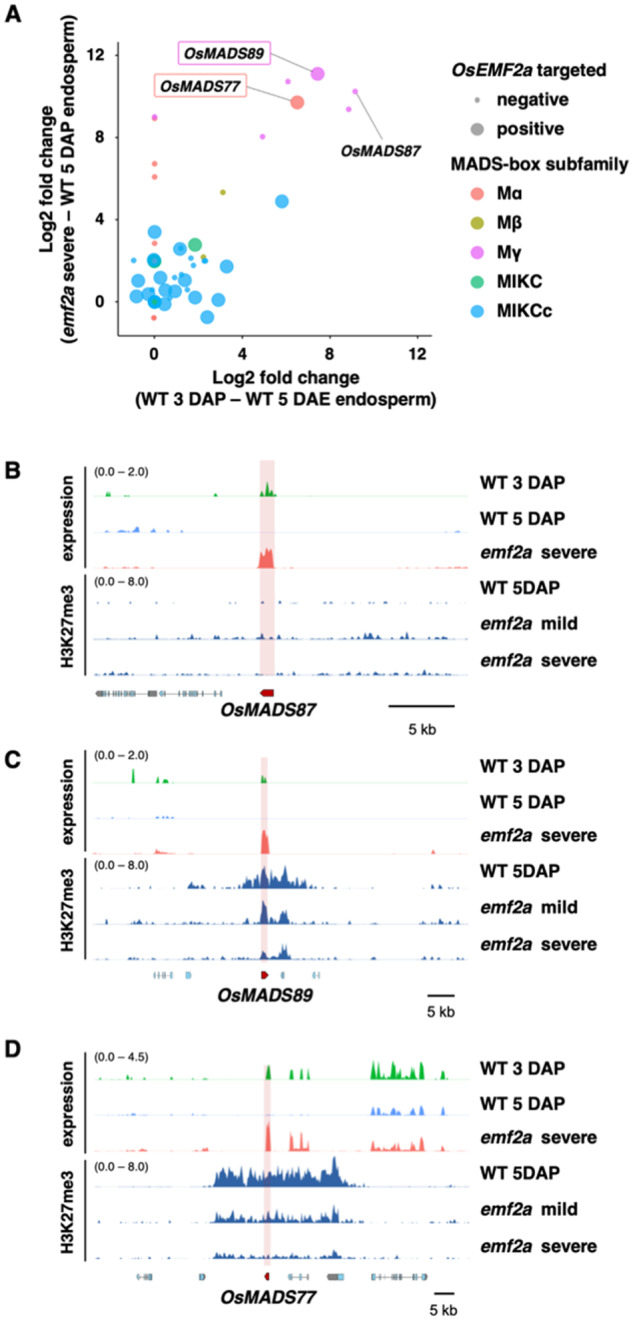
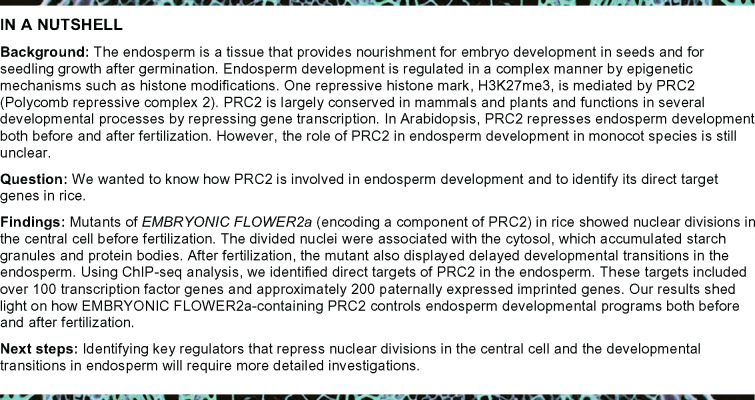
In angiosperms, endosperm development comprises a series of developmental transitions controlled by genetic and epigenetic mechanisms that are initiated after double fertilization. Polycomb repressive complex 2 (PRC2) is a key component of these mechanisms that mediate histone H3 lysine 27 trimethylation (H3K27me3); the action of PRC2 is well described in Arabidopsis thaliana but remains uncertain in cereals. In this study, we demonstrate that mutation of the rice (Oryza sativa) gene EMBRYONIC FLOWER2a (OsEMF2a), encoding a zinc-finger containing component of PRC2, causes an autonomous endosperm phenotype involving proliferation of the central cell nuclei with separate cytoplasmic domains, even in the absence of fertilization. Detailed cytological and transcriptomic analyses revealed that the autonomous endosperm can produce storage compounds, starch granules, and protein bodies specific to the endosperm. These events have not been reported in Arabidopsis. After fertilization, we observed an abnormally delayed developmental transition in the endosperm. Transcriptome and H3K27me3 ChIP-seq analyses using endosperm from the emf2a mutant identified downstream targets of PRC2. These included >100 transcription factor genes such as type-I MADS-box genes, which are likely required for endosperm development. Our results demonstrate that OsEMF2a-containing PRC2 controls endosperm developmental programs before and after fertilization.


Figures

Figure 1
Figure 1
Phenotypes of emf2a/+ ovaries without fertilization. (A) Developing seeds of wild-type plants up to 7 days after pollination (DAP). Scale bar = 2 mm. (B) Two ovary classes, not enlarged (left) and enlarged (right), in emf2a-4/+ plants at 10 days after emasculation (DAE). Scale bar = 5 mm. (C) Rate of emergence of an enlarged ovary at 0–10 DAE in wild-type and emf2a-4/+ plants. Data are means ± se of 5–6 plants at each time point. Asterisks indicate significant differences between different emf2a genotypes (Student’s t-test, *P < 0.05, **P < 0.01). (D–K) Toluidine blue stained thin sections. Fertilized seeds of wild-type at 0–3 DAP (D–G) and enlarged ovaries in wild-type at 4 DAE (H) and in emf2a-3/+ plants at 4 DAE (I–K). Empty and solid arrowheads indicate dividing nuclear cytoplasmic domains in the presence or absence of fertilization, respectively. emb, embryo; end, endosperm; cc, central cell nuclei; cv, central vacuole; nc, nucellus. Scale bars = 50 µm. (L–S) Accumulation of starch grains and protein storage vacuoles in fertilized seeds of wild-type at 5 DAP (L–O) and emf2a-3/+ plants at 4 DAE (P–S). Sections doubly stained with iodine and safranin to detect starch grains and cell walls, respectively (L–M) and (P–Q). Differential interference contrast images of CBB stained thin sections (N–O) and (R–S). The boxed regions in (L), (N), (P), and (R) are enlarged as (M), (O), (Q), and (S), respectively. NC, endosperm nuclei. Arrows indicate stained starch grains or protein storage vacuoles. Scale bars = 50 µm.
Figure 2
Figure 2
Transcriptome analysis of autonomous endosperm development in emf2a-3/+. (A) PCA of variance in normalized read counts for whole transcriptomes in three different libraries prepared from unfertilized wild-type 0 DAE ovaries (green), fertilized wild-type 2 DAP developing seeds without embryos (blue), and unfertilized emf2a-3/+ 5 DAE enlarged ovaries (red), with two or three replicates. The two axes represent the first two principal components (PCs) and the percentages indicate the variance contribution. (B) Scatter plot of commonly upregulated genes in two comparisons: fertilized wild-type 2 DAP developing seeds versus unfertilized wild-type 0 DAE ovaries (X-axis); unfertilized emf2a-3/+ 5 DAE ovaries versus unfertilized wild-type 0 DAE ovaries (Y-axis). Gray points are upregulated genes, and colored points indicate related pathways of gene families for auxin, MADS-box, sugar, and others (detailed information is given in Supplemental Figure 5). The two stippled axes show log2 fold changes in expression of upregulated genes in the two comparisons. (C) and (D) Heatmaps of hierarchical clustering of DEGs that show a higher expression state in unfertilized emf2a-3/+ 5 DAE ovaries with respect to the sugar metabolism pathway (C) and for storage compounds (D). For each gene, the average transcripts per million value normalized by the maximum value of the gene is shown. The different colors of the gene names indicate encoded proteins of each gene.
Figure 3
Figure 3
Parent-of-origin effect of the emf2a mutation during seed development. (A–C) Seed phenotypes at the maturation stage from self-pollinated emf2a-3/+ plants. Phenotypes were categorized as normal-looking (A), three abnormal types (B), and infertile (C). Scale bar = 2 mm. (D) Distribution of each seed phenotype depending on genotype from self-pollination of wild-type plants and plants carrying an emf2a mutation. Y-axis indicates the mutant allele and genotype of self-pollinated seeds. (E) Transmission rate of the emf2a allele in the F1 progeny of reciprocal crosses between wild-type plants and plants carrying either emf2a-3 or emf2a-5. nd, not determined.
Figure 4
Figure 4
Embryo and endosperm development in seeds from self-pollinated wild-type and emf2a-3/+ plants. (A–L) Representative images of seeds of wild-type (A), (E), and (I) and emf2a-3/+ plants (B–D), (F–H), and (J–L) at 3 (A–D), 4 (E–H), and 5 DAP (I–L). Each panel of emf2a-3/+ plants displays wild-type appearance, centripetal growth stage (B) and grain filling stage (F) and (J), and unusual phenotypes, cellularization stage (C), (G), and (K) and coenocytic stage (D), (H), and (L). end, endosperm; emb, embryo; cv, central vacuole. Scale bars = 100 µm. (M) and (N) Proportions of different endosperm developmental stages from self-pollinated wild-type at 1–4 DAP (M) and emf2a-3/+ plants at 3–5, and 7 DAP (N).
Figure 5
Figure 5
Analysis of the OsEMF2a target genes in emf2a endosperm based on transcriptome analysis and H3K27me3 ChIP-seq data. (A) Correlation heatmaps of H3K27me3 enrichment on peak locations detected in three different libraries: wild-type endosperm, emf2a mild endosperm, and emf2a severe endosperm at 5 DAP. (B) Boxplots of H3K27me3 enrichment on significant enrichment peaks for three different samples, showing the median and 25th and 75th percentiles and error bars show the 10th and 90th percentiles. P-values were calculated with Wilcoxon rank-sum test. (C) Venn diagram showing genes with significantly decreased H3K27me3 enrichment in mild or severe emf2a endosperm compared with wild-type, and the overlap between each set of genes. P-value and odds ratio were calculated with Fisher’s exact test. (D) Venn diagram showing overlapping upregulated genes in emf2a endosperm in two comparisons: emf2a 5 DAP versus wild-type 3 DAP endosperm and emf2a 5 DAP versus wild-type 5 DAP endosperm; and overlapping genes with decreased H3K27me3 enrichment in emf2a endosperm compared with wild-type 5 DAP endosperm. P-value and odds ratios were calculated with Fisher’s exact test. (E) Heatmap of k-means clustering of OsEMF2a targeted genes upregulated by emf2a mutation. For each gene, the average transcripts per million value normalized by the maximum value of the gene is shown. The different colored boxes on the left indicate different clusters of genes with similar expression patterns.
Figure 6
Figure 6
Expression and H3K27me3 profiles of MADS-box genes in wild-type and emf2a-3/+ endosperm. (A) Upregulated type-I MADS-box genes in two comparisons (emf2a 5 DAP versus wild-type 5 DAP endosperm and wild-type 3 DAP versus wild-type 5 DAP endosperm). Each MADS-box subfamily is shown by a colored circle. The two axes show log2-fold changes in expression of upregulated genes. OsEMF2a targeted genes are indicated by the size of the closed circle and their gene names are shown in the open boxes. (B–D) Transcription and H3K27me3 enrichment in the vicinity of OsMADS87 (B), OsMADS89 (C), and OsMADS77 (D). The upper three panels indicate the expression levels of log2 bins per kilobase million values of wild-type 3 DAP and 5 DAP endosperm and emf2a 5 DAP endosperm. The lower three panels show H3K27me3 enrichment of wild-type 5 DAP endosperm and emf2a 5 DAP mild and severe endosperm.
None

References

    1. Baroux C, Spillane C, Grossniklaus U (2002) Evolutionary origins of the endosperm in flowering plants. Genome Biol 3: reviews1026 - PMC - PubMed
    1. Baroux C, Gagliardini V, Page DR, Grossniklaus U (2006) Dynamic regulatory interactions of Polycomb group genes: MEDEA autoregulation is required for imprinted gene expression in Arabidopsis. Genes Dev 20: 1081–1086 - PMC - PubMed
    1. Batista RA, Kohler C (2020) Genomic imprinting in plants-revisiting existing models. Genes Dev 34: 24–36 - PMC - PubMed
    1. Batista RA, Figueiredo DD, Santos-Gonzalez J, Köhler C (2019) Auxin regulates endosperm cellularization in Arabidopsis. Genes Dev 33: 466–476 - PMC - PubMed
    1. Beauzamy L, Fourquin C, Dubrulle N, Boursiac Y, Boudaoud A, Ingram G (2016) Endosperm turgor pressure decreases during early Arabidopsis seed development. Development 143: 3295–3299 - PubMed

Publication types

MeSH terms