. 2021 Apr 8;137(14):1905-1919.
doi: 10.1182/blood.2020009088.

miR-15a/16-1 deletion in activated B cells promotes plasma cell and mature B-cell neoplasms

Affiliations

miR-15a/16-1 deletion in activated B cells promotes plasma cell and mature B-cell neoplasms

Tomasz Sewastianik et al. Blood. .

Abstract

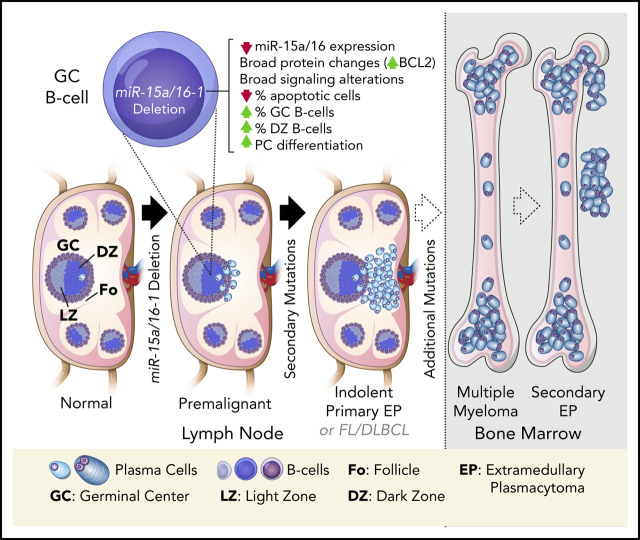
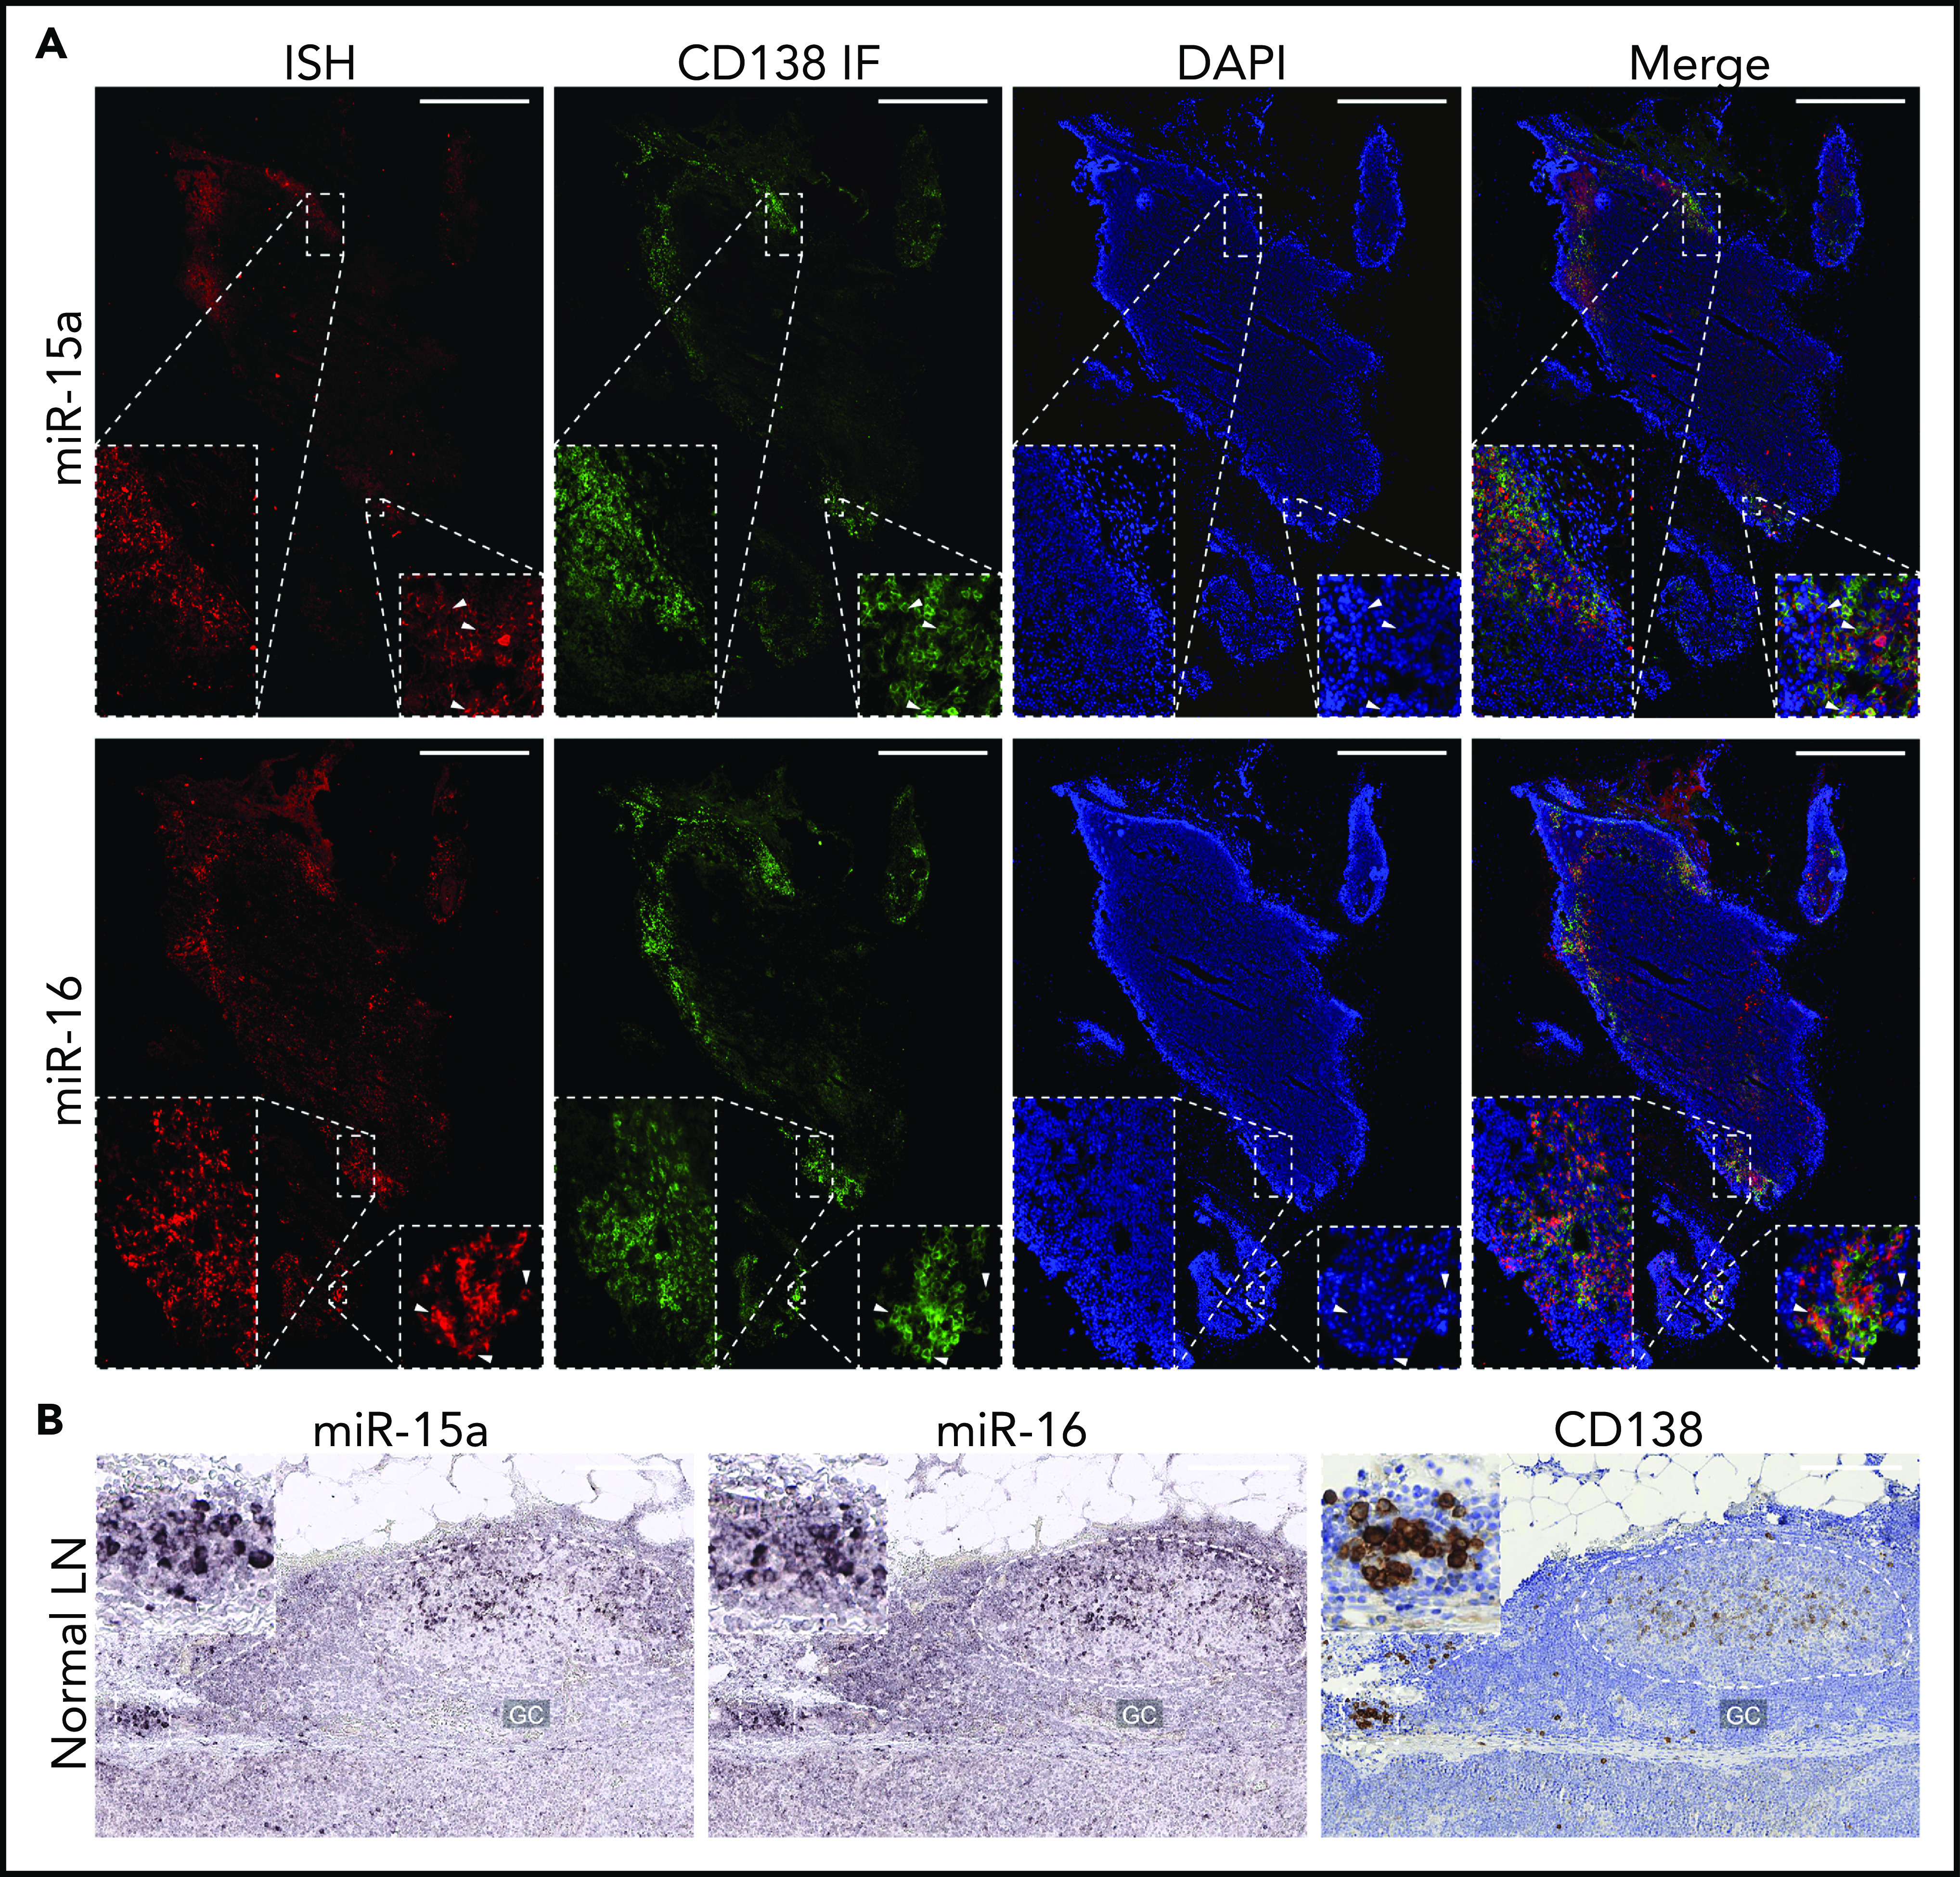
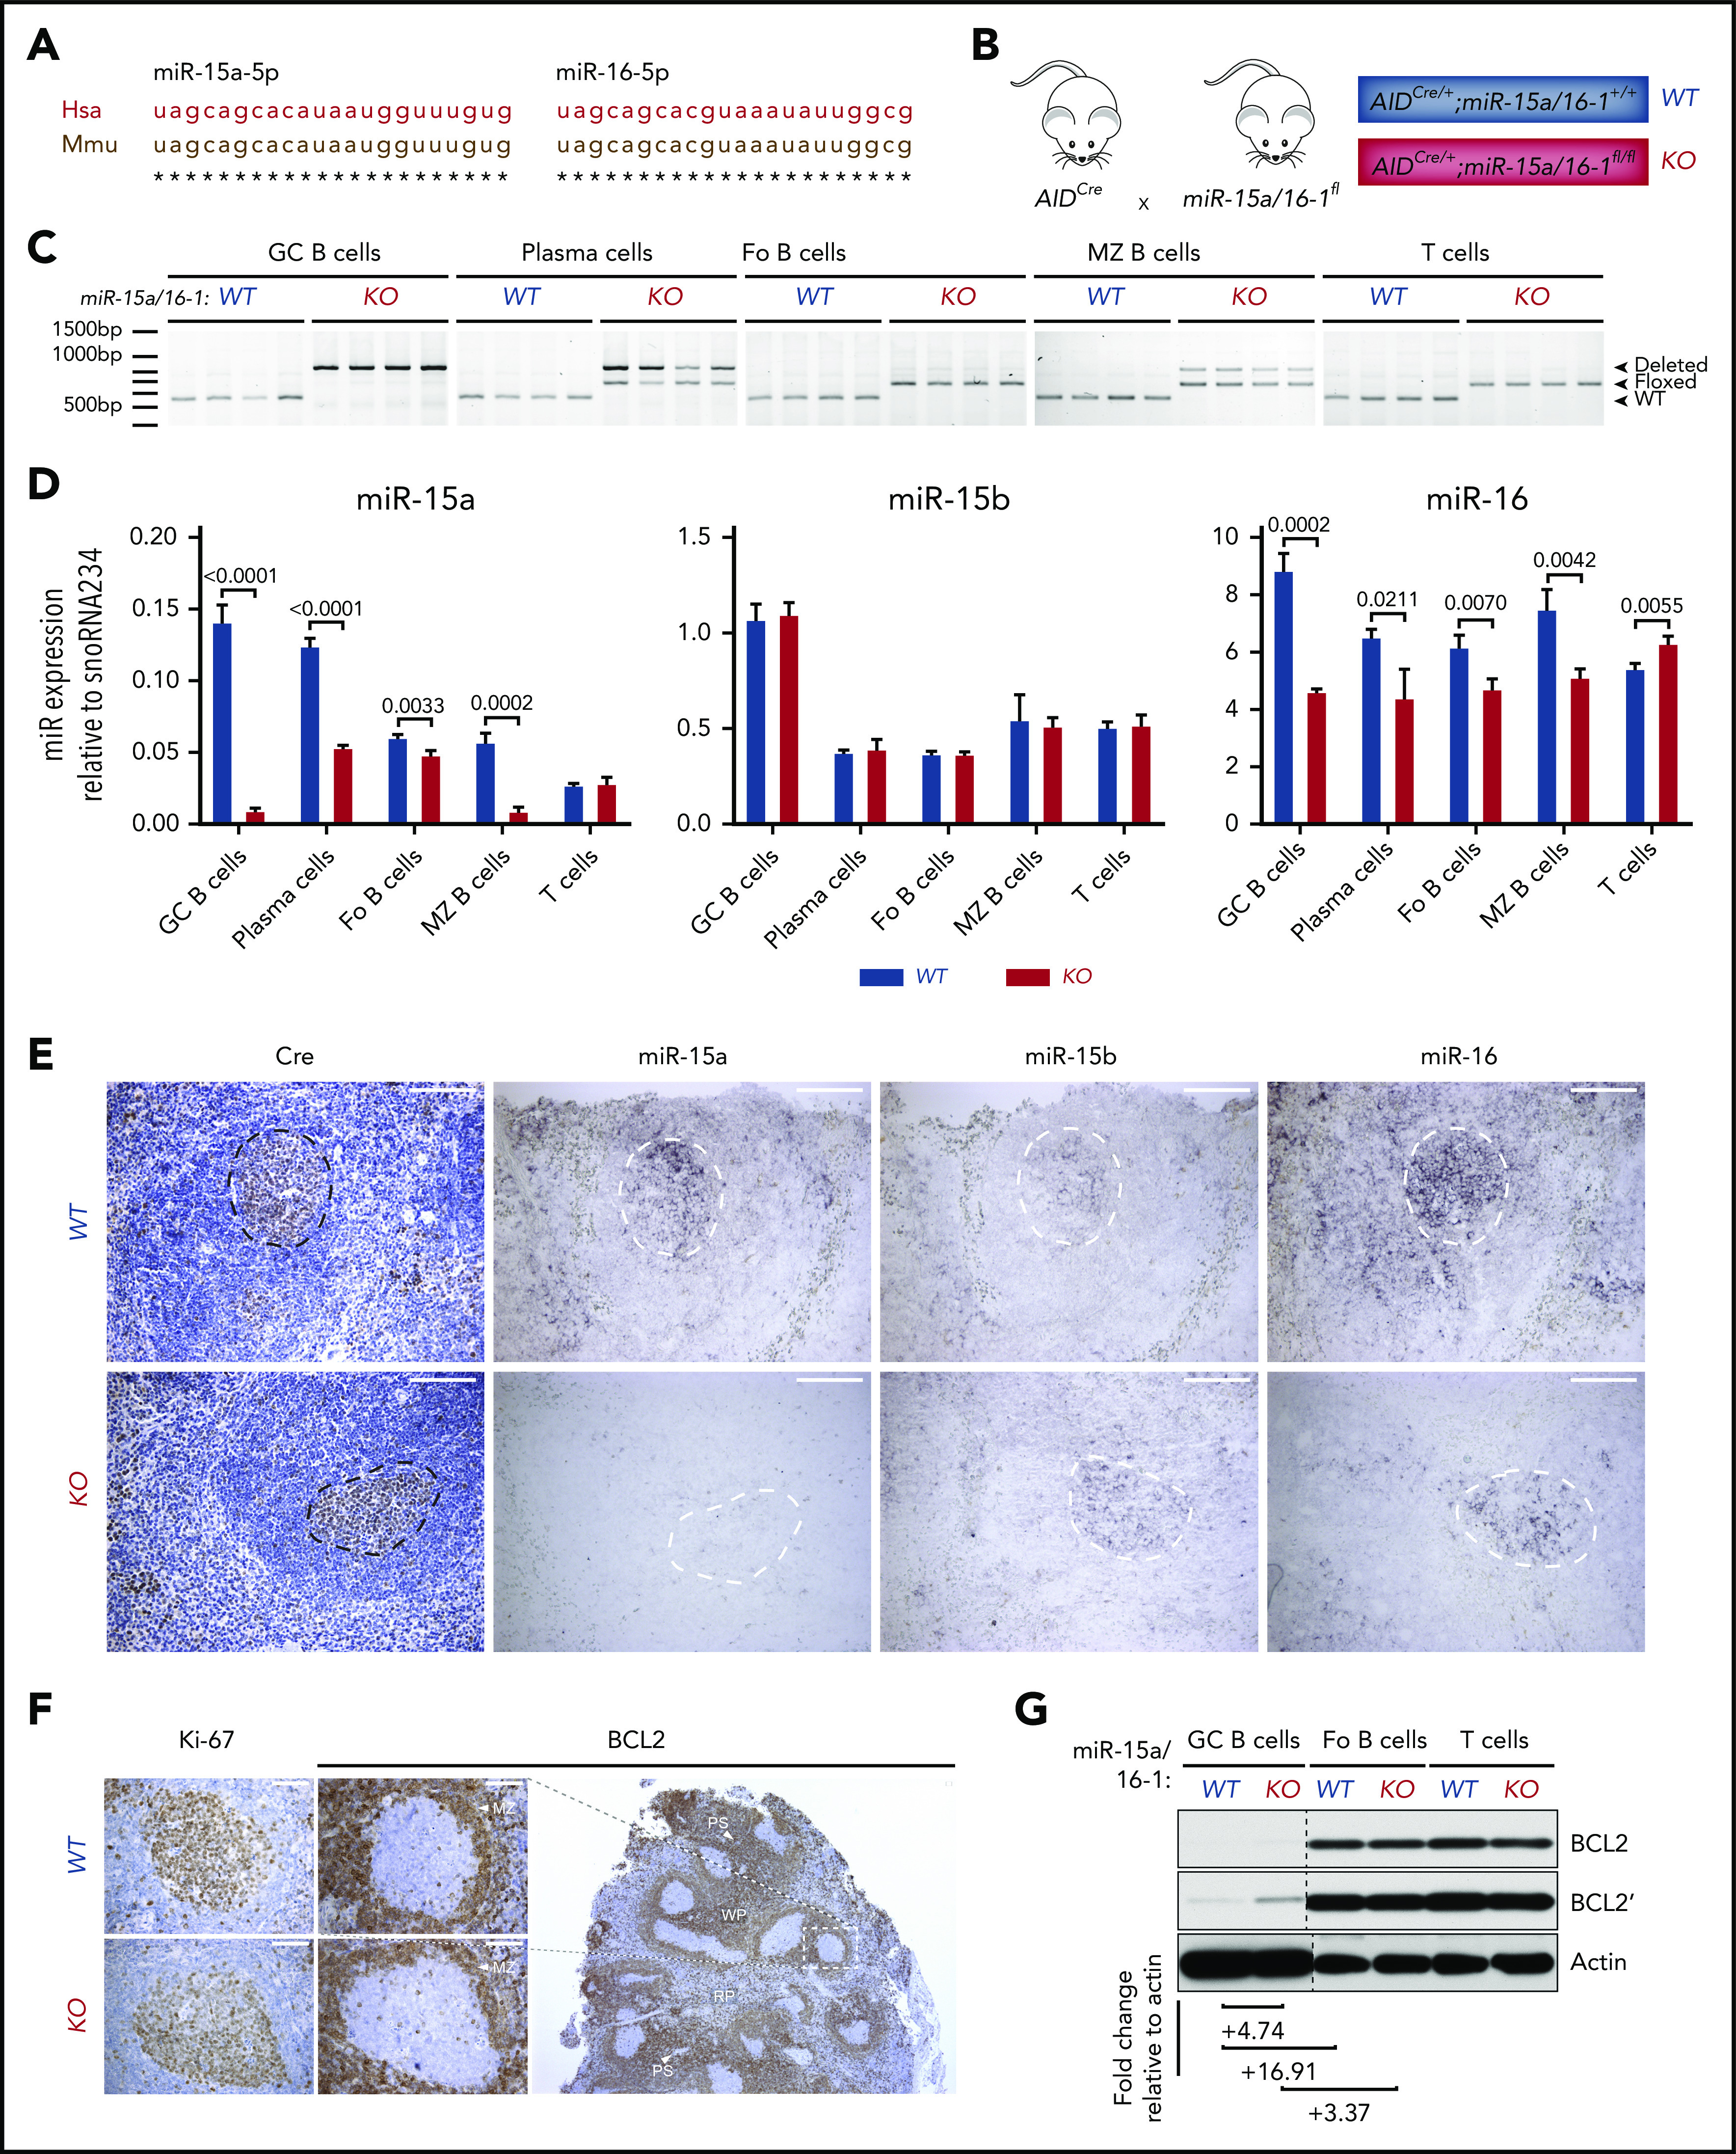
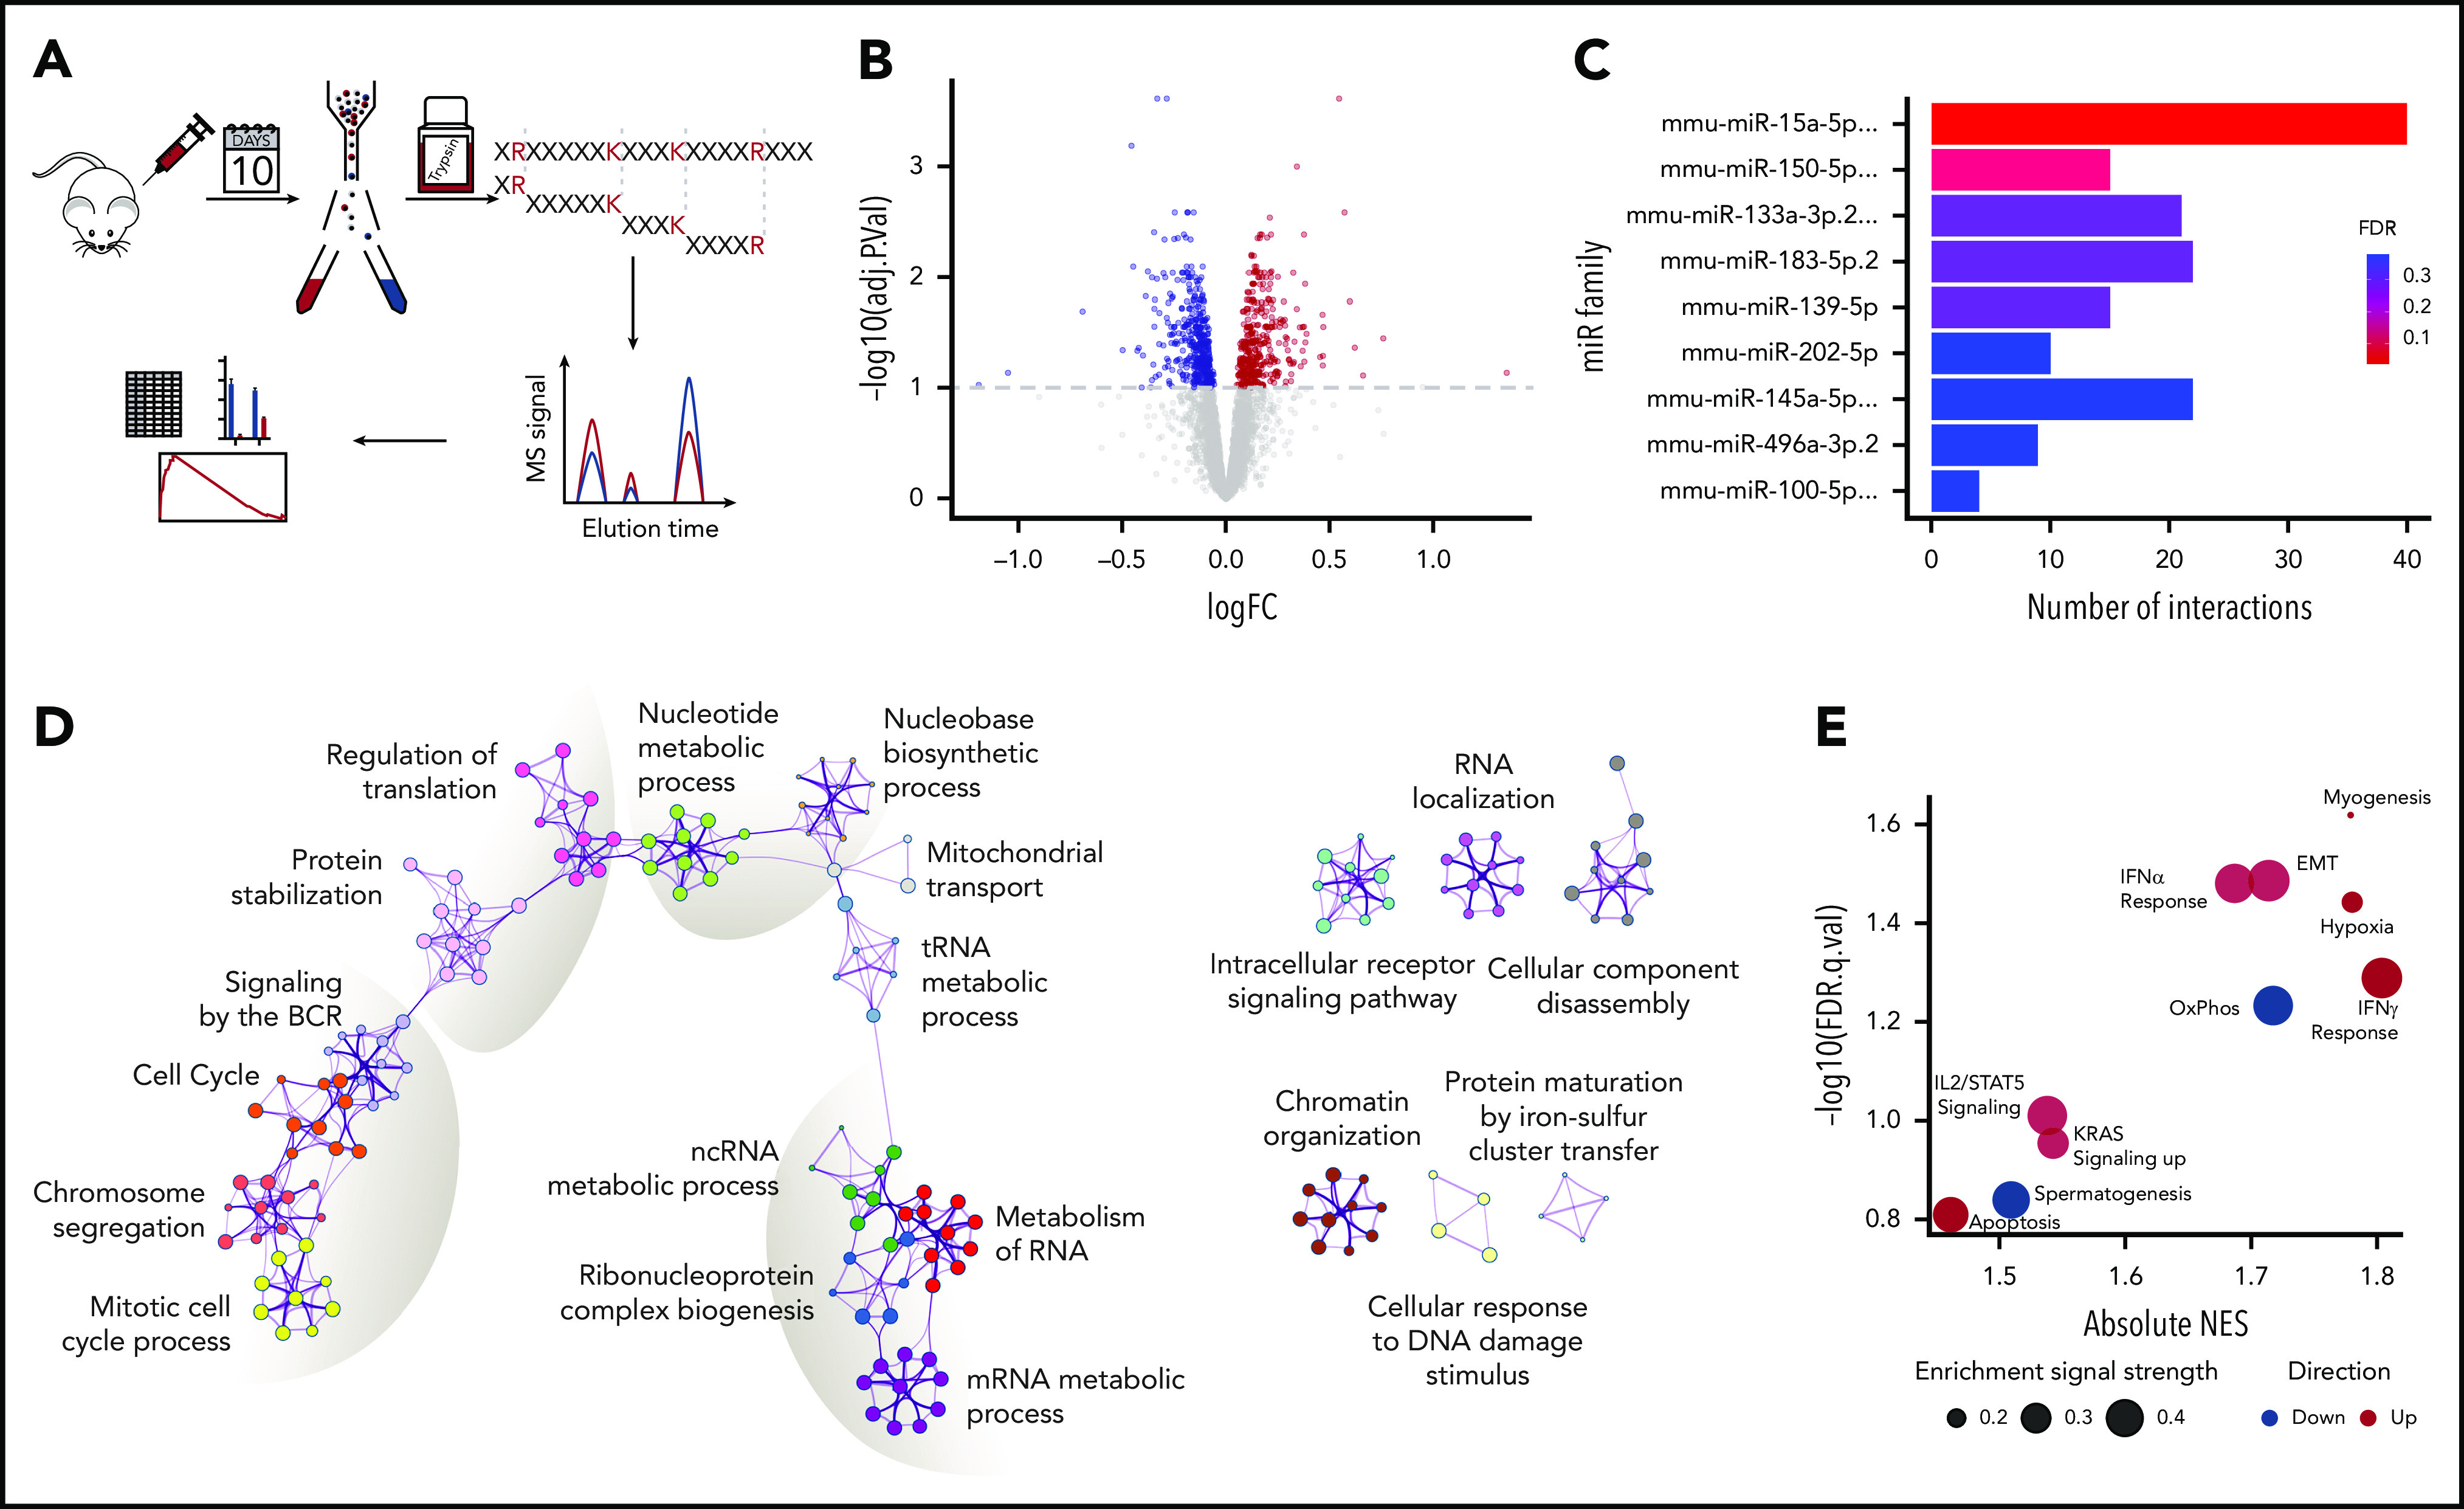
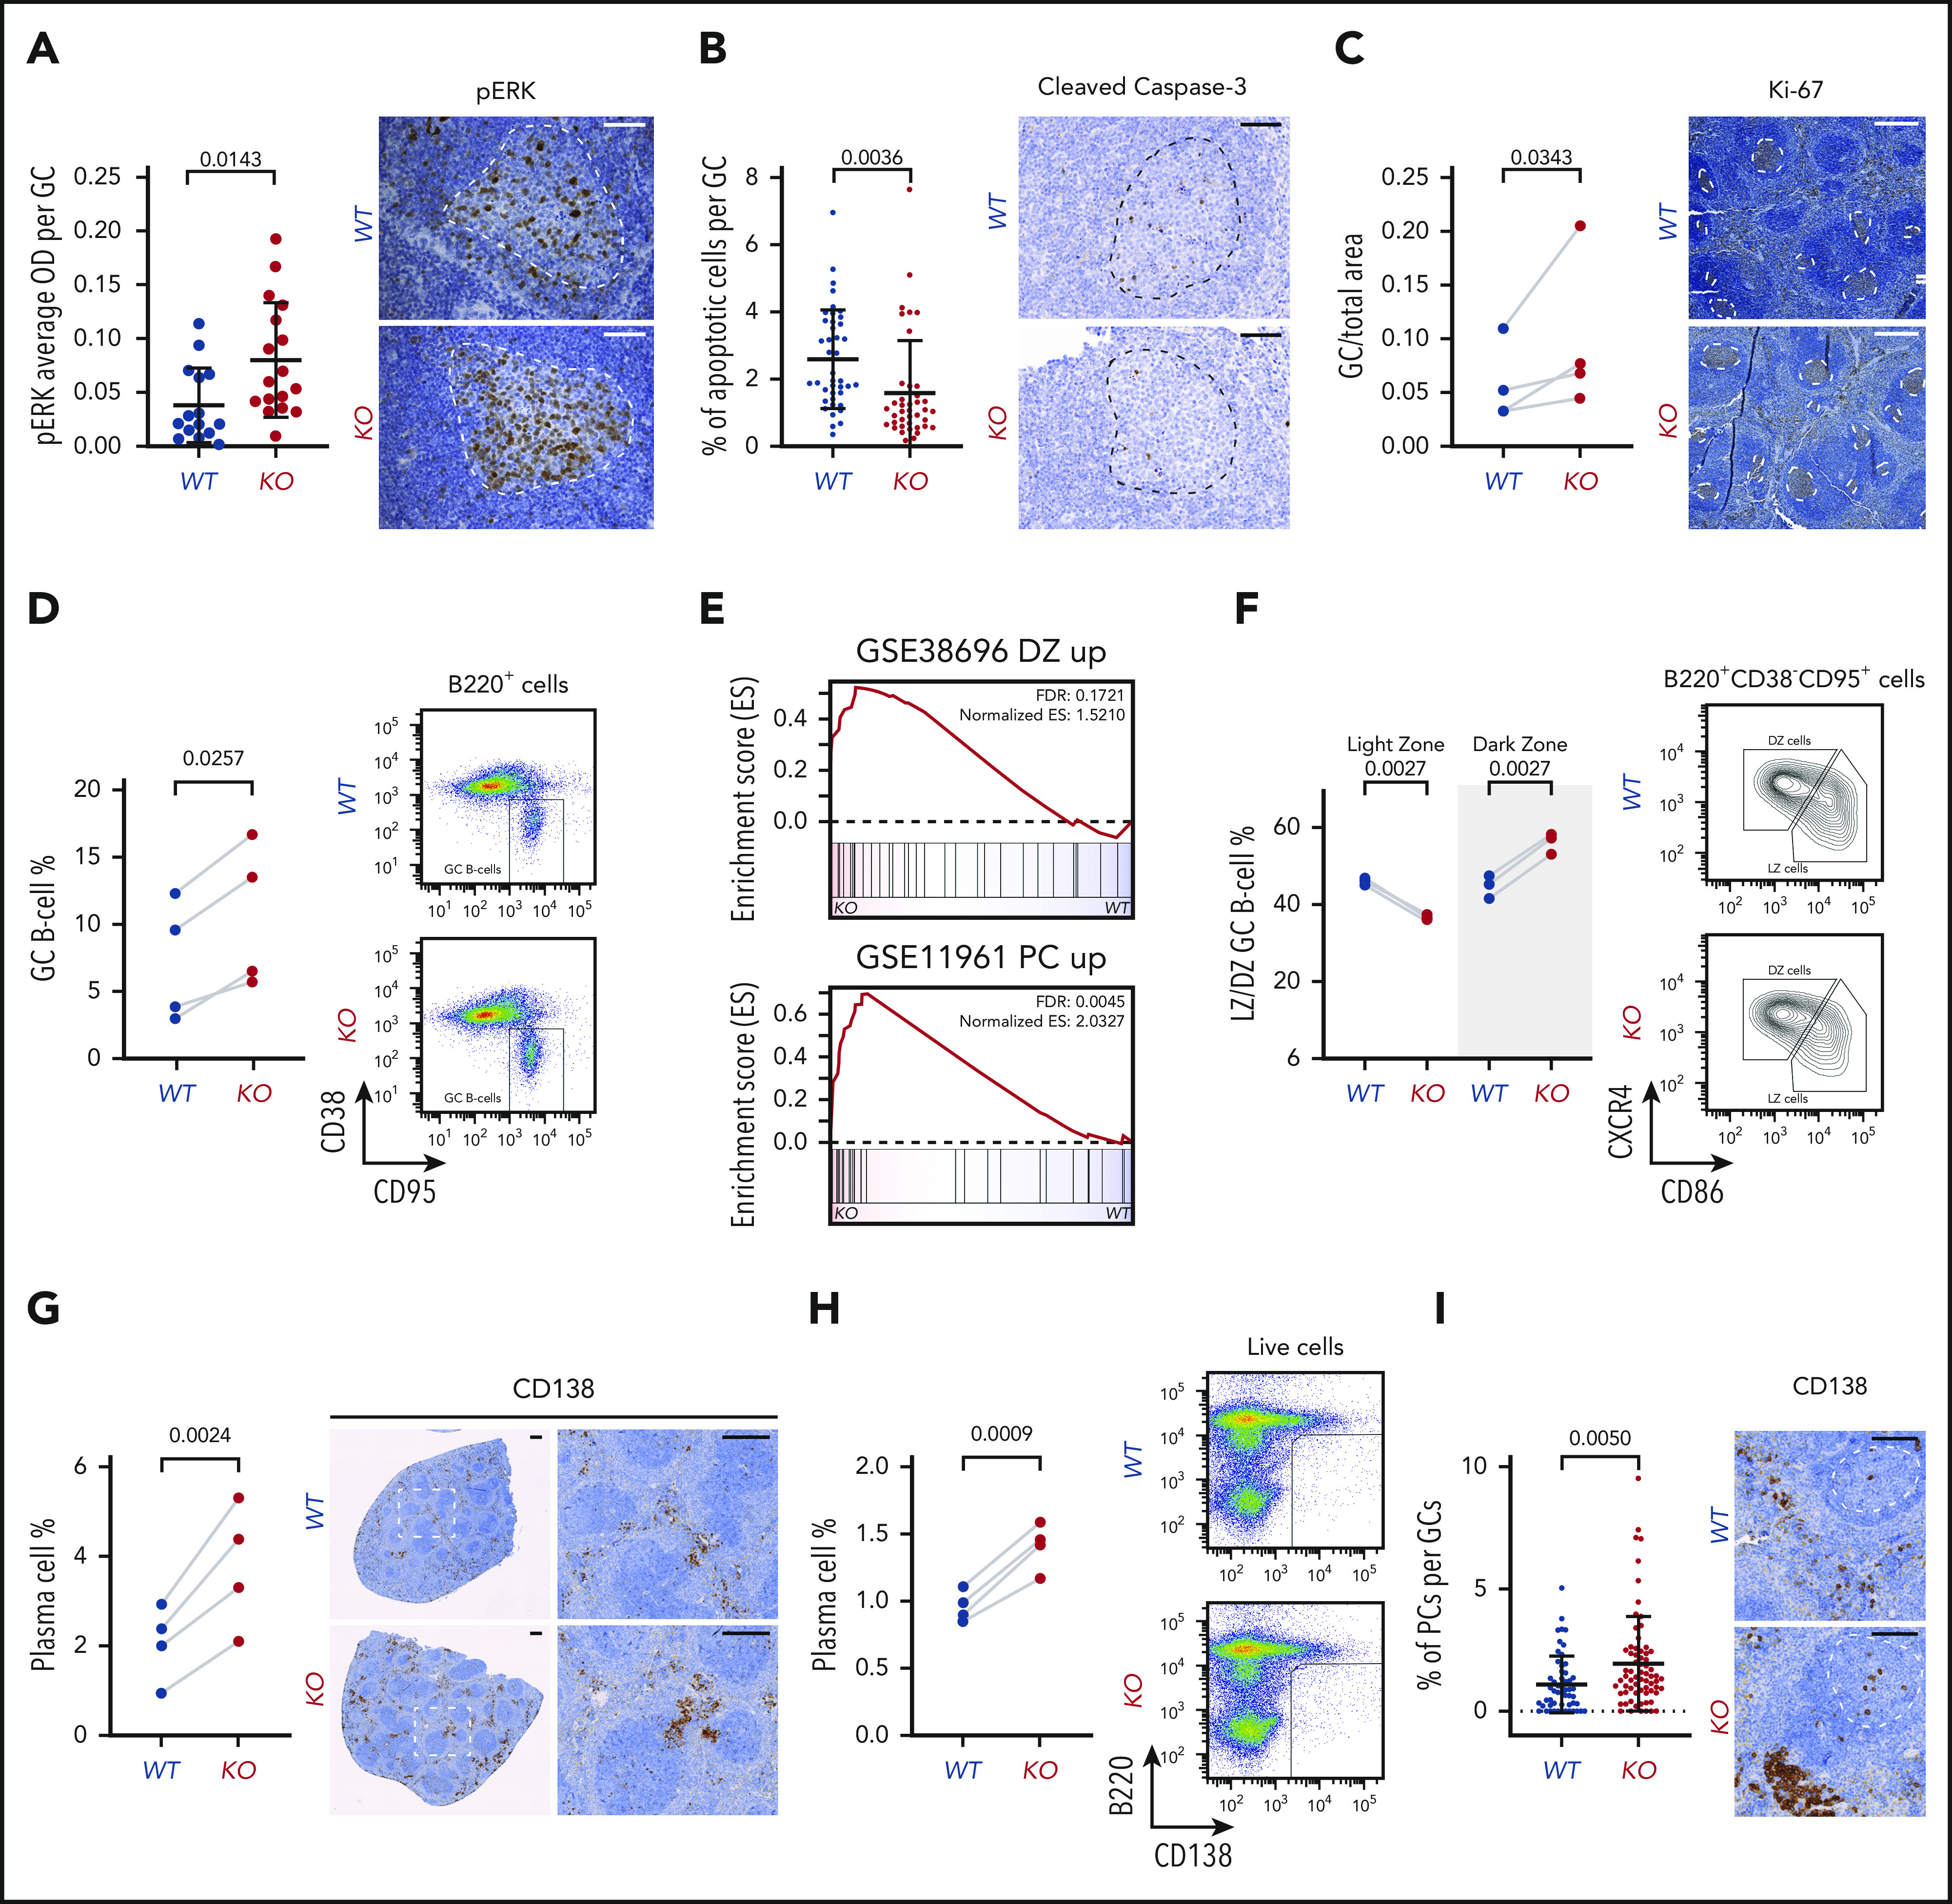
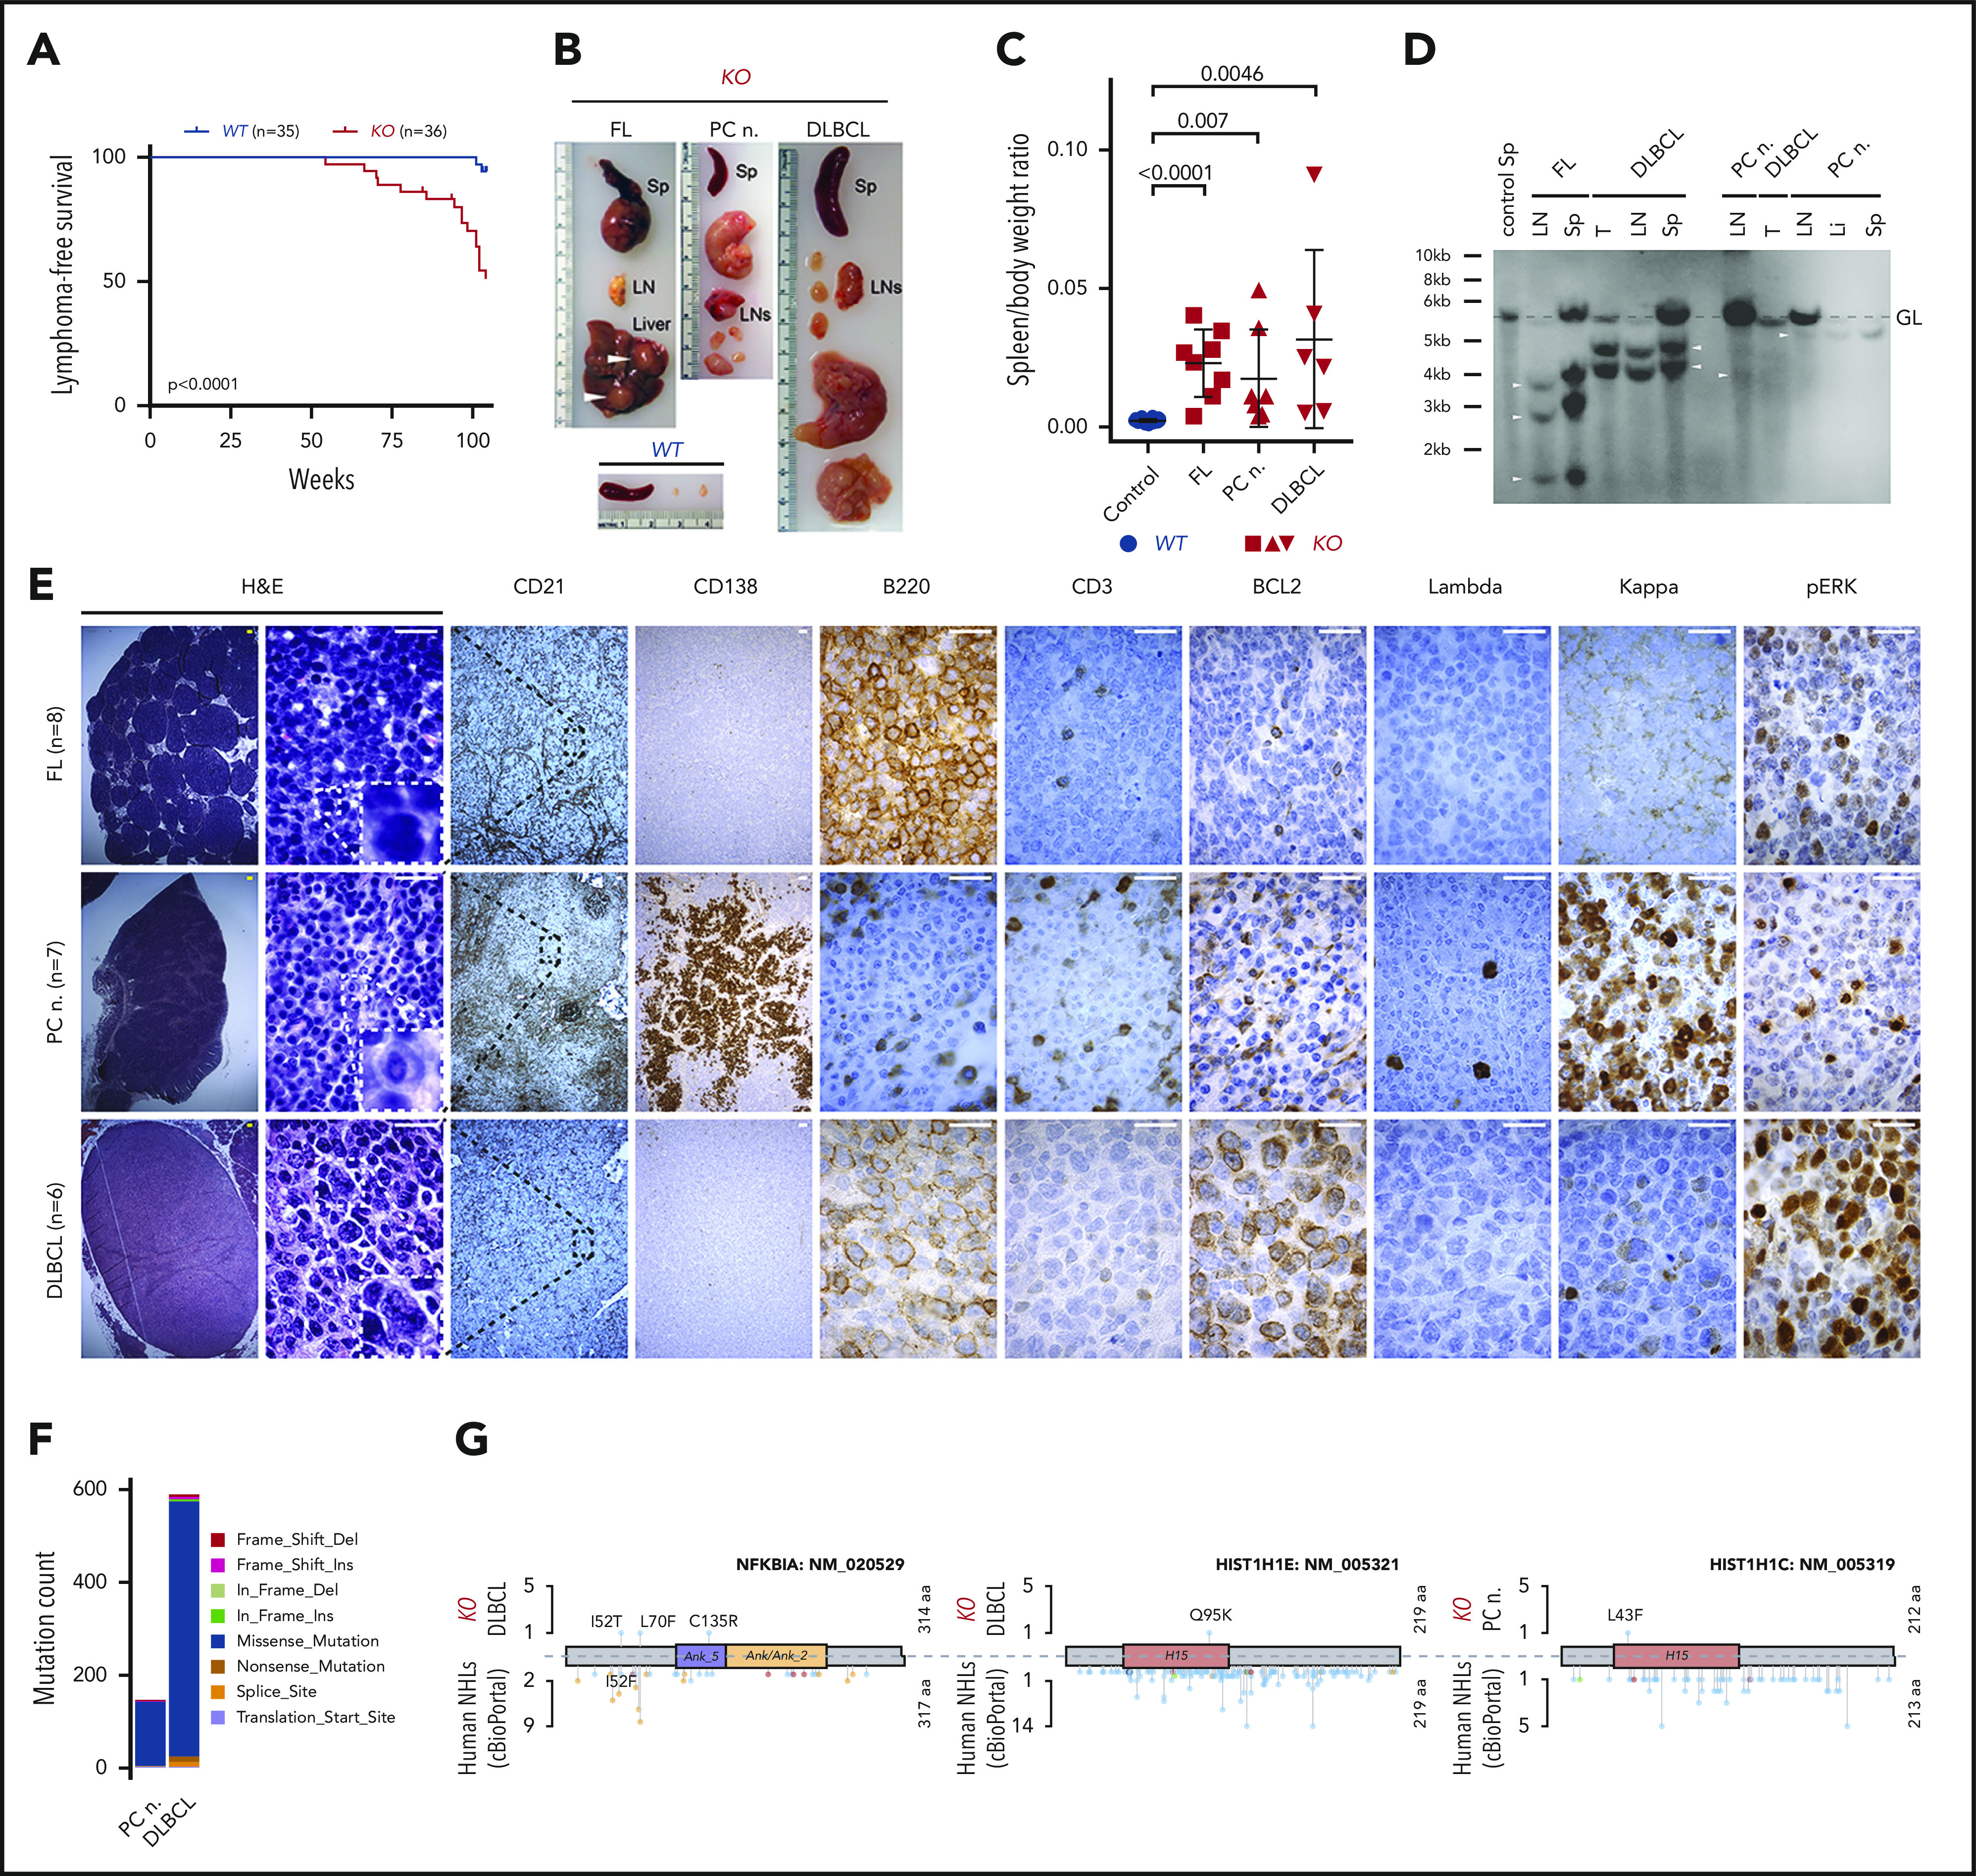
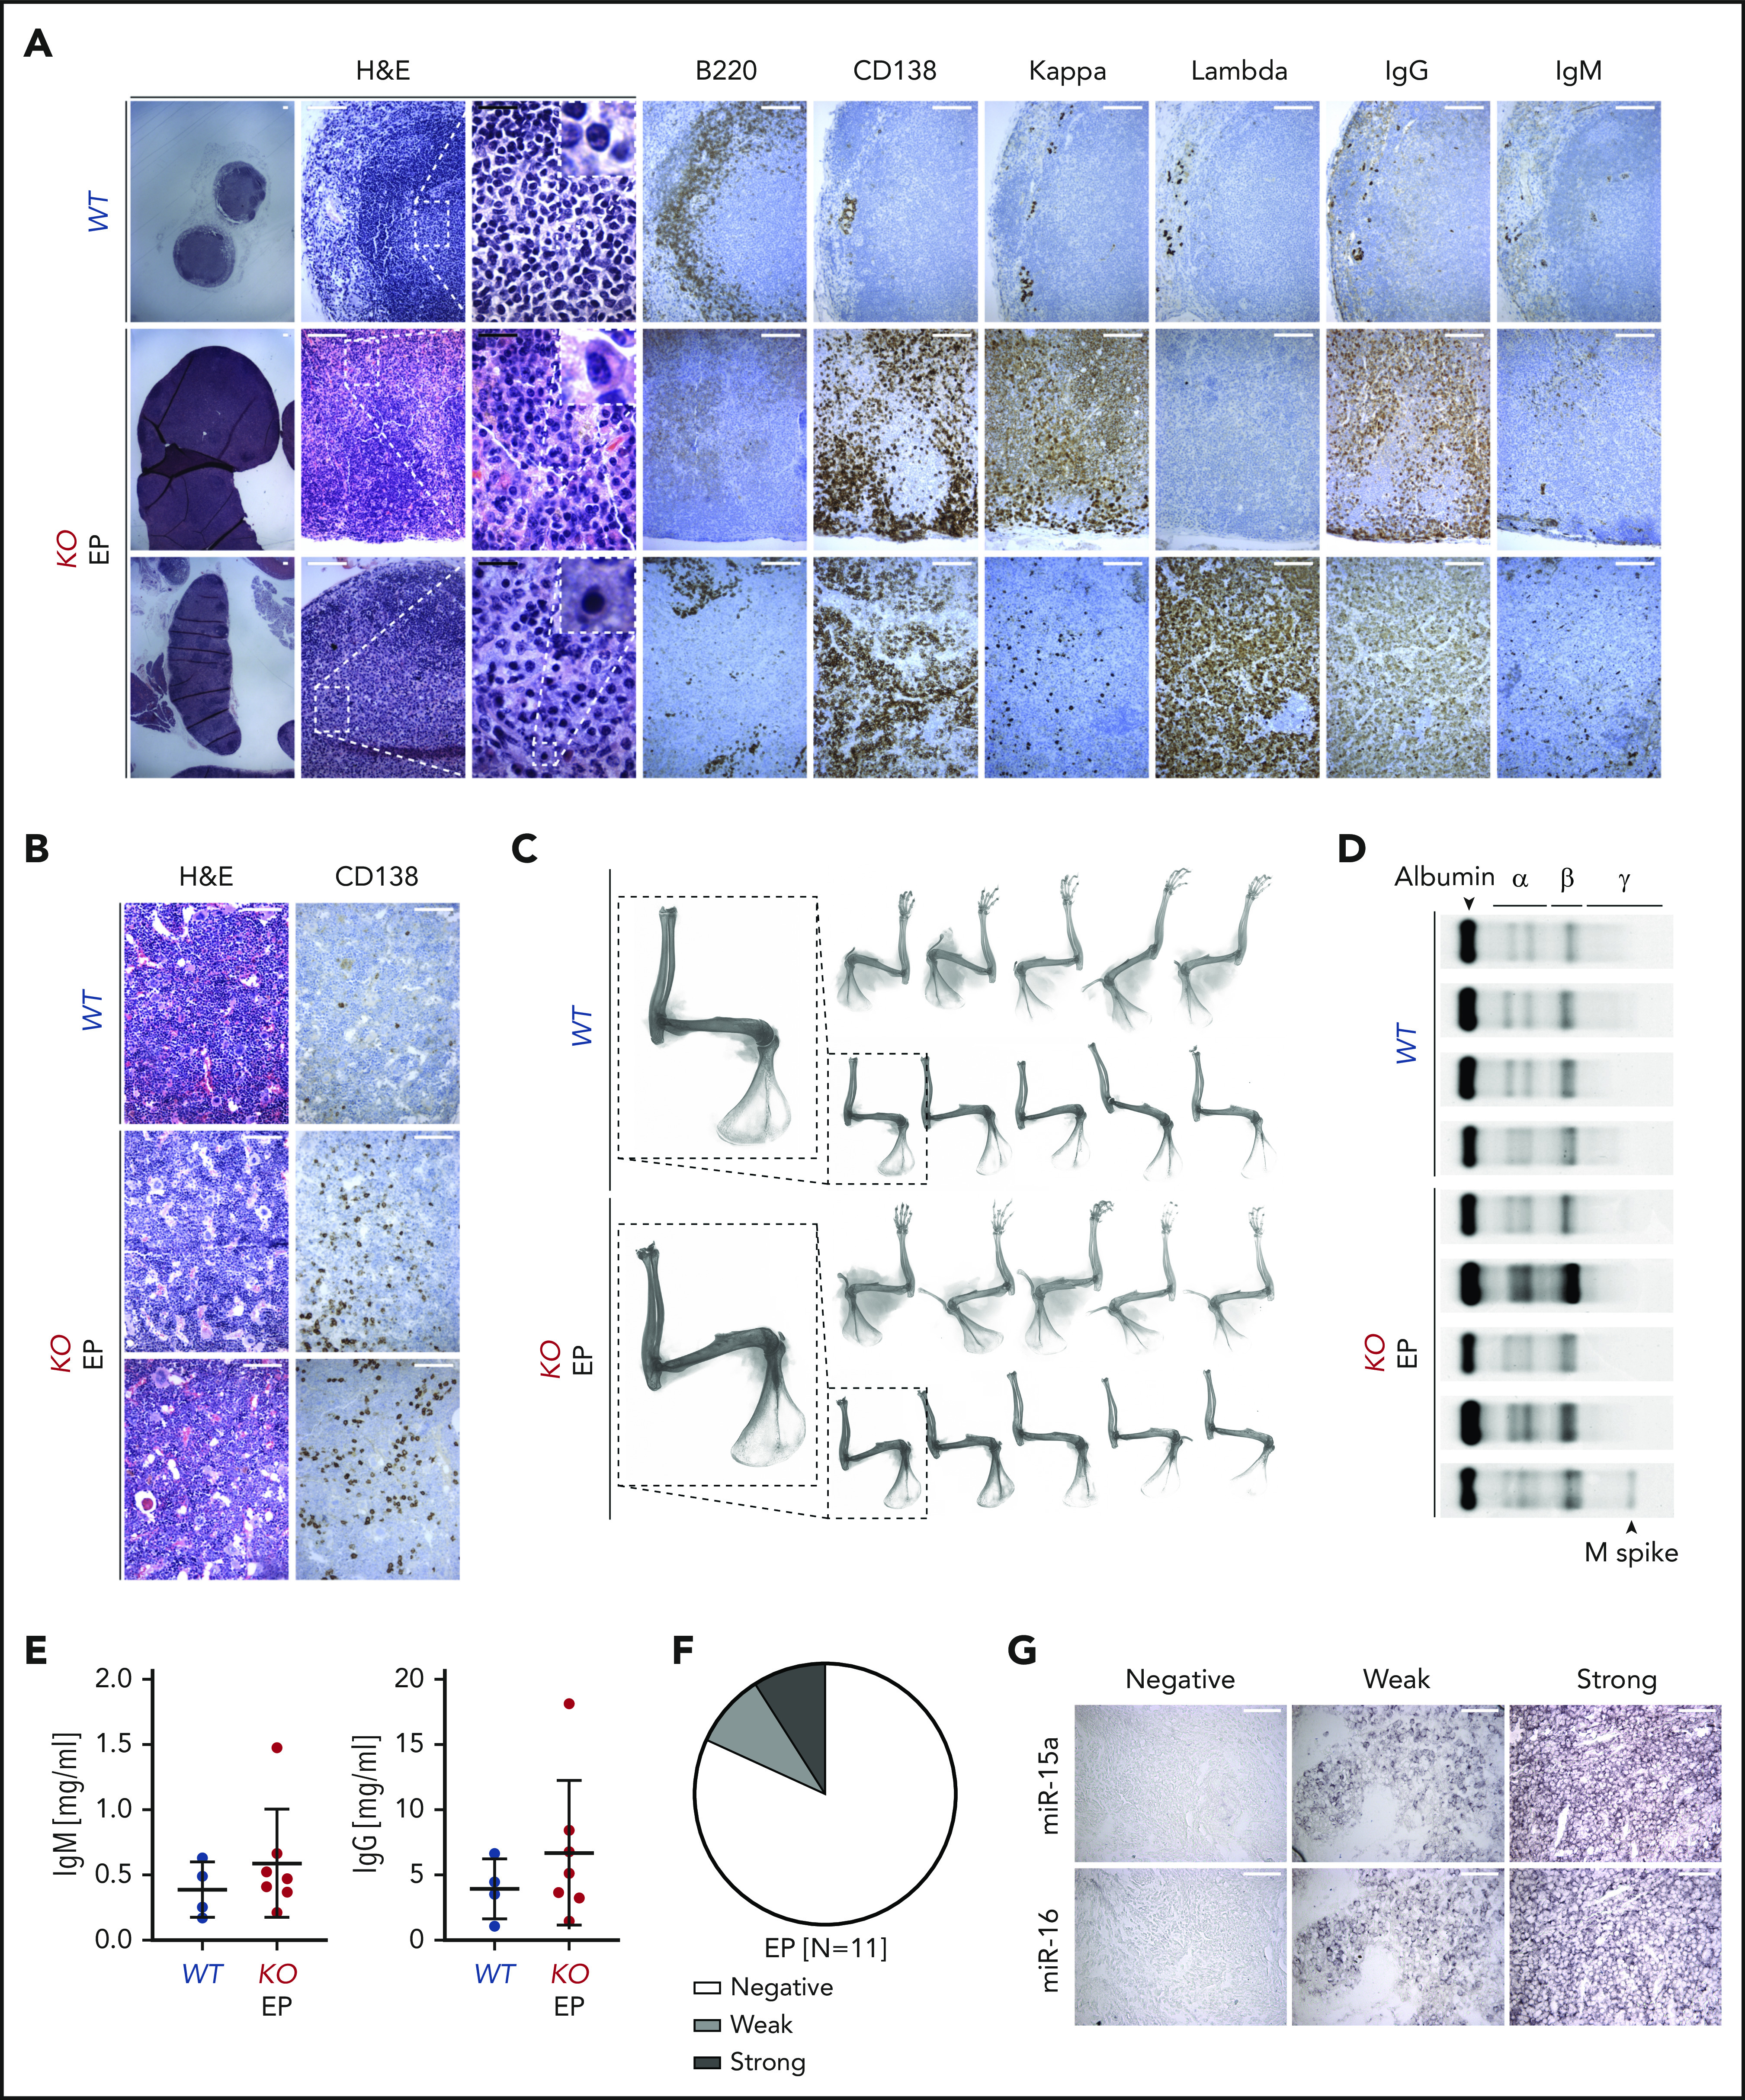
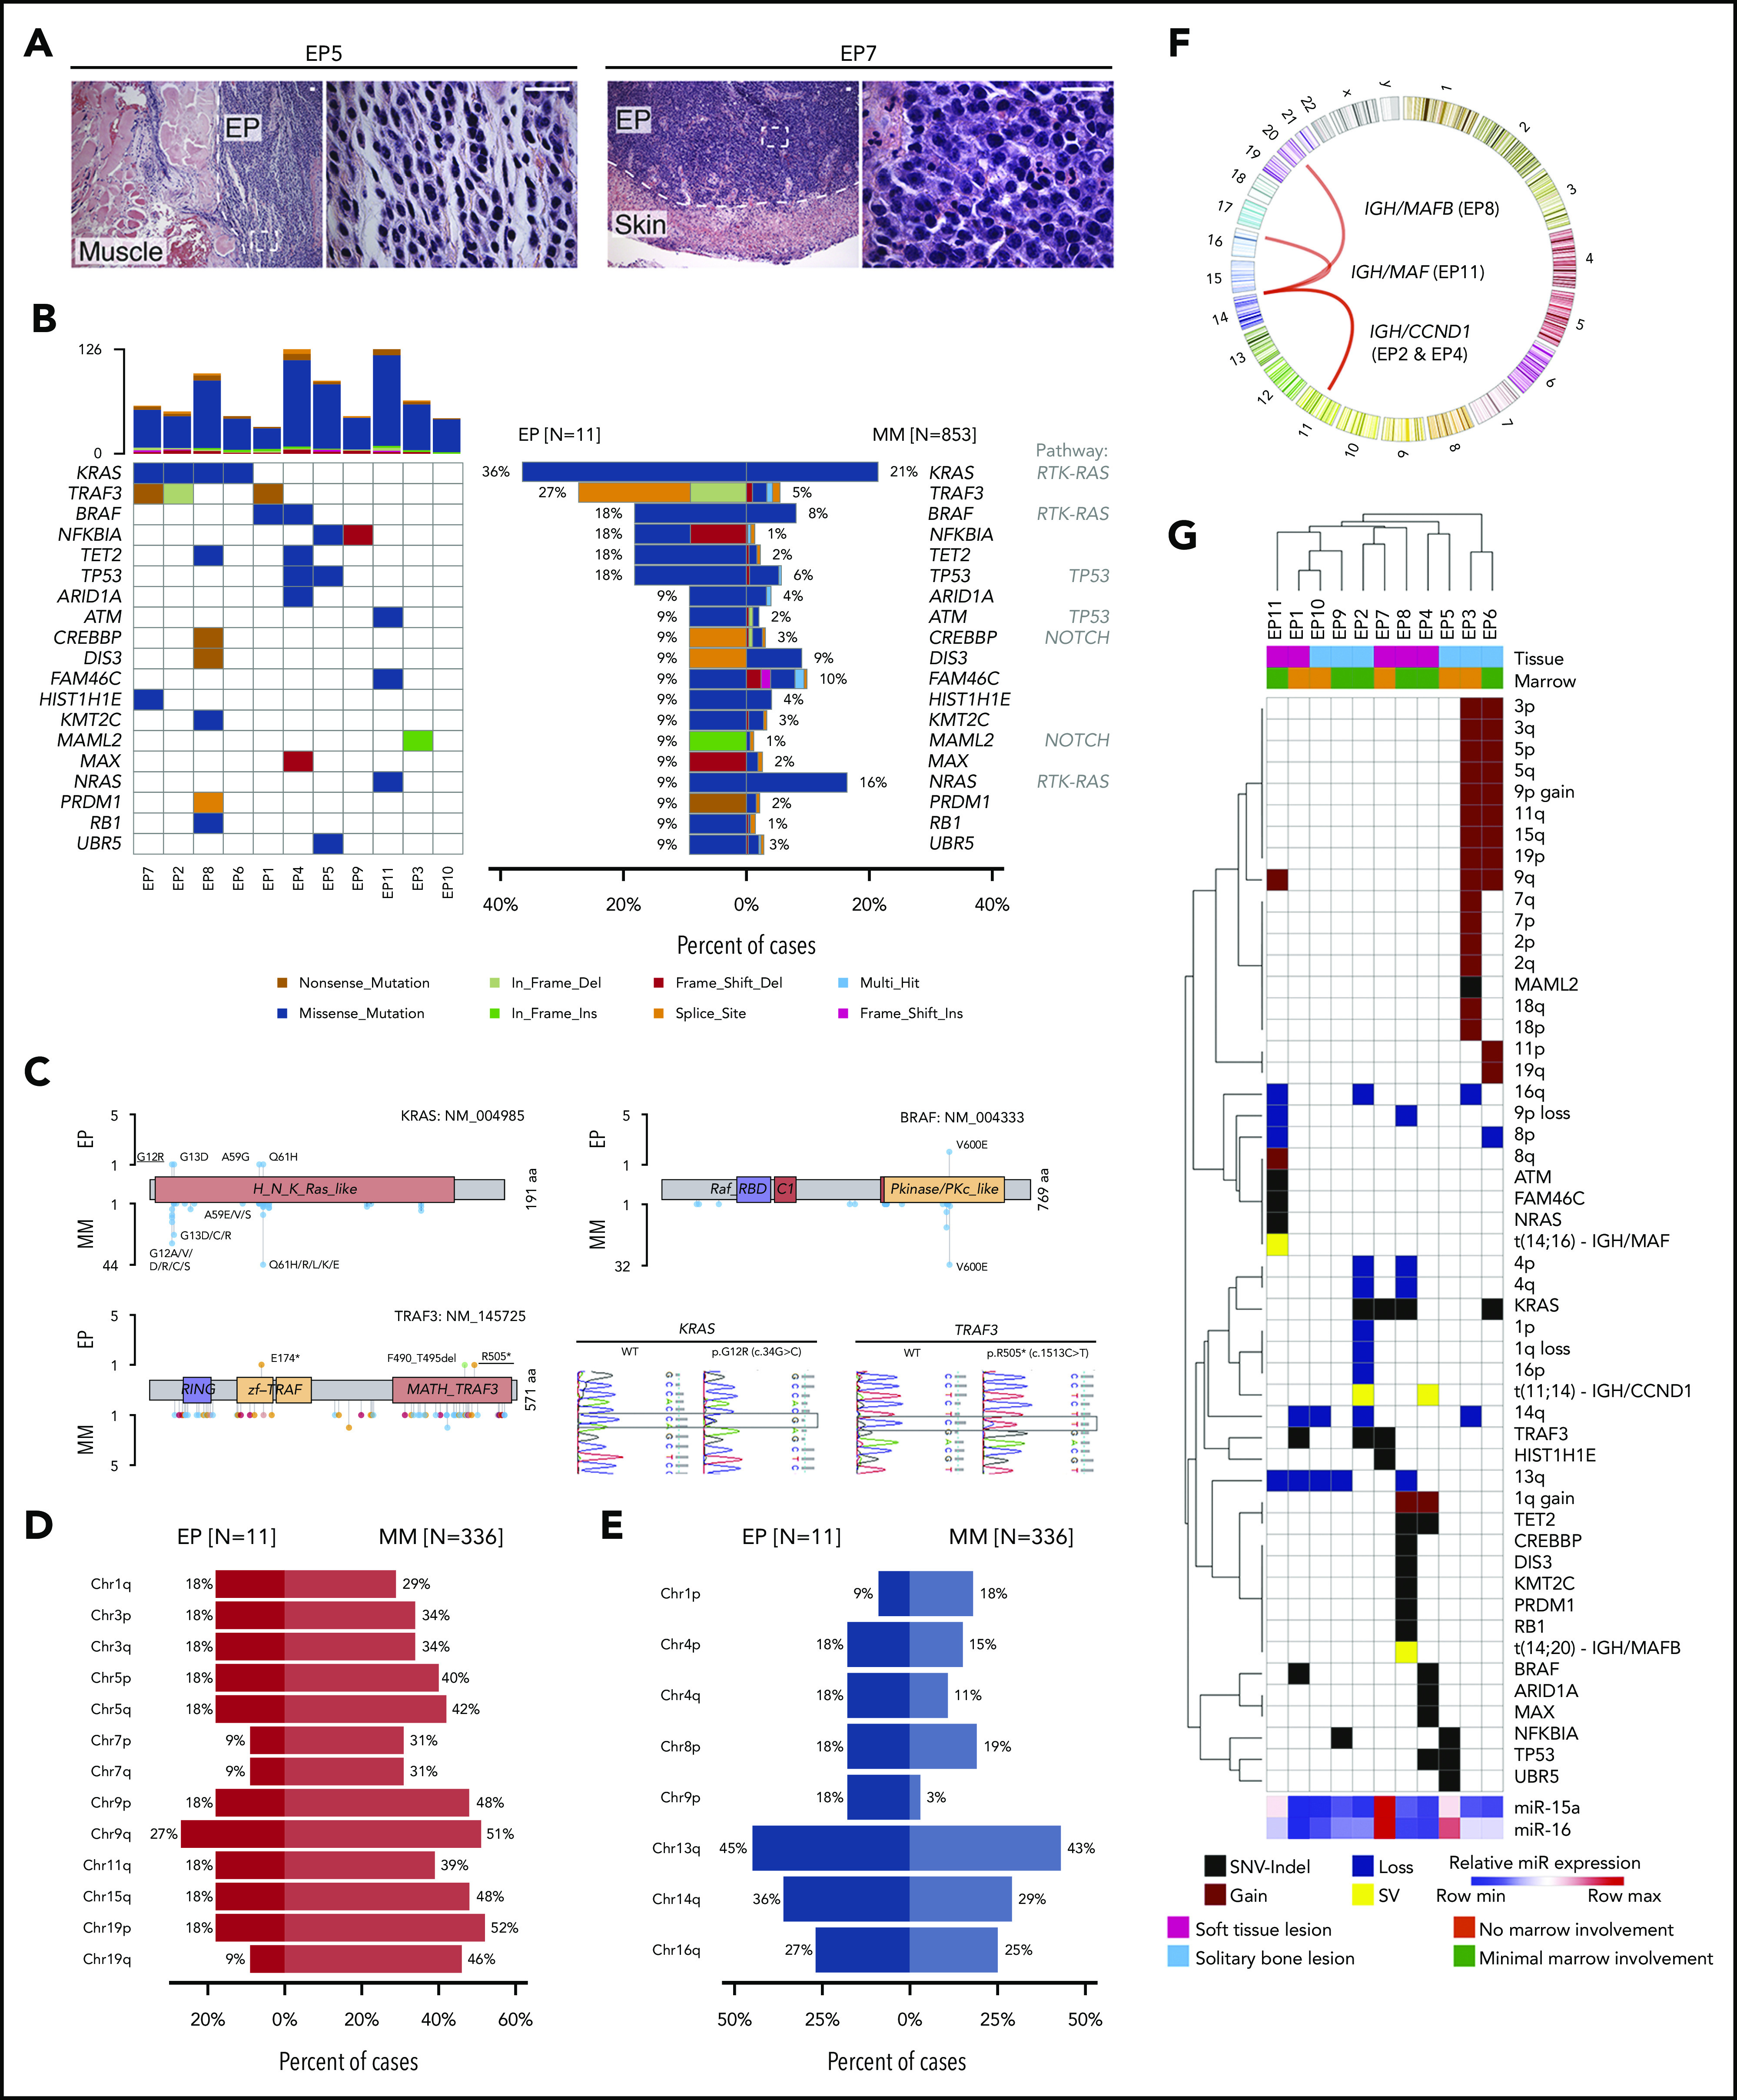
Chromosome 13q deletion [del(13q)], harboring the miR-15a/16-1 cluster, is one of the most common genetic alterations in mature B-cell malignancies, which originate from germinal center (GC) and post-GC B cells. Moreover, miR-15a/16 expression is frequently reduced in lymphoma and multiple myeloma (MM) cells without del(13q), suggesting important tumor-suppressor activity. However, the role of miR-15a/16-1 in B-cell activation and initiation of mature B-cell neoplasms remains to be determined. We show that conditional deletion of the miR-15a/16-1 cluster in murine GC B cells induces moderate but widespread molecular and functional changes including an increased number of GC B cells, percentage of dark zone B cells, and maturation into plasma cells. With time, this leads to development of mature B-cell neoplasms resembling human extramedullary plasmacytoma (EP) as well as follicular and diffuse large B-cell lymphomas. The indolent nature and lack of bone marrow involvement of EP in our murine model resembles human primary EP rather than MM that has progressed to extramedullary disease. We corroborate human primary EP having low levels of miR-15a/16 expression, with del(13q) being the most common genetic loss. Additionally, we show that, although the mutational profile of human EP is similar to MM, there are some exceptions such as the low frequency of hyperdiploidy in EP, which could account for different disease presentation. Taken together, our studies highlight the significant role of the miR-15a/16-1 cluster in the regulation of the GC reaction and its fundamental context-dependent tumor-suppression function in plasma cell and B-cell malignancies.


Conflict of interest statement

Conflict-of-interest disclosure: The authors declare no competing financial interests.

Figures

None
Graphical abstract
Figure 1.
Figure 1.
miR-15a/16 expression in normal human lymphoid tissues and MM cells. (A) miR-15a or miR-16 colocalization with PC marker CD138 in human LNs. CD138 expression was assessed by IF (green), followed by ISH analysis for miR abundance (red) on the same frozen slide. 4′,6-Diamidino-2-phenylindole (DAPI; blue) was used for nuclear counterstaining. One representative example is shown. Note colocalization of miR-15a, miR-16 signal, and CD138 in PC-rich regions as well as in individual PCs (insets, arrowheads). Scale bar, 800 µm. (B) miR-15a or miR-16 (ISH, purple) and CD138 (IHC, brown; counterstain, blue) expression in consecutive FFPE LN sections from a healthy individual. Note higher miR-15a and miR-16 abundance in a PC cluster (inset) and germinal center (GC) compared with other lymphoid cells. Scale bar, 200 µm.
Figure 2.
Figure 2.
AIDCre-mediated deletion of the miR-15a/16-1 cluster in murine lymphoid cells. (A) Alignment of human and mouse miR-15a-5p and miR-16-5p sequences. (B) Schematic of the strategy used to generate mice with miR-15a/16-1 deletion during B-cell activation. (C) miR-15a/16-1 cluster deletion assessed by PCR in indicated FACS-sorted lymphocyte subpopulations from WT (n = 4) and KO (n = 4) mice. WT locus, 558 bp (bottom band); loxP flanked miR-15a/16-1 cluster, 650 bp (middle band); deleted miR-15a/16-1 cluster, 850 bp (top band). (D) miR-15a, miR-15b, and miR-16 expression in FACS-sorted lymphocyte subpopulations from WT and KO mice, determined by RT-qPCR relative to snoRNA234. Error bars represent standard deviations of 3 independent replicates in a representative experiment. P values were calculated by using the unpaired Student t test. (E) Cre (IHC, brown; counterstain, blue) and miR-15a, miR-15b, and miR-16 expression (ISH, dark purple) in spleen sections of 12-week-old WT and KO mice. One representative example of secondary follicle for each genotype is shown. GCs are highlighted by dotted lines; scale bar, 100 μm. ISH sections were not counterstained to facilitate interpretation (see also supplemental Figure 3A-B). (F) IHC (brown; counterstain, blue) analysis of BCL2 and Ki-67 expression in splenic GCs from mice with indicated genotypes. The BCL2 staining of spleen section from a WT mouse is shown at lower magnification to depict the general pattern of BCL2 expression in murine lymphoid tissue. Note high BCL2 abundance in T cells surrounding periarteriolar sheaths (PS), MZ B cells, and Fo B cells in white pulp (WP) areas, as well as considerably lower BCL2 expression within GCs and red pulp (RP) areas. Scale bar, 50 μm. (G) BCL2 expression in indicated lymphocyte subpopulations from WT and KO mice immunized with SRBCs assessed by immunoblotting. Quantitative differences in protein expression level based on densitometric analysis were normalized to actin and are shown below the blots. Apostrophe indicates longer times of film exposure to exhibit relative differences in protein abundance. Unrelated bands were cut from the immunoblots (dotted line).
Figure 3.
Figure 3.
Proteomic changes induced by loss of the miR-15a/16-1 cluster in GC B cells. (A) Schematic design of the proteomic analysis. GC B cells were flow sorted from WT (n = 5) and KO (n = 5) mice 10 days after immunized with SRBCs. Extracted proteins were trypsinized and subjected to tandem mass tag–based liquid chromatography coupled with tandem MS, followed by in silico analyses. (B) Differentially expressed proteins between WT and KO mice at FDR < 0.1. Proteins upregulated in KO compared with WT mice are indicated in red; downregulated in blue. (C) miR target enrichment in proteins upregulated in GC B cells from KO compared with WT mice determined using MIENTURNET. Color scale represents FDR value. For simplicity, miR family names were abbreviated. (D) Network of enriched pathways and processes in proteins differentially expressed between GC B cells from KO and WT mice using Metascape. Each node represents an enriched term and is colored by functional category. (E) GSEA of "Hallmark" gene sets in proteomes of GC B cells from KO compared with WT mice. Bubble size represents enrichment signal strength calculated as the GSEA leading edge signal. Gene sets enriched in KO and WT cells are shown in red and blue, respectively. EMT, epithelial-mesenchymal transition; IFN, interferon; logFC, log fold change; ncRNA, noncoding RNA; NES, normalized enrichment score; OxPhos, oxidative phosphorylation; tRNA, transfer RNA.
Figure 4.
Figure 4.
Functional and developmental alterations caused by miR-15a/16-1 KO in mature B cells. (A) pERK cell staining intensity per GC in spleens of WT (n = 15) and KO (n = 17) mice immunized with SRBCs identified by IHC. Graphs depict the mean plus or minus standard deviation (SD) (left). Measurements were made with HALO image analysis software. P value was calculated using the unpaired Student t test. Representative pictures are shown on the right (IHC, brown; counterstain, blue); GCs are highlighted by dotted lines. Scale bar, 50 µm. (B) Percentage of apoptotic cells per GC in spleens of WT (n = 41) and KO (n = 40) mice immunized with SRBC identified by cleaved caspase-3 IHC. Graphs depict the mean plus or minus SD (left). Measurements were made with inForm cell analysis software. P value was calculated using the unpaired Student t test. Representative pictures are shown on the right (IHC, brown; counterstain, blue); GCs are highlighted by dotted lines. Scale bar, 50 µm. (C) Area of GCs in spleens of WT (n = 4) and KO (n = 4) mice immunized with SRBCs identified by Ki-67 IHC. Graphs depict areas in paired littermate samples analyzed in parallel (left). Measurements were made with HALO Image Analysis software. P value was calculated using the ratio paired Student t test. Representative pictures are shown on the right (IHC, brown; counterstain, blue); GCs are highlighted by dotted lines. Scale bar, 300 µm. (D) Percentage of GC B cells in spleens of WT (n = 4) and KO (n = 4) mice immunized with SRBCs determined using flow cytometry. Graphs depict percentages in paired littermate samples analyzed in parallel (left). P value was calculated using the ratio paired Student t test. Representative dot plots are shown on the right. (E) GSEA analysis of signatures upregulated in DZ compared with LZ GC B cells from GSE38696 (top) and PCs compared with GC B cells from GSE11961 (bottom) in proteomes of GC B cells from KO vs WT mice. (F) Percentage of LZ and DZ GC B cells in spleens of WT (n = 3) and KO (n = 3) mice immunized with SRBCs determined using flow cytometry. Graphs depict percentages in paired littermate samples analyzed in parallel (left). P values were calculated using the ratio paired Student t test. Representative density plots are shown on the right. (G) Percentage of PCs in spleens of WT (n = 4) and KO (n = 4) mice immunized with SRBCs identified by CD138 IHC. Graphs depict percentages in paired littermate samples analyzed in parallel (left). Measurements were made with HALO image analysis software. P value was calculated using the ratio paired Student t test. Representative pictures are shown on the right (IHC, brown; counterstain, blue). Scale bar, 250 µm. (H) Percentage of PCs in spleens of WT (n = 4) and KO (n = 4) mice immunized with SRBC determined using flow cytometry. Graphs depict percentages in paired littermate samples analyzed in parallel (left). P value was calculated using the ratio paired Student t test. Representative dot plots are shown on the right. (I) Percentage of PCs per GC in spleens of WT (n = 4) and KO (n = 4) mice immunized with SRBCs identified by CD138 IHC. Graphs depict the mean plus or minus SD (left). Measurements were made with HALO image analysis software. P value was calculated using the unpaired Student t test Representative pictures are shown on the right (IHC, brown; counterstain, blue); GCs are highlighted by dotted lines. Scale bar, 100 µm. ES, enrichment score; OD, optical density; pERK, phosphorylated ERK.
Figure 5.
Figure 5.
Development of PC neoplasm and lymphoma phenotype in aged KO mice. (A) Kaplan-Meier plots illustrating lymphoma-free survival for aging cohorts of WT (n = 35) and KO (n = 36) mice. P value was calculated by using the log-rank test. (B) Representative images of spleens (Sp), LNs, and liver from an age-matched WT healthy control mouse and 1 each with the indicated lymphoma phenotype from KO mice. Note enlarged spleen and LNs, and tumor nodules in the liver (white arrowheads) of KO mice. (C) Comparison of spleen/body weight ratios between age-matched WT healthy controls (blue) and KO (red) mice with the indicated lymphoma phenotypes. P values were calculated by using the unpaired Student t test. (D) Clonality evaluated by Southern blot analysis of the IgH gene in DNA isolated from LNs, spleen (Sp), main tumor mass (T), or liver (Li) from KO mice with the indicated phenotypes. The nonrearranged germ line (GL) band (dashed gray line) and 1 to 3 clonally rearranged bands per mouse were identified (arrowheads). (E) Histologic and IHC stains of indicated markers on serial consecutive LN sections from representative KO mice with the indicated lymphoma phenotype. Hematoxylin-and-eosin (H&E) stain. Scale bars: yellow, 100 µm; white, 20 µm. (F) Number of SNVs and indels in the PC neoplasm and DLBCL from KO mice determined using WES. Colors represent mutation types. (G) Location of mutations in exemplary affected proteins in mouse DLBCL and PC neoplasm as well as human non-Hodgkin lymphomas (NHL). Colors represent mutation types as in panel F.
Figure 6.
Figure 6.
Characterization of PC neoplasm in KO mice. (A-B) Histologic and IHC stains of indicated markers on serial LN (A) and BM (B) sections from age-matched WT control and 2 representative KO mice with EP. Scale bars: white, 100 µm; black, 20 µm. (C) Bone radiographs of limbs with muscles still attached (top) or after removal (bottom) of WT and KO mice with PC neoplasm. One representative bone radiograph from each group is magnified to facilitate the interpretation. Note absence of bone lytic lesions in all EP cases. (D) Serum protein electrophoresis of WT and KO mice with PC neoplasm. Note presence of M spike in 1 of the EP cases. (E) Plasma IgM and IgG concentrations assessed using ELISA in WT and KO mice with PC neoplasm. Graphs depict the mean plus or minus SD. (F-G) miR-15a and miR-16 expression (ISH) assessed on FFPE biopsy sections from patients with EP (n = 11). (F) The ISH signal was scored into 3 grades ranging from negative, to weak, to strong in comparison with healthy nodal PCs. (G) A representative example for each grade is shown. Scale bar, 50 µm.
Figure 7.
Figure 7.
Mutational profiling of human primary EP. (A) Histologic H&E stains of 2 exemplary human primary EP included in the WES analysis. Note extramedullary localization of neoplastic PCs. Scale bar, 20 µm. (B) Oncoplot of mutations in 11 primary EP showing color-coded mutations in cancer candidate genes (right) and their frequency compared with MM (left). Number of nonsynonymous mutations for each sample is shown at the top. (C) Location of mutations in exemplary affected proteins in EP and MM. Colors represent mutation types as in panel B. Exemplary histograms from Sanger sequencing validating KRAS G12R and TRAF3 R505* mutations in EP8 and EP1, respectively, are shown. (D-E) Frequency of chromosomal arm-level gains (D) and losses (E) in EP in relation to MM. Note that del(13q) is the most common chromosomal alteration in EP and that frequency of chromosomal gains is lower in EP than in MM. (F) Circos plot of chromosomal rearrangements identified by fluorescence ISH. (G) Summary of genetic alterations identified in EP presented as color-coded matrix. Hierarchical clustering was done using 1 − the Pearson correlation. Expression of miR-15a and miR-16 determined using RT-qPCR relative to U6 is shown as heatmap at the bottom. SV, structural variation.

Similar articles

Cited by

References

    1. Bartel DP. MicroRNAs: genomics, biogenesis, mechanism, and function. Cell. 2004;116(2):281-297. - PubMed
    1. Bartel DP, Chen CZ. Micromanagers of gene expression: the potentially widespread influence of metazoan microRNAs. Nat Rev Genet. 2004;5(5):396-400. - PubMed
    1. Lai EC. Two decades of miRNA biology: lessons and challenges. RNA. 2015;21(4):675-677. - PMC - PubMed
    1. Selbach M, Schwanhäusser B, Thierfelder N, Fang Z, Khanin R, Rajewsky N. Widespread changes in protein synthesis induced by microRNAs. Nature. 2008;455(7209):58-63. - PubMed
    1. Lu J, Getz G, Miska EA, et al. MicroRNA expression profiles classify human cancers. Nature. 2005;435(7043):834-838. - PubMed

Publication types

MeSH terms

Supplementary concepts