

Neuroimaging of Supraventricular Frontal White Matter in Children with Familial Attention-Deficit Hyperactivity Disorder and Attention-Deficit Hyperactivity Disorder Due to Prenatal Alcohol Exposure
- PMID: 33751467
- PMCID: PMC8442735
- DOI: 10.1007/s12640-021-00342-0
Neuroimaging of Supraventricular Frontal White Matter in Children with Familial Attention-Deficit Hyperactivity Disorder and Attention-Deficit Hyperactivity Disorder Due to Prenatal Alcohol Exposure
Abstract
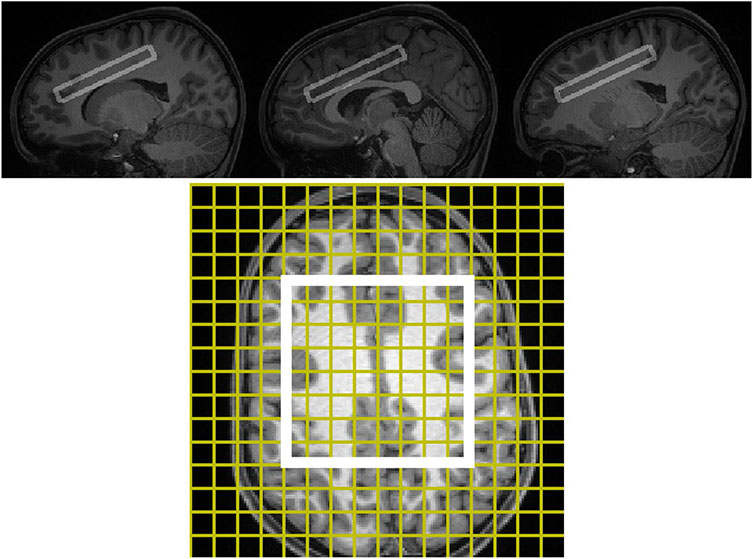
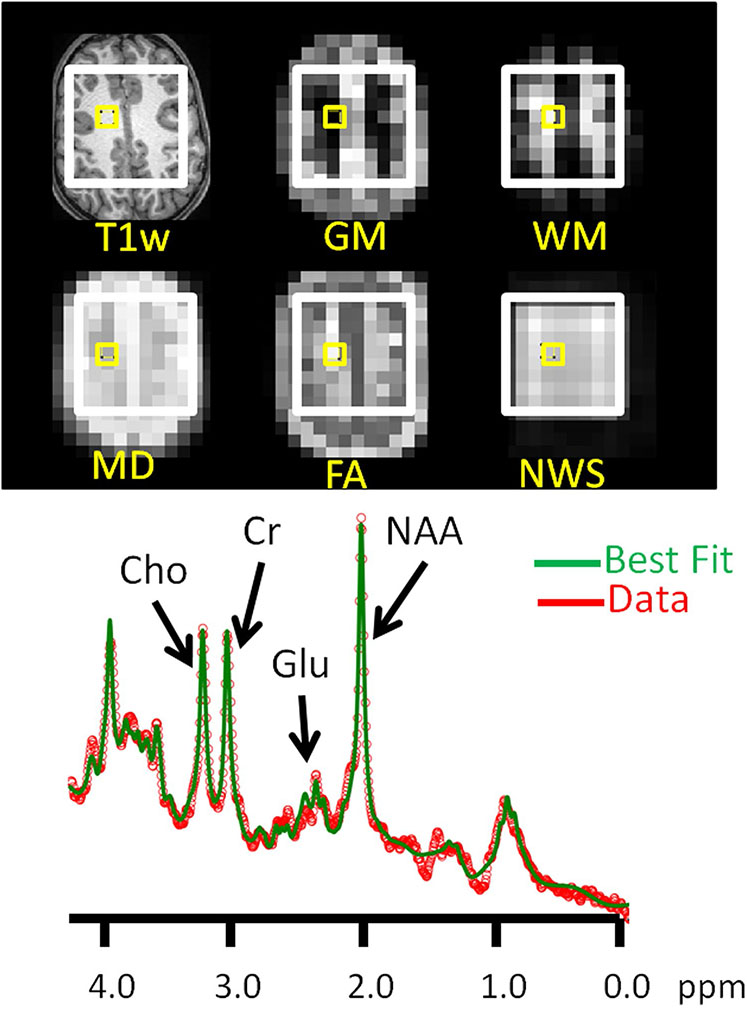
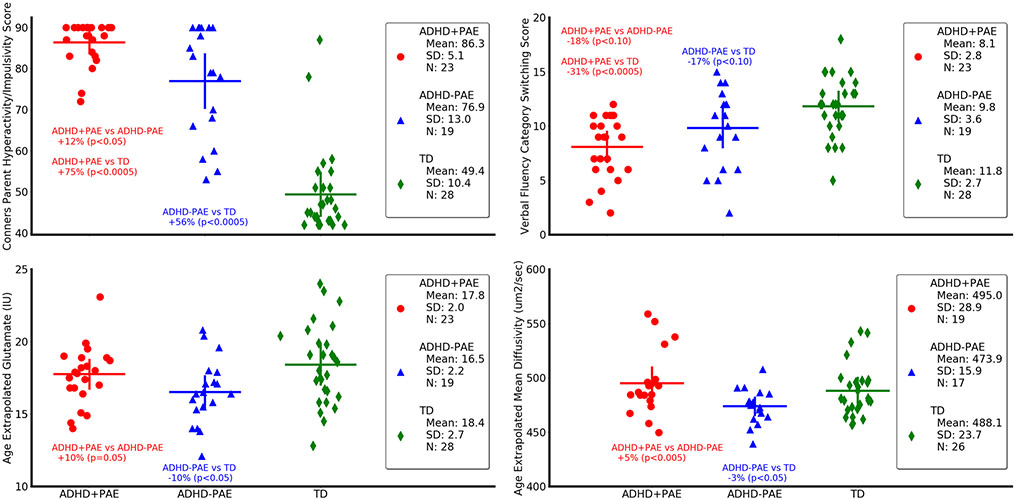
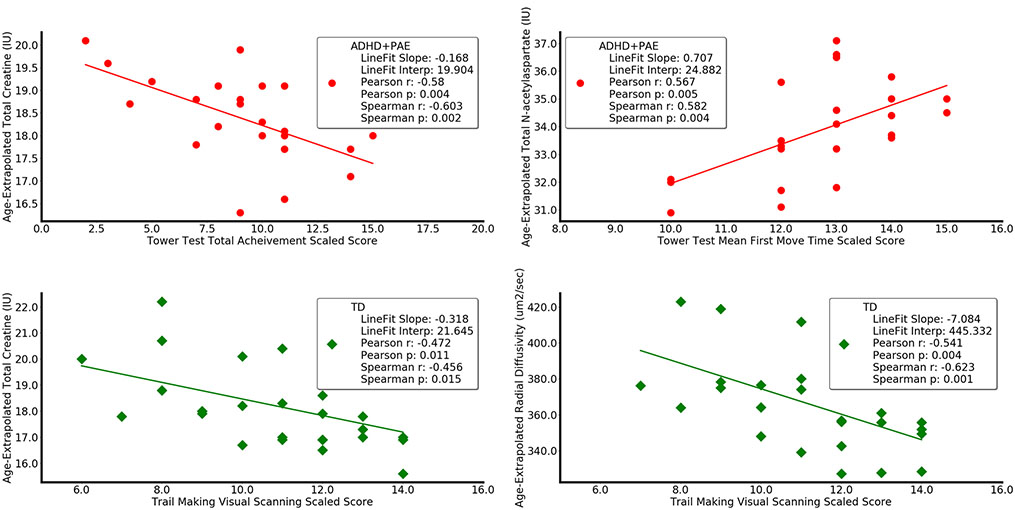
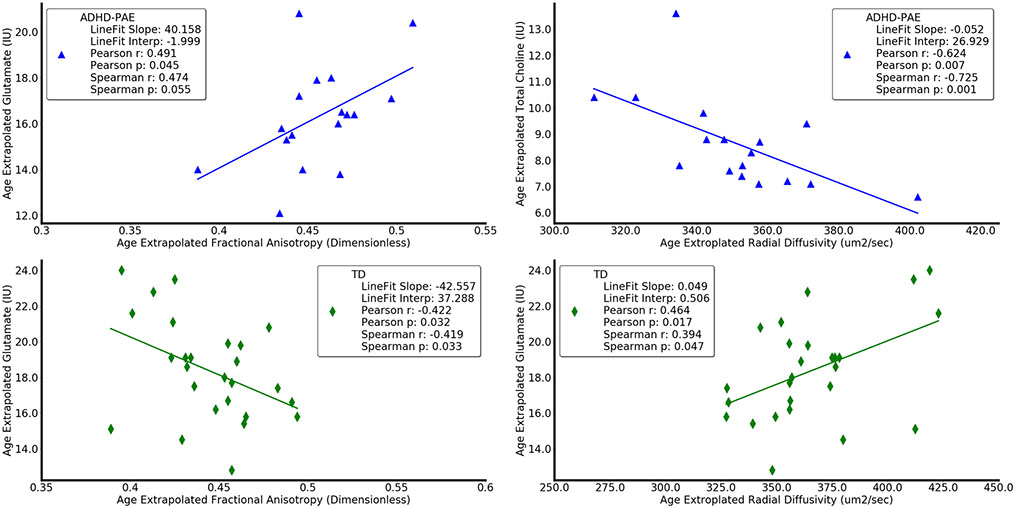
Attention-deficit hyperactivity disorder (ADHD) is common in patients with (ADHD+PAE) and without (ADHD-PAE) prenatal alcohol exposure (PAE). Many patients diagnosed with idiopathic ADHD actually have covert PAE, a treatment-relevant distinction. To improve differential diagnosis, we sought to identify brain differences between ADHD+PAE and ADHD-PAE using neurobehavioral, magnetic resonance spectroscopy, and diffusion tensor imaging metrics that had shown promise in past research. Children 8-13 were recruited in three groups: 23 ADHD+PAE, 19 familial ADHD-PAE, and 28 typically developing controls (TD). Neurobehavioral instruments included the Conners 3 Parent Behavior Rating Scale and the Delis-Kaplan Executive Function System (D-KEFS). Two dimensional magnetic resonance spectroscopic imaging was acquired from supraventricular white matter to measure N-acetylaspartate compounds, glutamate, creatine + phosphocreatine (creatine), and choline-compounds (choline). Whole brain diffusion tensor imaging was acquired and used to to calculate fractional anisotropy, mean diffusivity, axial diffusivity, and radial diffusivity from the same superventricular white matter regions that produced magnetic resonance spectroscopy data. The Conners 3 Parent Hyperactivity/Impulsivity Score, glutamate, mean diffusivity, axial diffusivity, and radial diffusivity were all higher in ADHD+PAE than ADHD-PAE. Glutamate was lower in ADHD-PAE than TD. Within ADHD+PAE, inferior performance on the D-KEFS Tower Test correlated with higher neurometabolite levels. These findings suggest white matter differences between the PAE and familial etiologies of ADHD. Abnormalities detected by magnetic resonance spectroscopy and diffusion tensor imaging co-localize in supraventricular white matter and are relevant to executive function symptoms of ADHD.
Keywords: Attention-deficit hyperactivity disorder; Diffusion tensor imaging; Fetal alcohol spectrum disorder; Magnetic resonance spectroscopy; Tower test; White matter.
© 2021. The Author(s), under exclusive licence to Springer Science+Business Media, LLC, part of Springer Nature.
Conflict of interest statement
Figures
Similar articles
-
Combining neuroimaging and behavior to discriminate children with attention deficit-hyperactivity disorder with and without prenatal alcohol exposure.Brain Imaging Behav. 2022 Feb;16(1):69-77. doi: 10.1007/s11682-021-00477-w. Epub 2021 Jun 5. Brain Imaging Behav. 2022. PMID: 34089460 Free PMC article.
-
Differential neuroimaging indices in prefrontal white matter in prenatal alcohol-associated ADHD versus idiopathic ADHD.Birth Defects Res. 2019 Jul 15;111(12):797-811. doi: 10.1002/bdr2.1460. Epub 2019 Jan 29. Birth Defects Res. 2019. PMID: 30694611 Free PMC article.
-
Impact of prenatal alcohol exposure on intracortical myelination and deep white matter in children with attention deficit hyperactivity disorder.Neuroimage Rep. 2022 Mar;2(1):100082. doi: 10.1016/j.ynirp.2022.100082. Epub 2022 Jan 18. Neuroimage Rep. 2022. PMID: 37284413 Free PMC article.
-
White matter microstructure in fetal alcohol spectrum disorders: A systematic review of diffusion tensor imaging studies.Hum Brain Mapp. 2019 Feb 15;40(3):1017-1036. doi: 10.1002/hbm.24409. Epub 2018 Oct 5. Hum Brain Mapp. 2019. PMID: 30289588 Free PMC article.
-
Research Review: Diffusion tensor imaging studies of attention-deficit/hyperactivity disorder: meta-analyses and reflections on head motion.J Child Psychol Psychiatry. 2018 Mar;59(3):193-202. doi: 10.1111/jcpp.12778. Epub 2017 Jul 3. J Child Psychol Psychiatry. 2018. PMID: 28671333
Cited by
-
Effects of prenatal alcohol exposition on cognitive outcomes in childhood and youth: a longitudinal analysis based on meconium ethyl glucuronide.Eur Arch Psychiatry Clin Neurosci. 2024 Mar;274(2):343-352. doi: 10.1007/s00406-023-01657-z. Epub 2023 Aug 2. Eur Arch Psychiatry Clin Neurosci. 2024. PMID: 37532863 Free PMC article.
-
ADHD and Neuropsychology: Developmental Perspective, Assessment, and Interventions.Ann Neurosci. 2023 Jan;30(1):5-7. doi: 10.1177/09727531231171765. Epub 2023 Jun 8. Ann Neurosci. 2023. PMID: 37313332 Free PMC article. No abstract available.
-
Alcohol Craving and Severity are Associated with Dorsal Anterior Cingulate Choline Levels in Individuals with an Alcohol Use Disorder.Alcohol Alcohol. 2023 May 9;58(3):289-297. doi: 10.1093/alcalc/agad014. Alcohol Alcohol. 2023. PMID: 36939375 Free PMC article.
-
The Role of Choline in Neurodevelopmental Disorders-A Narrative Review Focusing on ASC, ADHD and Dyslexia.Nutrients. 2023 Jun 25;15(13):2876. doi: 10.3390/nu15132876. Nutrients. 2023. PMID: 37447203 Free PMC article. Review.
-
Reduced and delayed myelination and volume of corpus callosum in an animal model of Fetal Alcohol Spectrum Disorders partially benefit from voluntary exercise.Sci Rep. 2022 Jun 23;12(1):10653. doi: 10.1038/s41598-022-14752-3. Sci Rep. 2022. PMID: 35739222 Free PMC article.
References
-
- Alger JR, Stanovich J, Lai J, Armstrong C, Feusner JD, Levitt J, O’Neill J (2016) Performance validation of a new software package for analysis of 1H-MRS. ISMRM Workshop on MR Spectroscopy: From Current Best Practice to Latest Frontiers. Lake Constance, Germany, 14-17 August 2016
-
- American Psychiatric Association; (2013) Diagnostic and statistical manual of mental disorders, 5th edn. Arlington, VA
-
- Aoki Y, Cortese S, Castellanos FX (2018) Research review: Diffusion tensor imaging studies of attention-deficity/hyperactivity disorder: meta-analyses and reflections on head motion. J Child Psychol Psychiatry 59(3):193–202 - PubMed
-
- Astley SJ, Weinberger E, Shaw DW, Richards TL, Clarren SK (1995) Magnetic resonance imaging and spectroscopy in fetal ethanol exposed Macaca nemestrina. Neurotoxicol Teratol 17(5):523–530 - PubMed
Publication types
MeSH terms
Substances
Grants and funding
LinkOut - more resources
Full Text Sources
Other Literature Sources
Medical
Miscellaneous
