

Glial Hedgehog signalling and lipid metabolism regulate neural stem cell proliferation in Drosophila
- PMID: 33751817
- PMCID: PMC8097363
- DOI: 10.15252/embr.202052130
Glial Hedgehog signalling and lipid metabolism regulate neural stem cell proliferation in Drosophila
Abstract
The final size and function of the adult central nervous system (CNS) are determined by neuronal lineages generated by neural stem cells (NSCs) in the developing brain. In Drosophila, NSCs called neuroblasts (NBs) reside within a specialised microenvironment called the glial niche. Here, we explore non-autonomous glial regulation of NB proliferation. We show that lipid droplets (LDs) which reside within the glial niche are closely associated with the signalling molecule Hedgehog (Hh). Under physiological conditions, cortex glial Hh is autonomously required to sustain niche chamber formation. Upon FGF-mediated cortex glial overgrowth, glial Hh non-autonomously activates Hh signalling in the NBs, which in turn disrupts NB cell cycle progression and its ability to produce neurons. Glial Hh's ability to signal to NB is further modulated by lipid storage regulator lipid storage droplet-2 (Lsd-2) and de novo lipogenesis gene fatty acid synthase 1 (Fasn1). Together, our data suggest that glial-derived Hh modified by lipid metabolism mechanisms can affect the neighbouring NB's ability to proliferate and produce neurons.
Keywords: Drosophila; Hedgehog; glial niche; lipid metabolism; neuroblast.
© 2021 The Authors.
Conflict of interest statement
The authors declare that they have no conflict of interest.
Figures
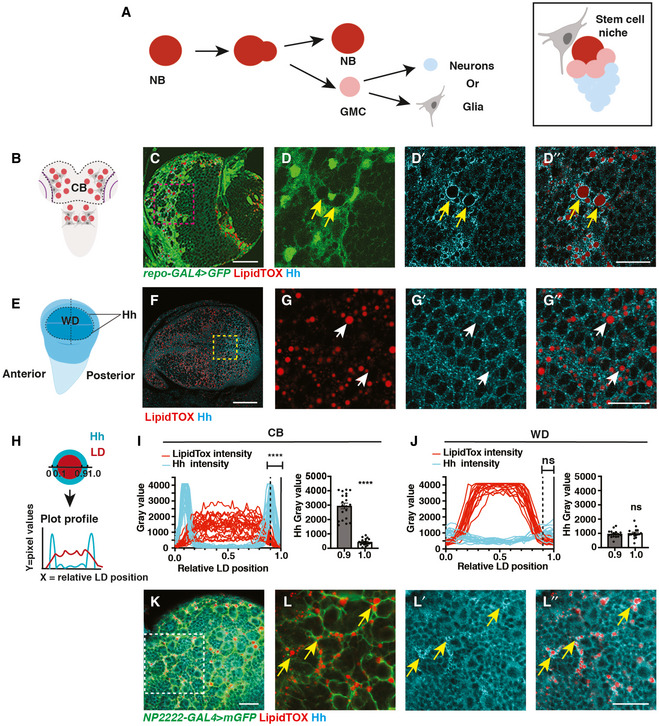
- A
Schematic showing NBs that undergo asymmetric division to self‐renew and produce GMCs, which terminally differentiate to generate post‐mitotic neurons or glial cells (left). Each NB is surrounded by a microenvironment, composed of glial cells (right).
- B–D”
Representative images showing that Hh accumulates on the surface of LDs in glial cells of the CB (yellow arrows), quantified in (I) (n = 20 LDs). Glial cells are marked by repo‐GAL4 > GFP and CB is circled in (B).
- E–G”
In the posterior compartment of the developing wing disc (WD) pouch region where Hh is expressed, LDs and Hh are not tightly associated (white arrows), quantified in (J) (n = 17 LDs).
- H–J
Hh‐LD association is quantified by plotting the pixel intensities of both Hh (cyan) and LDs (red) along a line across LDs. Y‐axis represents grey intensity values, and X‐axis represents relative LD position.
- K, L”
Hh‐LD associations are observed in the cortex glia (yellow arrows, NP2222‐GAL4 > mGFP).
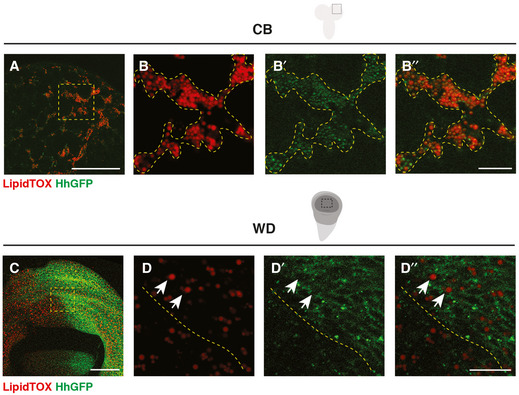
- A–B’’
HhGFP and LDs are associated in the CB glial cells (outlined with yellow dashed lines).
- C–D’’
HhGFP is not associated with LDs in the posterior wing disc (white arrows, the posterior compartment is separated from the anterior with yellow dashed lines).
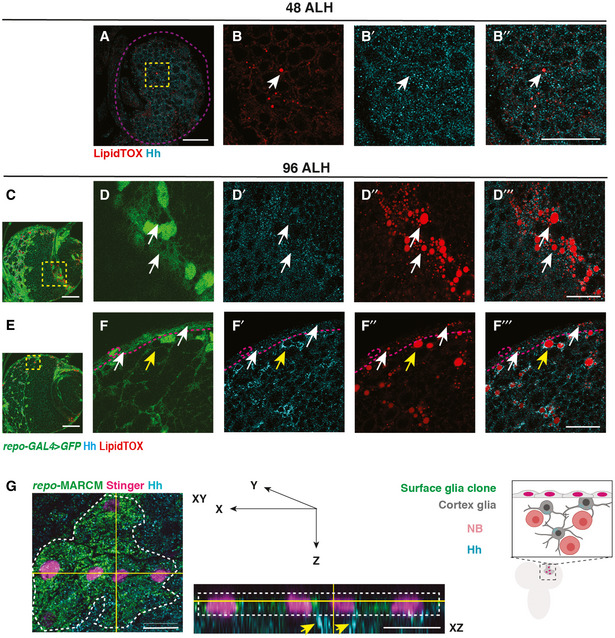
- A–B’’
Hh and LDs are present at low levels at 48 ALH, and do not form specific association (white arrows, brain lobes are circled with purple dashed lines).
- C–D’’’
Hh and LDs are not associated in the optic lobe glial cells (white arrows).
- E–F’’’
Hh and LDs associate only in the cortex glial cells (yellow arrows) but not the surface glial cells (white arrows, surface glia are separated from cortex with magenta dashed lines).
- G
Left and middle panel, representative image showing a surface glial clone (circled with white dashed lines, repo‐MARCM, glial nucleus marked by Stinger in pink). Hh is localised to the cortex glial cells (yellow arrows) underneath the clone marked in green. Right panel, a schematic depicting XZ cross‐section of CB glial cells and their relative position.
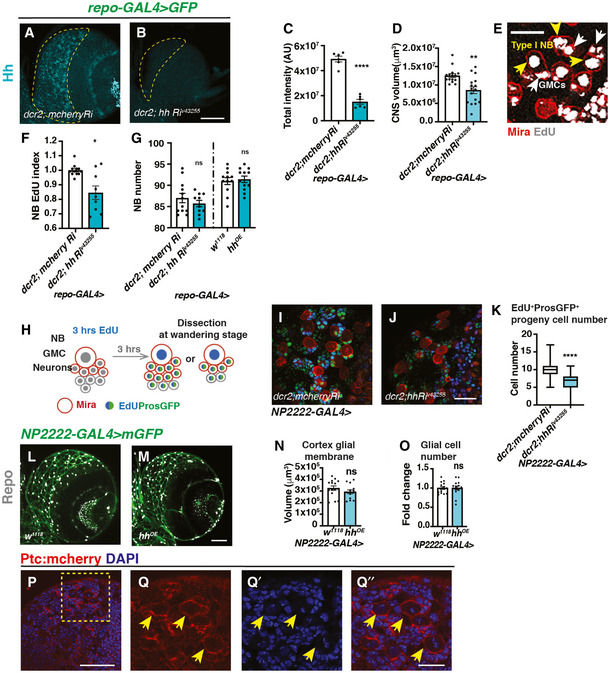
- A–D
Representative images showing pan‐glial Hh knockdown (repo‐GAL4 > GFP with UAS‐dcr2) efficiently reduces Hh staining in the CB (outlined with yellow dashed lines) and brain lobe size, quantified in (C) (n = 6, 6 brain lobes) and (D) (n = 15, 16 brain lobes), respectively.
- E
Representative image from EdU incorporation assays used throughout the manuscript. During a 15 min EdU pulse, type I NB (yellow arrow) and its GMC (white arrow) both incorporate EdU. EdU index quantifications include only EdU+ type I NBs.
- F
Hh knockdown (repo‐GAL4 > GFP with UAS‐dcr2) significantly reduces NB EdU index (n = 12, 9 brain lobes).
- G
Hh knockdown or overexpression in glial cells (repo‐Gal4>) does not significantly alter the number of CB NBs (n = 12, 10; 12, 12 brain lobes).
- H
Schematic depicting EdU pulse‐chase experiment. Larvae are fed with EdU‐containing food for 3 h and then chased with EdU‐free food for 3 h before CNS dissection at wandering stages. NBs and newly generated GMCs are marked with Mira; GMCs and newly generated neurons are marked with ProsGFP.
- I–K
Representative images showing that Hh knockdown in cortex glial cells (NP2222‐GAL4) significantly reduced the number of EdU+ cells that are marked by ProsGFP+, quantified in (K) (Box plot, the boxes extend from the 25th to 75th percentiles; the median is marked by a central band inside the box; and the whiskers go down to the minimum value and up to the maximum value. n = 94, 104 NB lineages imaged from 8, 8 brain lobes, respectively).
- L–O
Representative images showing that Hh overexpression in cortex glial cells (NP2222‐GAL4 > mGFP) does not alter cortex glial membrane size and total Repo+ glial cell numbers, quantified in (N) (n = 15, 14 brain lobes) and (O) (n = 15, 14 brain lobes), respectively.
- P–Q’’
Representative images showing Ptc:mcherry is expressed in NBs (yellow arrows). (Q‐Q’’) are zoomed in images of (P).
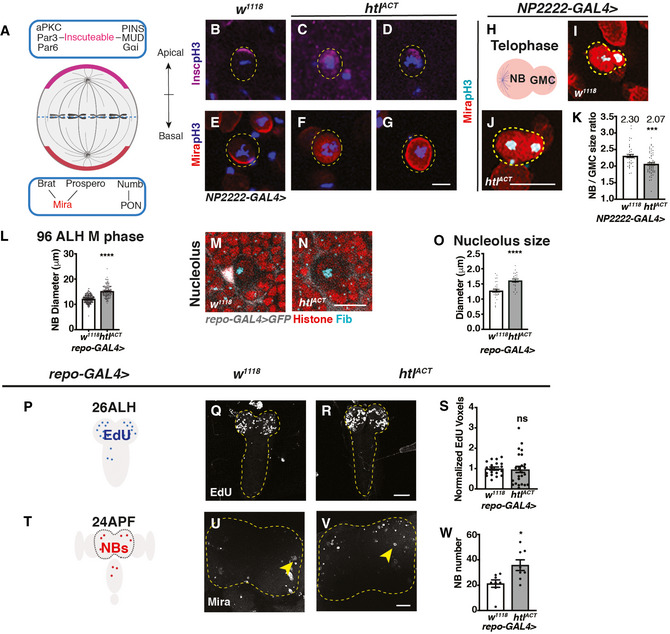
- A
Schematic depicting the distribution of polarity proteins in M phase NBs. Apical polarity proteins include the Par complex (aPKC/Par3/Par6), the PINS/MUD/Gαi complex and the adaptor protein, inscuteable (magenta); basal polarity complex comprises the cell fate determinants Brat/ Pros/ Numb and their adaptor proteins Mira (red) and PON.
- B–G
Representative images showing that in pH3+ NBs, Insc and Mira mislocalise to the cytoplasm or cortex upon FGF activation in cortex glia (NP2222‐GAL4 > htlACT).
- H
Schematic depicting a NB undergoing telophase.
- I–K
Representative images showing that NBs in telophase (Mira+; pH3+) give rise to more size‐symmetric daughter cells upon cortex glial (NP2222‐GAL4>) htlACT overexpression, quantified in (K) (n = 43, 63 NBs from 10, 9 brain lobes, respectively).
- L
Glial (repo‐GAL4>) htlACT overexpression causes an increase in M phase NB diameter (n = 70, 53 NBs from 12, 7 brain lobes, respectively).
- M–O
Representative images showing that NB nucleoli are significantly enlarged upon glial (repo‐GAL4>) htlACT overexpression, quantified in (O) (n = 33, 23 NBs from 9, 7 brain lobes). NBs are marked by Histone (red), surrounded by glial cells (grey, repo‐GAL4 > GFP), nucleoli are marked by Fib (Cyan).
- P–S
Representative images showing that the timing of NB cell cycle entry (visualised by EdU incorporation at 26ALH) is not significantly altered by pan‐glial (repo‐GAL4>) htlACT overexpression, quantified in (S), where EdU voxels are normalised to control (n = 19, 25 brains). The region of interest is outlined in yellow.
- T–W
Representative images showing that the number of CB NBs (Mira+) at 24APF is significantly increased with pan‐glial (repo‐GAL4>) htlACT overexpression, quantified in (W) (n = 8, 8 brains). The region of interest is outlined by yellow dashed lines and NBs are marked with yellow arrows.
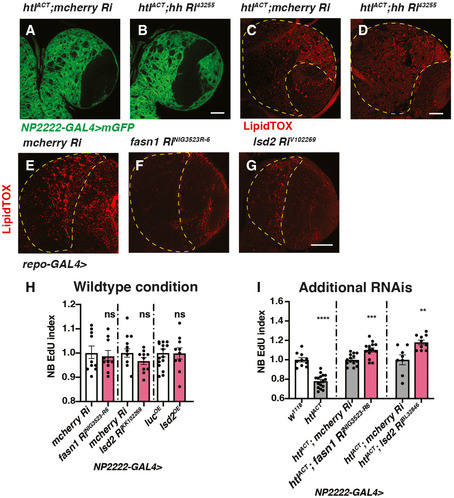
- A–D
Representative images showing that induction of hh RNAi in cortex glial cells with htlACT overexpression do not alter the size of cortex glial membrane (NP2222‐GAL4 > mGFP) nor the number of LDs in CB (outlined by yellow dashed lines).
- E–G
Representative images showing that glial (repo‐GAL4>) induction of RNAis against fasn1 and lsd2 efficiently reduce the number of LDs in CB (outlined by yellow dashed lines).
- H
Knockdown of lipogenesis genes fasn1 and lsd2 or overexpression of lsd2 using a cortex glial driver (NP2222‐GAL4>) do not significantly affect NB EdU index (n = 10, 10; 15, 10; 10, 10 brain lobes).
- I
The NB EdU incorporation defects due to cortex glial (NP2222‐GAL4) overexpression of htlACT is rescued by overexpression of additional RNAis lines against fasn1 and lsd2 (related to Fig 6J; n = 10, 16; 14, 14; 8, 10 brain lobes). The NP2222‐GAL4 > w1118 versus htlACT columns depict the same data as those in Fig 5E.
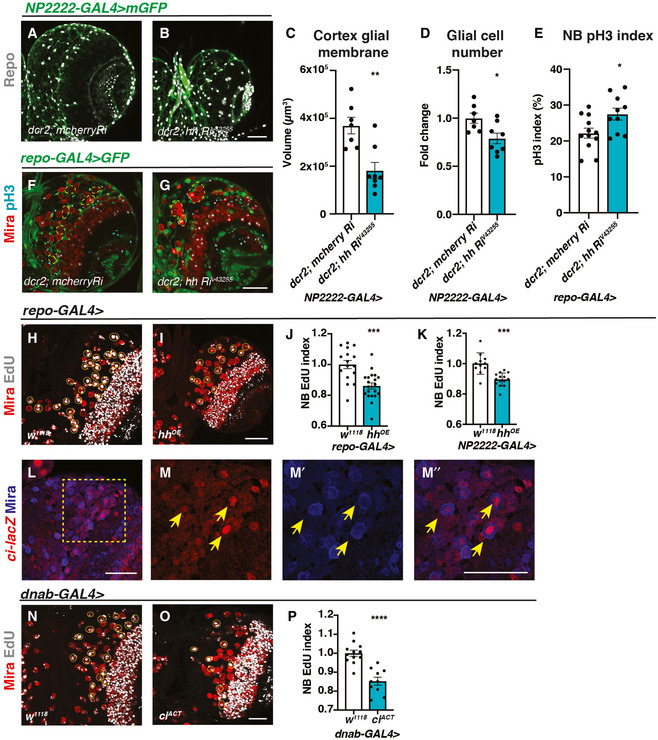
- A–D
Representative images showing that upon knockdown of Hh in cortex glial cells (NP2222‐GAL4 > mGFP with UAS‐dcr2), cortex glial membrane and overall Repo + glial cell number are significantly reduced, quantified in (C) (n = 7, 8 brain lobes) and (D) (n = 7, 8 brain lobes), respectively.
- E–G
Hh knockdown in glia (repo‐GAL4 > GFP) results in niche disruption and clustering of NBs (circled with yellow dashed line), as well as an increase in the percentage of NBs in M phase (pH3+), quantified in (E) (n = 12, 10 brain lobes).
- H–K
Representative images showing that Hh overexpression using pan‐glial (repo‐GAL4) and cortex glial (NP2222‐GAL4) drivers both result in a decrease in NB EdU index, quantified in (J) (n = 16, 20 brain lobes) and (K) (n = 11, 14 brain lobes), respectively.
- L–M”
Representative images showing ci‐lacZ is expressed in NBs (yellow arrows). (M‐M’’) are zoomed in images of (L).
- N–P
Overexpression of ciACT in NBs (dnab‐GAL4) reduces EdU index, quantified in (P) (n = 12, 10 brain lobes).
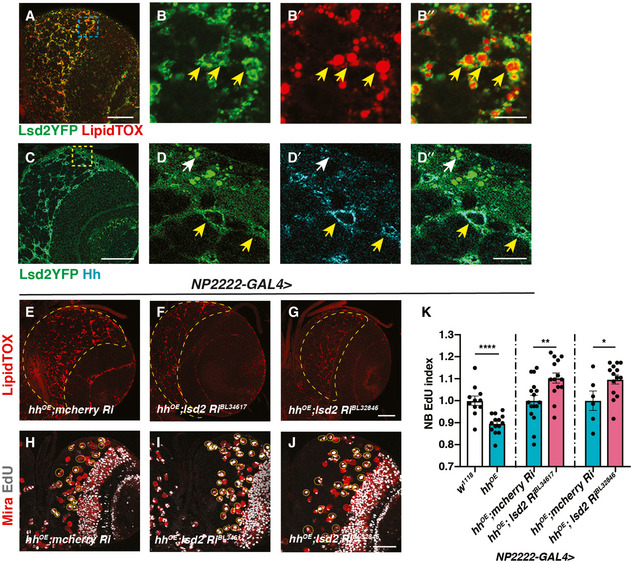
- A–B”
Representative images showing that Lsd2YFP is localised to the surface of LDs (yellow arrows).
- C–D”
Lsd2YFP co‐localises with Hh antibody staining in the cortex glia (yellow arrows) but not surface glial cells (white arrow).
- E–G
Lsd‐2 knockdown in cortex glial cells (NP2222‐GAL4) where hh is overexpressed effectively reduces LD number in CB (outlined in yellow dashed lines).
- H–K
Representative images showing that NB EdU index is rescued upon Lsd‐2 knockdown in cortex glial cells (NP2222‐GAL4) where hh is overexpressed, quantified in (K) (n = 11, 14; 16, 14; 6, 14 brain lobes). The NP2222‐GAL4 > w1118 versus hhOE columns depict the same data as Fig 2K. EdU+ NBs are circled with yellow, dashed lines.
- A–D’
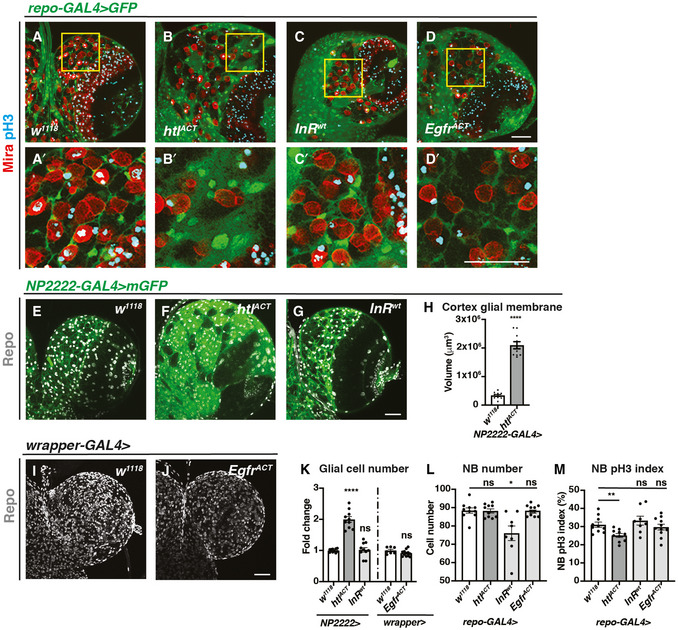
Representative images showing that pan‐glial overexpression of htlACT, but not InRwt or EgfrACT causes an expansion of cortex glia that enwraps NBs. Glial cells are marked with repo‐GAL4 > GFP, and NBs are marked with Mira. (A’, B’, C’ and D’) are zoomed in images of (A, B, C and D), respectively.
- E–K
Representative images showing that cortex glial overexpression of htlACT but not InRwt or EgfrACT causes an increase in glial cell (Repo+) numbers and cortex glial membrane size, quantified in (K) (n = 10, 10, 10; 7, 12 brain lobes) and (H) (n = 10, 10 brain lobes), respectively. NP2222‐GAL4 > mGFP is used to mark cortex glial membrane in (E‐G) and wrapper‐GAL4 > is used in (I, J).
- L
Glial (repo‐GAL4>) overexpression of InRwt but not htlACT or EgfrACT significantly reduces the number of CB NBs (n = 10, 10, 8, 11 brain lobes).
- M
Glial (repo‐GAL4>) overexpression of htlACT but not InRwt or EgfrACT significantly reduces the pH3 index of CB NBs (marked with Mira and pH3 in (A‐D’)) (n = 10, 10, 8, 11 brain lobes).
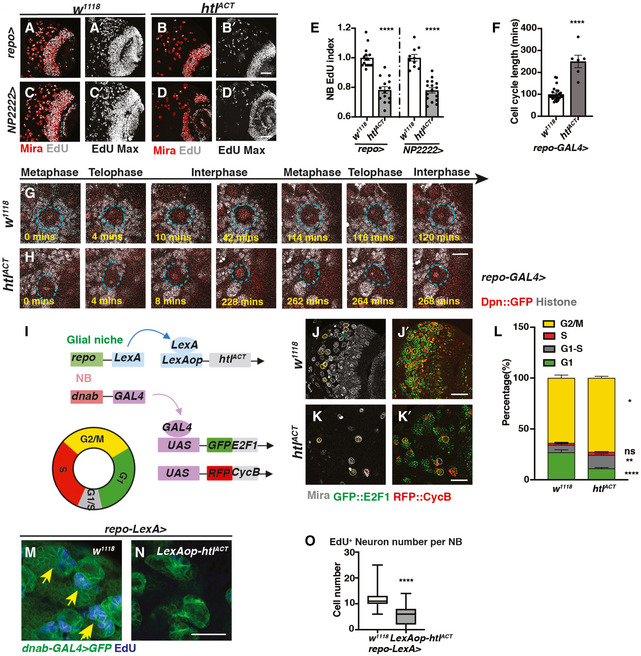
- A–E
Representative images showing that both pan‐glial (repo‐GAL4>) and cortex glial (NP2222‐GAL4>) htlACT overexpression significantly reduce NB EdU index, quantified in (E) (n = 15, 14; 10, 16 brain lobes). (A, B, C, D) are single sections with Mira and EdU staining, and (A’, B’ C’, D’) are Z‐projection of the EdU staining.
- F–H
Representative still images from ex vivo CNS live imaging at 72ALH showing that pan‐glial (repo‐GAL4) htlACT overexpression lengthens NB cell cycle, quantified in (F) (n = 25, 6 NBs imaged from three brains per genotype). The cell cycle length is measured as the length between consecutive divisions. NBs (Dpn::GFP, red; Histone RFP, grey) are circled with blue dashed lines.
- I
Schematic depicting concurrent glial FGF activation (repo‐LexA > LexAop‐htlACT), and NB overexpression of fly‐FUCCI (dnab‐GAL4 > UAS‐GFP::E2F1, UAS‐RFP::CycB). The fly‐FUCCI system utilises the fusion protein GFP::E2F1 (a marker for cells in G2, M and G1 phase) and RFP::CycB ( a marker for cells in S, G2, M phase) to monitor cell cycle progression. Cells in G1 phase are GFP+ RFP‐ (green), cells in G2/ M phase are GFP+RFP+ (yellow), and cells in S phase are GFP‐RFP+ (red), whereas cells in G1‐S transition are weakly labelled by both GFP and RFP (grey).
- J–L
Representative images showing that the percentage of NBs in G1‐S transition and G2/M phase are both significantly increased with significantly less cells remaining in G1 phase, quantified in (L) (n = 9, 10 brain lobes). NBs in G1 phase (Mira+, GFP+) are circled by green dashed lines; NBs in G1‐S transition (Mira+, GFP‐RFP‐) are circled by grey dashed lines; NBs in S phase (Mira+, RFP+) are circled by red dashed lines, and NBs in G2/M phase (Mira+, GFP+RFP+) are circled by yellow dashed lines.
- M–O
Representative images showing that the number of EdU+ neurons generated per NB is significantly reduced upon pan‐glial overexpression of FGF (repo‐LexA > LexAop‐htlACT; yellow arrows), quantified in (O) (Box plot, the boxes extend from the 25th to 75th percentiles; the median is marked by a central band inside the box; and the whiskers go down to the minimum value and up to the maximum value. n = 94, 127 NB lineages imaged from five and seven brain lobes, respectively). NB lineages are marked with dnab‐gal4 > GFP.
- A
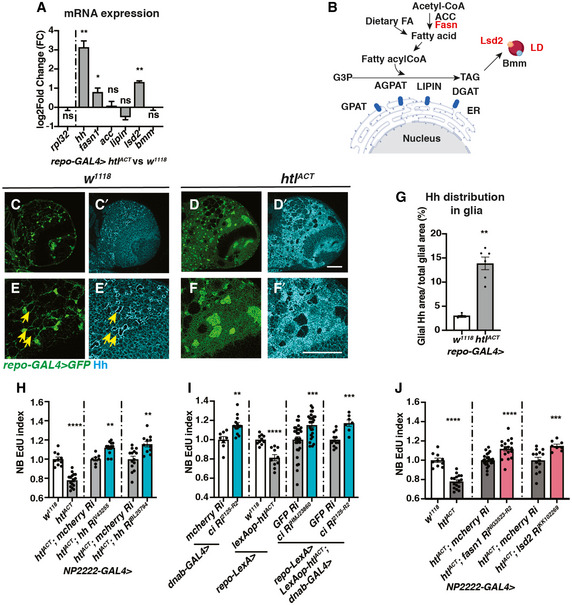
Pan‐glial (repo‐GAL4) htlACT overexpression causes upregulation of hh, fasn1 and lsd2 transcripts (n = 3 biological replicates pooled from 20 brains for each genotype; for each biological replicate, we ran three technical replicates for each PCR reaction). The lipogenesis genes (acc, lipin), and lipolysis gene bmm transcripts are not significantly altered. We utilised rpl32 as a reference gene in these experiments, as it is not altered by htlACT overexpression. The data are represented by log2‐fold change relative to the control (repo‐GAL4 > w1118).
- B
Schematic depicting lipogenesis and lipolysis. Lipogenesis begins with de novo synthesis of fatty acids by carboxylation of cytosolic acetyl‐CoA via acetyl‐CoA carboxylase (ACC) and elongation of fatty chain via fatty acid synthase (Fasn, red). Dietary‐derived and de novo‐generated fatty acids are converted into fatty acylCoA, which re‐localises to ER and participates in triglyceride (TAG) synthesis with glycerol‐3 phosphate (G3P). This process is mediated by a series of enzymes: glycerol‐3‐phosphate acyltransferase (GPAT), acylCoA acylglycerol‐3‐phasphte acyltransferases (AGPAT), Lipin (a phosphatidate phosphatase) and diacylglycerol acyltransferase (DGAT, red). TAG is translocated from the ER to the core of the intracellular organelles called LDs. On the surface of LDs, a triglyceride lipase called Brummer (Bmm), and its inhibitor Lsd‐2, antagonistically control TAG storage.
- C–G
Representative images showing that Hh staining normally localised to a ring‐like structure (yellow arrows), becomes delocalises to the glial cytoplasm upon htlACT overexpression, quantified in (E) (n = 4, 6 brain lobes). Glial cells are marked with repo‐GAL4 > GFP. (E‐F’) are zoomed in images of (C‐D’).
- H
Cortex glial (NP2222‐GAL4>) overexpression of two independent hh RNAis significantly rescue EdU incorporation defects caused by htlACT overexpression (n = 10, 16; 7, 12; 14, 11 brain lobes). The NP2222‐GAL4 > w1118 versus htlACT columns depict the same data as those in Fig 5E.
- I
Knockdown of NB Hh signalling pathway (dnab‐GAL4 > UAS‐ciRNAi) rescues NB EdU incorporation defects induced by glial htlACT overexpression (repo‐LexA > LexAop‐htlACT). Induction of ciRNAi in NBs alone increases NB EdU incorporation (n = 8, 13; 10, 10; 30, 26; 12, 7 brain lobes).
- J
The NB EdU incorporation defects due to cortex glial (NP2222‐GAL4>) overexpression of htlACT is significantly rescued by overexpression of RNAis against fasn1 and lsd2, compared to corresponding control RNAis (n = 10, 16; 25, 17; 14, 8 brain lobes). The NP2222‐GAL4 > w1118 versus htlACT columns depict the same data as those in Fig 5E. The control column for htlACT; lsd2 RiKK102269 depicts the same data as the control column for htlACT; hh RiBL25794 in Fig 6H.
- A
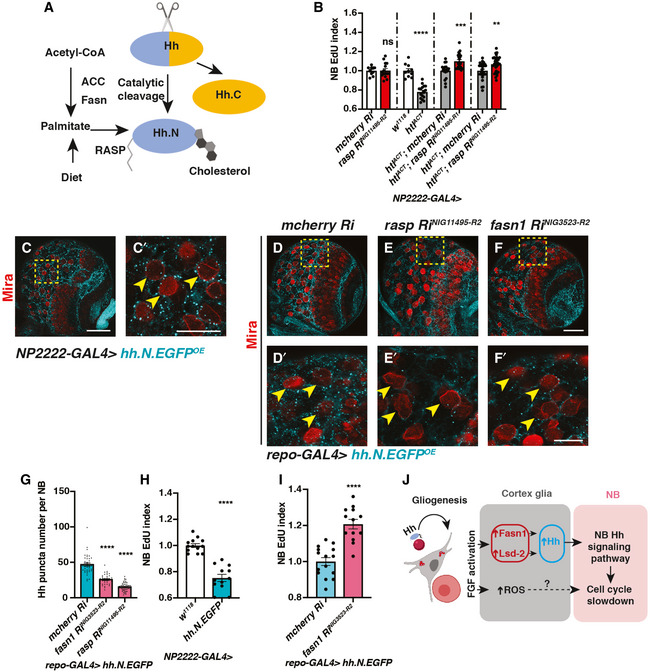
Schematic depicting Hh auto‐processing, which starts with the cleavage of the protein into a C‐terminal part (Hh.C, yellow) and a N‐terminal part (Hh.N, blue), with simultaneous covalent addition of cholesterol. Palmitate, from either diet or de novo lipogenesis (via ACC and Fasn), is added onto Hh‐N, in a reaction catalysed by an acyltransferase, encoded by rasp.
- B
Inhibition of palmitoylation (via two independent rasp RNAis) rescues NB EdU incorporation defects induced by cortex glial (NP2222‐GAL4>) htlACT overexpression, whilst knockdown of Rasp in cortex glial cells alone does not alter NB EdU index (n = 10, 15; 10, 16; 18, 21; 26, 29 brain lobes). The NP2222‐GAL4 > w1118 versus htlACT columns depict the same data as those in Fig 5E.
- C–C’
Representative images showing that Hh.N.EGFP (which cannot undergo cholesterol modification) are found as puncta on the surface of NBs (yellow arrows) when overexpressed in neighbouring cortex glial cells (NP2222‐GAL4>).
- D–G
Representative images showing that knockdown of Fasn1 in glial cells (repo‐GAL4>), where Hh.N.EGFP is overexpressed, significantly reduces the number of Hh.N.EGFP puncta on the surface of NBs (yellow arrows), phenocopying the effect of Rasp knockdown, quantified in (G) (n = 38, 38, 57 NBs from 4, 4, 8 brain lobes, respectively).
- H
Cortex glial (NP2222‐GAL4>) overexpression of Hh.N.EGFP significantly reduces NB EdU incorporation (n = 13,12 brain lobes).
- I
Knockdown of Fasn1 in glial cells rescues NB EdU incorporation defects, caused by glial Hh.N.EGFP overexpression, quantified in (I) (n = 15, 13 brain lobes).
- J
Schematic depicting our working model. During development, Hh tethered to LDs are localised to cortex glial cells, to activate gliogenesis. Non‐autonomously, excessive glial Hh inhibits NB cell cycle progression. Upon cortex glial‐specific FGF activation, increased Hh modified by Fasn1 and Lsd‐2 together with increased ROS prevent NB proliferation.
References
-
- Akkouche A, Mugat B, Barckmann B, Varela‐Chavez C, Li B, Raffel R, Pelisson A, Chambeyron S (2017) Piwi Is Required during Drosophila embryogenesis to license dual‐strand piRNA clusters for transposon repression in adult ovaries. Mol Cell 66: 411–419 e414 - PubMed
-
- Anderson PR, Kirby K, Hilliker AJ, Phillips JP (2005) RNAi‐mediated suppression of the mitochondrial iron chaperone, frataxin, in Drosophila . Hum Mol Genet 14: 3397–3405 - PubMed
Publication types
MeSH terms
Substances
LinkOut - more resources
Full Text Sources
Other Literature Sources
Molecular Biology Databases
Research Materials
Miscellaneous
