Comparative Study
. 2021 Jul 6;186(3):1660-1678.
doi: 10.1093/plphys/kiab142.

GRAS-domain transcription factor PAT1 regulates jasmonic acid biosynthesis in grape cold stress response

Affiliations
Comparative Study

GRAS-domain transcription factor PAT1 regulates jasmonic acid biosynthesis in grape cold stress response

Zemin Wang et al. Plant Physiol. .

Abstract

Cultivated grapevine (Vitis) is a highly valued horticultural crop, and cold stress affects its growth and productivity. Wild Amur grape (Vitis amurensis) PAT1 (Phytochrome A signal transduction 1, VaPAT1) is induced by low temperature, and ectopic expression of VaPAT1 enhances cold tolerance in Arabidopsis (Arabidopsis thaliana). However, little is known about the molecular mechanism of VaPAT1 during the cold stress response in grapevine. Here, we confirmed the overexpression of VaPAT1 in transformed grape calli enhanced cold tolerance. Yeast two-hybrid and bimolecular fluorescence complementation assays highlighted an interaction between VaPAT1 with INDETERMINATE-DOMAIN 3 (VaIDD3). A role of VaIDD3 in cold tolerance was also indicated. Transcriptome analysis revealed VaPAT1 and VaIDD3 overexpression and cold treatment coordinately modulate the expression of stress-related genes including lipoxygenase 3 (LOX3), a gene encoding a key jasmonate biosynthesis enzyme. Co-expression network analysis indicated LOX3 might be a downstream target of VaPAT1. Both electrophoretic mobility shift and dual luciferase reporter assays showed the VaPAT1-IDD3 complex binds to the IDD-box (AGACAAA) in the VaLOX3 promoter to activate its expression. Overexpression of both VaPAT1 and VaIDD3 increased the transcription of VaLOX3 and JA levels in transgenic grape calli. Conversely, VaPAT1-SRDX (dominant repression) and CRISPR/Cas9-mediated mutagenesis of PAT1-ED causing the loss of the C-terminus in grape calli dramatically prohibited the accumulation of VaLOX3 and JA levels during cold treatment. Together, these findings point to a pivotal role of VaPAT1 in the cold stress response in grape by regulating JA biosynthesis.


Figures

Figure 1
Figure 1
Overexpression of VaPAT1 enhances cold tolerance in transgenic grape calli. A, Cold tolerance evaluation system of grapevine calli. After placing the calli on the thermoelectric modules (TEMs), exotherms were identified manually from a plot of thermistor output (x-axis) versus loaded TEM output minus the empty TEMs output (y-axis). The LTEs (indicating the cell freeze temperatures) were obtained to evaluate the cold tolerance. B, LTEs of transgenic grapevine calli. C, Electrolyte leakage of each line treated at 4°C, 4 h and −4°C, 1 h, respectively. The error bars indicate the SD from triplicate technical repeats. The letters above the bars indicate significant differences (P <0.05, according to Duncan’s multiple range test).
Figure 2
Figure 2
VaPAT1 interacts with VaIDD3. A, VaPAT1 protein structural representation in (B). B, Analysis of VaPAT1 and VaIDD3 transactivation activity. VaPAT1 (full length), D1 (N-terminal only) and D2 (C-terminal only), each fused with GAL4 DNA-BD protein were expressed in yeast. The transactivation activity was revealed through the expression of the lacZ reporter gene (β-galactosidase activity). Vectors pGBKT7 and pGBKT7-53 + pGADT7-Rec2-53 were expressed in yeast as a negative (N) and a positive (P) control, respectively. C, Y2H assay showing VaPAT1 and VaIDD3 interaction. P and N indicate the positive and negative control, respectively. D, In vivo interactions between VaPAT1 and VaIDD3 proteins by BiFC assays in N. benthamiana leaf cells. The reconstitution of YFP is shown. Scale bars, 100 μm.
Figure 3
Figure 3
Comparative transcriptome analysis of grapevine Cold (4EV), OE-VaPAT1 (PAT1), and OE-VaIDD3 (IDD3) DE genes. A, Enriched BIN categories (FDR < 0.05, BIN depth ≤ 1). The circle size and the circle color depict the number of genes in each enriched category and the parent BIN category of each BIN, respectively. Enrichment scores (expressed as—log10 FDR) for each BIN category are shown. Red and blue colors indicate upregulated and downregulated genes, respectively. B, Simplified scheme of two alternative plant JA biosynthesis pathways. Only differentially expressed pathway genes are indicated. See main text for gene accessions. Pathway constituents (indicated in gray text) are 18:3, α-linolenic acid; 16:3, hexadecatrienoic acid; 13-HPOT, (13S)-hydroperoxyoctadecatrienoic acid; 12,13-EOT, 12,13(S)-epoxy-octadecatrienoic acid; OPC-6, 6-(3-oxo-2-(pent-2-enyl)cyclopentyl)hexanoic acid; OPC-4, 4-(3-oxo-2-(pent-2-enyl)cyclopentyl)butanoic acid; dnOPDA, dinor-OPDA; tnOPDA, tetranor-OPDA; 4,5-ddhJA, 4,5-didehydro-JA; JA-Ile, JA-Isoleucine; and 12-OH-JA-Ile, 12-Hydroxy-JA-Ile. The bioactive JA (JA-Ile) is indicated in red text. Black and blue pathway arrows define the octadecanoid and parallel hexadecanoid pathway, respectively. Asterisks denote significant DE (absolute log2 FC > 1, FDR < 0.05) between contrast. LOX, lipoxygenase; OPR, OPDA reductase; CYP94B3, JA-Ile-12-hydroxylase. C, Proportion of DEGs containing the IDD-box (VGACAAA, V = A/C/G) CRE in the promoter region of 4EV, OE-VaPAT1, OE-VaIDD3 DE genes. *FDR < 5.0E−02, **FDR between 1.0E−02 and 1.0E−03, and ***FDR < 4.0E−04 indicate significantly enriched CRE.
Figure 4
Figure 4
Integrated gene co-expression subnetwork of grape PAT1. Node border color depicts common MapMan functional categories of co-expressed genes. Pie charts alongside the grapevine genes (right) represent the presence of IDD-box (VGACAAA, V = A/C/G) consensus CREs in the promoters of each corresponding gene. Blue, red, green, and node pie chart colors depict AGACAAA, GGACAAA, and CGACAAA CREs, respectively. The node shape depicts the co-expression relationship (light orange and blue edges) supported by both microarray and RNA-seq data (hexagon), microarray data only (diamond), and RNA-seq data only (square). Functional categories are represented by border color. Node size indicates connectivity. Gene labels in red depict consistent upregulation in at least one treatment (i.e. 4EV, OE-VaPAT1, or OE-VaIDD3 lines).
Figure 5
Figure 5
VaIDD3 bind to the IDD-box (AGACAAA) and VaPAT1/VaIDD3 complex promotes VaLOX3 transcription. A, Structure of the VaLOX3 promoter regions. IDD-box (AGACAAA) was identified at the −557 to −551 bp promoter position. B, Y1H analysis, using pGADT7-VaIDD3 as the prey, p3*IDDBox-AbAi, and p3*mIDDBox-AbAi as the baits and pGADT7-p53 and p53-AbAi as the positive controls. C, EMSA analysis of VaIDD3 binding to the VaLOX3 promoter. The 59-bp VaLOX3 promoter was labeled with biotin as the probe (Biotin-ProVaLOX3). The competition assay was performed using 10× unlabeled VaLOX3 promoter DNA (10× ProVaLOX3). The sequence of the biotin-labeled probe is shown and the IDD-box (AGACAAA) motif is highlighted in bold. D–F, LUC activity analysis, using 35S::VaPAT1 and 35S::VaIDD3 as the effector and pLOX3:LUC as reporters. The EV + PVaLOX3::LUC (#a) as the control. In (E), bar: 1 cm. The error bars indicate the SD from triplicate technical repeats. The letters above the bars indicate significant differences (P <0.05, according to Duncan’s multiple range test).
Figure 6
Figure 6
Overexpression of VaPAT1 upregulates LOX3 expression and enhances JA accumulation during cold stress. A, Expression levels of PAT1 in transgenic lines. B, Expression levels of LOX3 during cold stress in transgenic lines. C, JA-Ile content in callus of EV, OE-VaPAT1, VaPAT1-SRDX, and OE-VaIDD3 lines under normal condition (Control) and cold-treated (Cold, 4°C, 4 h), respectively. D, LTEs of wild-type 41B callis grown in liquid GM medium or GM medium containing 3, 5, or 10 μM MeJA. The error bars indicate the SD from triplicate technical repeats. The letters above the bars indicate significant differences (P <0.05, according to Duncan’s multiple range test).
Figure 7
Figure 7
The PAT1-ED revealed reduced expression of LOX3 and decreased cold tolerance. A, LTEs of 41B (WT), EV, and PAT1-ED (PAT1 mutants encoding truncated PAT1 lacking the C-terminal region, a loss-of-function mutation) lines. The error bars indicate the SD from three biological repeats and the letters above the bars indicate significant differences (P <0.05, according to Duncan’s multiple range test). B, Expression levels of LOX3 in PAT1-ED line. The error bars indicate the SD from three biological repeats and asterisk indicates significant differences from the wild-type plants. *P <0.01 (Student’s t test). C, JA-Ile content in callus of 41B/WT and PAT1-ED lines under normal condition (Control) and cold-treated (Cold, 4°C, 4 h), respectively. The error bars indicate the SD from three biological repeats and asterisk indicates significant differences from the wild-type plants. *P <0.05 (Student’s t test).
Figure 8
Figure 8
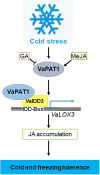
Model of VaPAT1 TF action during grape cold stress identified in this work. The model indicates that the cold stress-induced increase of VaPAT1 upregulates VaLOX3 expression (by forming a complex with IDD3) and increases JA accumulation, resulting in the transcriptional activation of stress-inducible genes and enhanced cold tolerance of grapevine. MeJA, methyl jasmonate.

Similar articles

Cited by

References

    1. Ba L, Jianfei K, Chen J, Lu W (2016) MaJAZ1 attenuates the MaLBD5-mediated transcriptional activation of jasmonate biosynthesis gene MaAOC2 in regulating cold tolerance of banana fruit. J Agric Food Chem 64:738–745 - PubMed
    1. Bolger AM, Lohse M, Usadel B (2014) Trimmomatic: a flexible trimmer for Illumina sequence data. Bioinformatics 30:2114–2120 - PMC - PubMed
    1. Bolle C (2004) The role of GRAS proteins in plant signal transduction and development. Planta 218:683–692 - PubMed
    1. Böttcher C, Burbidge CA, di Rienzo V, Boss PK, Davies C (2015) Jasmonic acid-isoleucine formation in grapevine (Vitis vinifera L.) by two enzymes with distinct transcription profiles. J Integr Plant Biol 57:618–627 - PubMed
    1. Chai F, Liu W, Xiang Y, Meng X, Sun X, Cheng C, Liu G, Duan L, Xin H, Li S (2019) Comparative metabolic profiling of Vitis amurensis and Vitis vinifera during cold acclimation. Hortic Res 6 - PMC - PubMed

Publication types

LinkOut - more resources