. 2022 May 6;118(6):1492-1505.
doi: 10.1093/cvr/cvab112.

Loss of autophagy protein ATG5 impairs cardiac capacity in mice and humans through diminishing mitochondrial abundance and disrupting Ca2+ cycling

Affiliations

Loss of autophagy protein ATG5 impairs cardiac capacity in mice and humans through diminishing mitochondrial abundance and disrupting Ca2+ cycling

Senka Ljubojević-Holzer et al. Cardiovasc Res. .

Abstract

Aims: Autophagy protects against the development of cardiac hypertrophy and failure. While aberrant Ca2+ handling promotes myocardial remodelling and contributes to contractile dysfunction, the role of autophagy in maintaining Ca2+ homeostasis remains elusive. Here, we examined whether Atg5 deficiency-mediated autophagy promotes early changes in subcellular Ca2+ handling in ventricular cardiomyocytes, and whether those alterations associate with compromised cardiac reserve capacity, which commonly precedes the onset of heart failure.

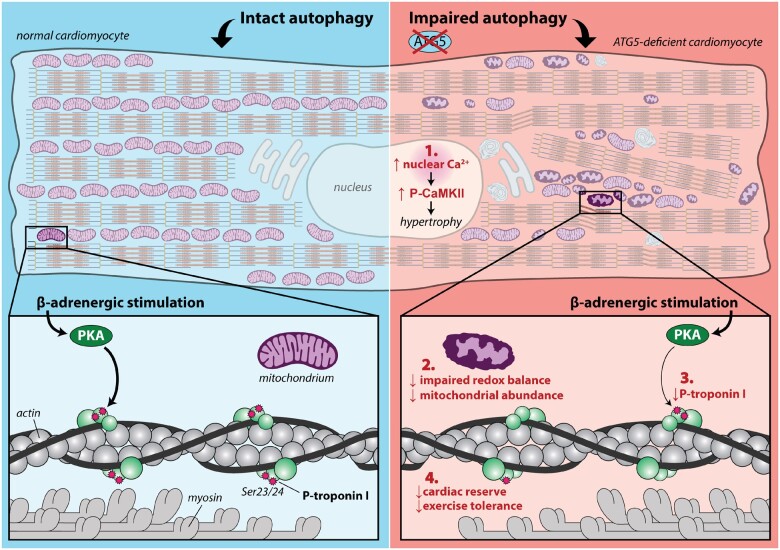
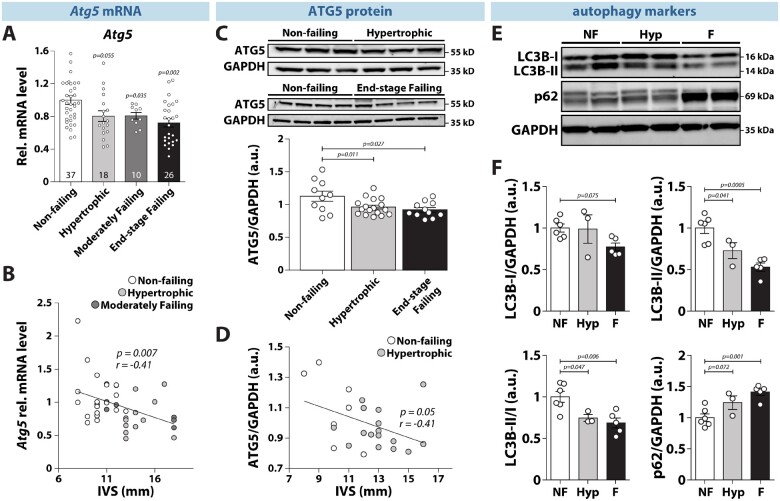
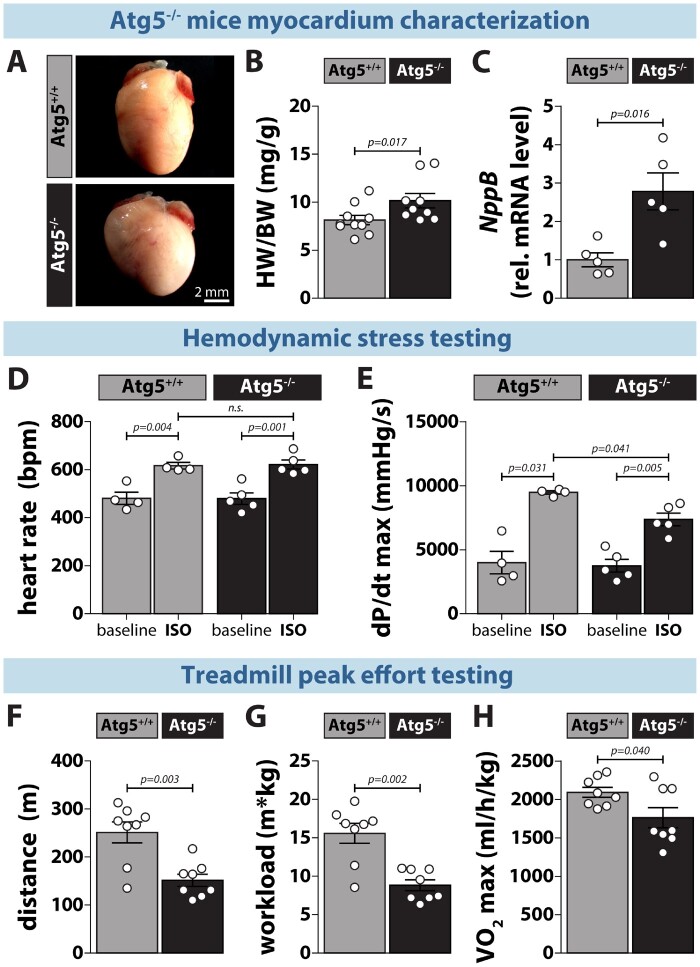
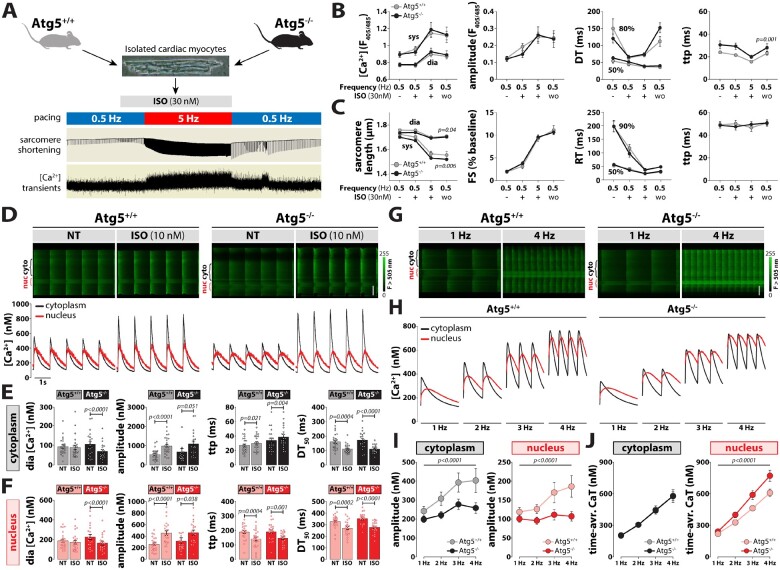
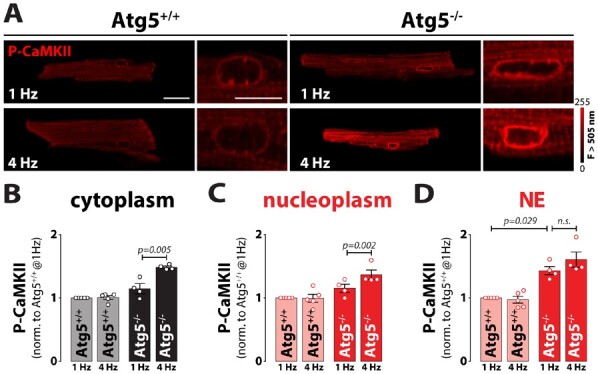
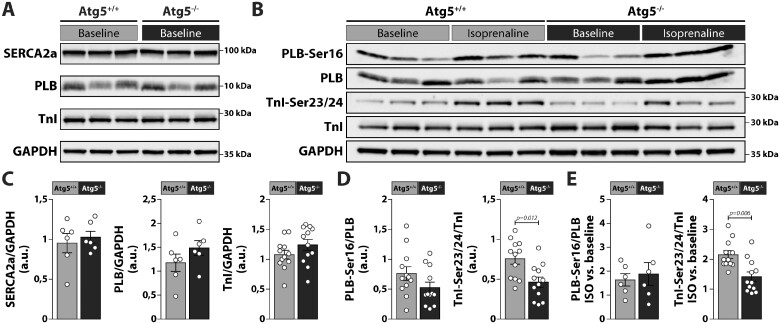
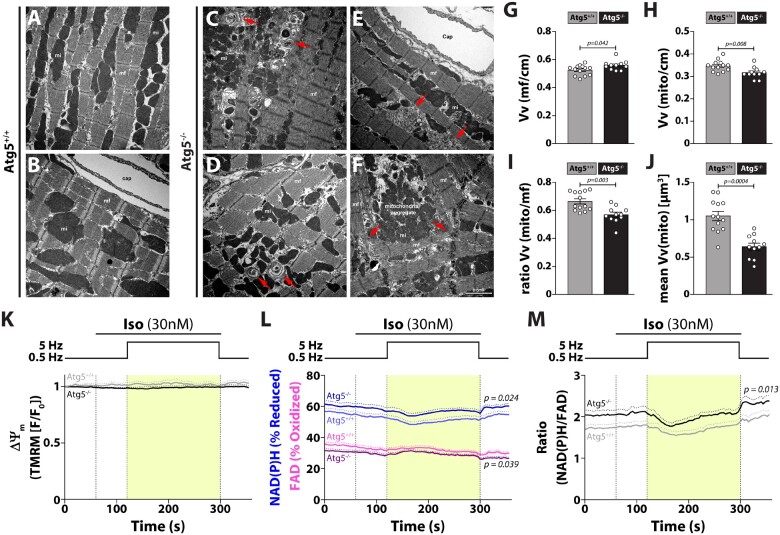
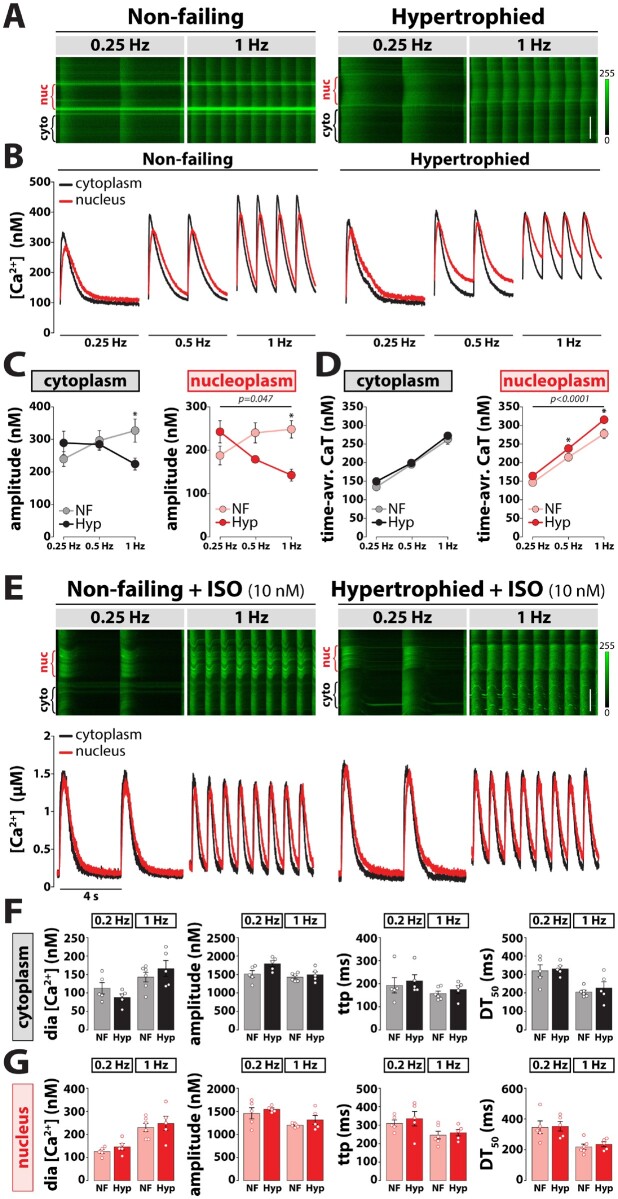
Methods and results: RT-qPCR and immunoblotting demonstrated reduced Atg5 gene and protein expression and decreased abundancy of autophagy markers in hypertrophied and failing human hearts. The function of ATG5 was examined using cardiomyocyte-specific Atg5-knockout mice (Atg5-/-). Before manifesting cardiac dysfunction, Atg5-/- mice showed compromised cardiac reserve in response to β-adrenergic stimulation. Consequently, effort intolerance and maximal oxygen consumption were reduced during treadmill-based exercise tolerance testing. Mechanistically, cellular imaging revealed that Atg5 deprivation did not alter spatial and functional organization of intracellular Ca2+ stores or affect Ca2+ cycling in response to slow pacing or upon acute isoprenaline administration. However, high-frequency stimulation exposed stunted amplitude of Ca2+ transients, augmented nucleoplasmic Ca2+ load, and increased CaMKII activity, especially in the nuclear region of hypertrophied Atg5-/- cardiomyocytes. These changes in Ca2+ cycling were recapitulated in hypertrophied human cardiomyocytes. Finally, ultrastructural analysis revealed accumulation of mitochondria with reduced volume and size distribution, meanwhile functional measurements showed impaired redox balance in Atg5-/- cardiomyocytes, implying energetic unsustainability due to overcompensation of single mitochondria, particularly under increased workload.

Conclusion: Loss of cardiac Atg5-dependent autophagy reduces mitochondrial abundance and causes subtle alterations in subcellular Ca2+ cycling upon increased workload in mice. Autophagy-related impairment of Ca2+ handling is progressively worsened by β-adrenergic signalling in ventricular cardiomyocytes, thereby leading to energetic exhaustion and compromised cardiac reserve.

Keywords: Autophagy; Beta-adrenergic signalling; Calcium; Cardiomyocytes; Mitochondria.


Figures

None
Graphical abstract
Figure 1
Figure 1
Reduced gene and protein expression of Atg5 and impaired cardiac autophagy in hypertrophic and failing human hearts. (A) ATG5 expression in left ventricular tissue from non-failing, hypertrophied, moderately failing and end-stage failing human myocardium. Number of hearts per group is shown in each bar. (B) Regression analysis of ATG5 expression levels and thickness of interventricular septum (IVS) from non-failing, hypertrophied, and moderately failing human hearts (N = 23/12/6 hearts, respectively). (C) ATG5 protein expression in left ventricular tissue from non-failing, hypertrophied, and end-stage failing human ventricular tissue (N = 10/17/11 hearts, respectively). (D) Regression analysis of ATG5 protein expression levels and thickness of the interventricular septum (IVS) from non-failing and hypertrophied human hearts (N = 7/16 hearts, respectively). (E) Representative original immunoblots and, (F) expression of the autophagy-related protein markers in non-failing (NF), hypertrophied (Hyp), and end-stage failing hearts (F) (N = 6/3/5 hearts, respectively). (A–F) Data show mean ± SEM. Indicated P-values were calculated using ANOVA followed by Dunnett’s post hoc test. (B) and (D) Association of Atg5 gene and ATG5 protein expression with IVS thickness was computed using Pearson correlation.
Figure 2
Figure 2
Atg5-deprived mice exhibit mild hypertrophy, reduced cardiac contractility and exercise capacity. (A) Photomicrographs of hearts from 12-week-old Atg5+/+ (left) and Atg5−/− mice (right). (B) Heart weight-to-body weight ratio (HW/BW) and, (C) NppB expression in Atg5+/+vs. Atg5−/− hearts (N = 10 vs. 9 mice for HW/BW, and N = 5 mice per group for NppB expression). (D) Heart rate (bpm, beats per minute) and, (E) maximal positive pressure development (dP/dtmax) in the left ventricle at baseline and upon intraperitoneal administration of isoprenaline (ISO, 2 µg/kg body weight) in Atg5+/+ and Atg5−/− mice. N = 4/5 mice, respectively. (F) Maximal run distance, (G) workload and, (H) maximal oxygen consumption (VO2max) in Atg5−/− mice and their control littermates during peak effort testing on a motorized treadmill coupled to indirect calorimetry. N = 8 mice per group. (B–H) Data show mean ± SEM. Indicated P-values were calculated using Mann–Whitney test comparing Atg5−/− or ISO treatment to the respective control.
Figure 3
Figure 3
Impaired subcellular Ca2+ cycling in response to increased workload in Atg5−/− cardiomyocytes. (A) Schematic representation of the stress protocol that simulates increased physiological workload by increasing stimulation frequency from 0.5 to 5 Hz during exposure to 10 nM isoprenaline (ISO). (B) Quantification of global calcium transients using Indo-1/AM. From left to right: Systolic and diastolic [Ca2+], amplitude, decay time (DT) and time-to-peak (ttp) in isolated cardiac myocytes subjected to a physiological stress protocol (A). Data show mean ± SEM. n = 28/18 cells from 3/2 Atg5+/+/Atg5−/− mice, respectively. (C) Quantification of myocyte contractility in unstained cells using the stress protocol in (A). From left to right: Sarcomere length, fractional shortening (FS), relaxation time (RT) and time-to-peak (ttp). Data show mean ± SEM (n = 35/32 cells from 3/3 Atg5+/+/Atg5−/− mice, respectively). (D) Original line-scan Fluo-4/AM fluorescence recordings (top) of intracellular Ca2+ transients at baseline and upon acute administration of 10 nM isoprenaline (ISO) in a representative control (left) and Atg5-deficient (right) cardiomyocyte, and corresponding calibrated cytoplasmic (black) and nucleoplasmic (red) Ca2+ transients (bottom). Scale bar, 20 µm. Mean values of cytoplasmic (E) and nucleoplasmic (F) Ca2+ transient parameters displaying diastolic (dia) [Ca2+], Ca2+ transient amplitude, time-to-peak (ttp), and time from peak [Ca2+] to 50% decline (DT50). Data show mean ± SEM (n = 24/20–22 cells from 5/4 Atg5+/+/Atg5−/− mice, respectively). (G) Original line-scan confocal images of cytoplasmic and nucleoplasmic Ca2+ transients at 1 and 4 Hz stimulation in a ventricular myocyte isolated from Atg5+/+ (left) and Atg5−/− (right) mice. Note the area of increased fluorescence intensity displaying increased nuclear Ca2+ (nuc). Scale bar, 20 µm. (H) Averaged original recordings of electrically stimulated Ca2+ transients in the nucleus (red) vs. cytoplasm (black) of ventricular myocytes isolated from Atg5+/+ (left) and Atg5−/− (right) mice in response to a gradual increase of stimulation frequency from 1 to 4 Hz. (I) Frequency-dependent changes in peak systolic amplitude in electrically stimulated Ca2+ transient in the cytoplasm (left) vs. nucleus (right) of ventricular myocytes isolated from control and Atg5-deficient mice. (J) Cytoplasmic (left) and nucleoplasmic (right) Ca2+ load was calculated as a time-integral area under Ca2+ transient–time curve within 1 s in Atg5+/+ and Atg5−/− cardiomyocytes. (H–J) Data show mean ± SEM (n = 19/25 cells from 3/3 Atg5+/+/Atg5−/− mice, respectively). (B and C) and (I and J) P-values were calculated using Bonferroni’s or Sidak’s post hoc test (vs. Atg+/+ control), following significant two-way repeated-measures ANOVA. (E and F) P-values were calculated using Mann–Whitney test comparing Atg5−/− or ISO to the respective control. Average data and group comparisons related to Figure 3 are summarized in Supplementary material online, Table S5.
Figure 4
Figure 4
Intact intracellular Ca2+ stores and impaired Ca2+ signalling in response to increased workload in Atg5-deprived hearts. (A) Representative fluorescent images of cardiomyocytes isolated from Atg5+/+ and Atg5−/− mice immunostained against phospho-CaMKII at 1 or 4 Hz stimulation frequency. Scale bar indicates 20 µm for whole cell images or 10 µm for magnified images of the nucleus. (B) Mean cytosolic, (C) nucleoplasm and, (D) nuclear envelope (NE) fluorescence values normalized to Atg5+/+ control cardiomyocytes paced at 1 Hz. Data show mean ± SEM (n = 153/159 cells from 5/4 Atg5+/+/Atg5−/− mice, respectively). Indicated P-values were calculated using Mann–Whitney test comparing Atg5−/− or 4 Hz to the respective control.
Figure 5
Figure 5
Expression and phosphorylation of Ca2+-regulatory proteins in Atg5-deprived hearts. (A and B) Representative original immunoblots and, (C–E) densitometric analysis of expression and phosphorylation of Ca2+-regulatory proteins in lysates from Atg5+/+ and Atg5−/− mouse hearts in the absence or presence of ISO. From left to right: total SERCA2a, phospholamban (PLB) and Troponin I (TnI), PLB phosphorylated on serine at site 16 (PLB-Ser16), TnI phosphorylated on serine at sites 23 and 24 (TnI-Ser23/24), and relative increase in PLB and TnI phosphorylation upon isoprenaline (ISO) administration are shown. Data show mean ± SEM of N = 6–12 samples per group, indicated P-values were calculated using Mann–Whitney test comparing Atg5−/− and Atg5+/+.
Figure 6
Figure 6
Atg5-deficiency causes aberrant cardiomyocyte composition, decreased mitochondrial abundance and functional overcompensation of individual mitochondria. (A–F) Representative transmission electron micrographs of longitudinal sections of cardiomyocytes depict ultrastructural changes due to the absence of basal autophagy. Note onion-like membrane aggregation (red arrows in C and D), membrane cisternae (red arrows in E), sarcomere disarray, misalignment of myofibrils (red arrows in F), and aggregation of mitochondria (F). Scale bar, 2 µm; Cap, capillary; mf, myofibril; mi, mitochondria; cm, cardiomyocytes. Relative volume of (G) myofibrils Vv(mf/cm) and, (H) mitochondria Vv(mito/cm) per cardiomyocyte from Atg5+/+ and Atg5−/− mouse hearts. (I) Ratio between the relative volume of mitochondria and myofibrils, Vv(mito/cm)/Vv(mf/cm). (J) Volume-weighted mean volume of mitochondria, meanVv(mi), was used to quantify mitochondrial volume and size distribution in Atg5+/+vs. Atg5−/− mouse hearts. (G–J) Data show mean ± SEM of N = 11–13 mice per group, indicated P-values were calculated using Mann–Whitney test comparing Atg5−/− to the Atg5+/+ control. Isolated Atg5−/− and Atg5+/+ cardiomyocytes were exposed to the stress protocol as in Figure 3A. (K) Mitochondrial membrane potential (ΔΨm; determined by TMRM fluorescence normalized to resting fluorescence, F/F0), (L) NAD(P)H/NAD(P)+ and FADH2/FAD (autofluorescence determined in the same cells) and, (M) ratio of reduced NAD(P)H to oxidized FAD (data from L) were determined. (K–M) Data show mean ± SEM, n = 28/18 cells from 3/2 Atg5+/+/Atg5−/− mice, respectively, for TMRM measurements, and n = 33/32 cells from 3/3 Atg5+/+/Atg5−/− mice, respectively, for NAD(P)H/NAD(P)+ and FADH2/FAD measurements. P-values were calculated using Bonferroni’s post hoc test, following significant two-way repeated-measures ANOVA.
Figure 7
Figure 7
Impaired subcellular Ca2+ cycling in response to increased workload in hypertrophied human cardiomyocytes. (A) Original line-scan confocal images of cytoplasmic and nucleoplasmic Ca2+ transients recorded at 0.25 and 1 Hz stimulation in a ventricular myocyte isolated from non-failing (left) and hypertrophied (right) human hearts. Scale bar, 10 µm. (B) Averaged original recordings of electrically stimulated Ca2+ transients in the nucleus (red) vs. cytoplasm (black) of ventricular myocytes isolated from non-failing (left) and hypertrophied (right) human hearts in response to gradual increase of stimulation frequency from 0.25 to 1 Hz. (C) Frequency-dependent changes in peak systolic amplitude in electrically stimulated Ca2+ transient in the cytoplasm (left) vs. nucleus (right) of ventricular myocytes isolated from control and hypertrophied human hearts. (D) Cytoplasmic (left) and nucleoplasmic (right) Ca2+ load calculated as a time-integral area under Ca2+ transient-time curve over 1 s in control and hypertrophied cardiomyocytes. (C and D) Data show mean ± SEM of n = 7 cells from N = 3 hearts per group, P-values were calculated using Sidak’s post hoc test (vs. non-failing at 0.25 Hz), following significant two-way repeated-measures ANOVA. (E) Original line-scan Fluo-4/AM fluorescence recordings (top) of intracellular Ca2+ transients at baseline and upon acute application of 10 nM isoprenaline (ISO) in a representative control (left) and hypertrophied (right) cardiomyocyte, and corresponding calibrated cytoplasmic (black) and nucleoplasmic (red) Ca2+ transients (bottom). Mean values of cytoplasmic (F) and nucleoplasmic (G) Ca2+ transient parameters displaying diastolic (dia) [Ca2+], Ca2+ transient amplitude, time-to-peak (ttp), and time from peak [Ca2+] to 50% decline (DT50). Data show mean ± SEM of n = 5–6 cells from N = 3 hearts per group. Scale bar, 10 µm. Average data and group comparisons related to Figure 7 are summarized in Supplementary material online, Table S6.

Comment in

Similar articles

Cited by

References

    1. Abdellatif M, Sedej S, Carmona-Gutierrez D, Madeo F, Kroemer G. Autophagy in cardiovascular aging. Circ Res 2018;123:803–824. - PubMed
    1. Nakai A, Yamaguchi O, Takeda T, Higuchi Y, Hikoso S, Taniike M, Omiya S, Mizote I, Matsumura Y, Asahi M, Nishida K, Hori M, Mizushima N, Otsu K. The role of autophagy in cardiomyocytes in the basal state and in response to hemodynamic stress. Nat Med 2007;13:619–624. - PubMed
    1. Shirakabe A, Ikeda Y, Sciarretta S, Zablocki DK, Sadoshima J. Aging and autophagy in the heart. Circ Res 2016;118:1563–1576. - PMC - PubMed
    1. Eisenberg T, Abdellatif M, Schroeder S, Primessnig U, Stekovic S, Pendl T, Harger A, Schipke J, Zimmermann A, Schmidt A, Tong M, Ruckenstuhl C, Dammbrueck C, Gross AS, Herbst V, Magnes C, Trausinger G, Narath S, Meinitzer A, Hu Z, Kirsch A, Eller K, Carmona-Gutierrez D, Büttner S, Pietrocola F, Knittelfelder O, Schrepfer E, Rockenfeller P, Simonini C, Rahn A, Horsch M, Moreth K, Beckers J, Fuchs H, Gailus-Durner V, Neff F, Janik D, Rathkolb B, Rozman J, de Angelis MH, Moustafa T, Haemmerle G, Mayr M, Willeit P, von Frieling-Salewsky M, Pieske B, Scorrano L, Pieber T, Pechlaner R, Willeit J, Sigrist SJ, Linke WA, Mühlfeld C, Sadoshima J, Dengjel J, Kiechl S, Kroemer G, Sedej S, Madeo F. Cardioprotection and lifespan extension by the natural polyamine spermidine. Nat Med 2016;22:1428–1438. - PMC - PubMed
    1. Taneike M, Yamaguchi O, Nakai A, Hikoso S, Takeda T, Mizote I, Oka T, Tamai T, Oyabu J, Murakawa T, Nishida K, Shimizu T, Hori M, Komuro I, Takuji Shirasawa TS, Mizushima N, Otsu K. Inhibition of autophagy in the heart induces age-related cardiomyopathy. Autophagy 2010;6:600–606. - PubMed