. 2021 Mar 21;154(11):111105.
doi: 10.1063/5.0041354.

A single-shot measurement of time-dependent diffusion over sub-millisecond timescales using static field gradient NMR

Affiliations

A single-shot measurement of time-dependent diffusion over sub-millisecond timescales using static field gradient NMR

Teddy X Cai et al. J Chem Phys. .

Abstract

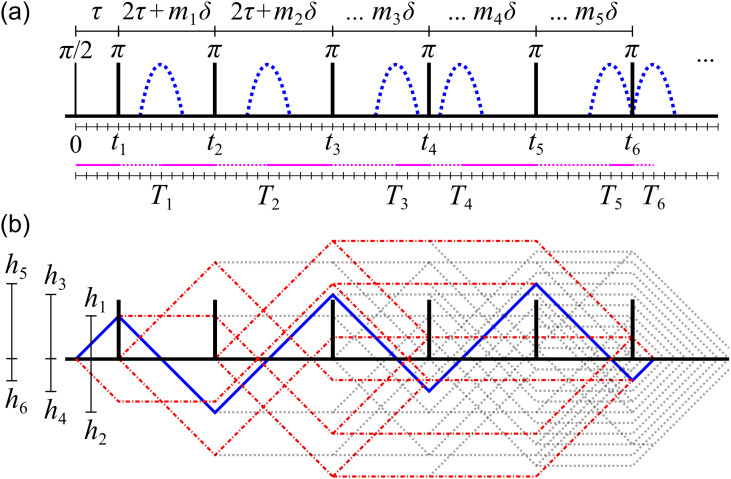
Time-dependent diffusion behavior is probed over sub-millisecond timescales in a single shot using a nuclear magnetic resonance static gradient time-incremented echo train acquisition (SG-TIETA) framework. The method extends the Carr-Purcell-Meiboom-Gill cycle under a static field gradient by discretely incrementing the π-pulse spacings to simultaneously avoid off-resonance effects and probe a range of timescales (50-500 µs). Pulse spacings are optimized based on a derived ruleset. The remaining effects of pulse inaccuracy are examined and found to be consistent across pure liquids of different diffusivities: water, decane, and octanol-1. A pulse accuracy correction is developed. Instantaneous diffusivity, Dinst(t), curves (i.e., half of the time derivative of the mean-squared displacement in the gradient direction) are recovered from pulse accuracy-corrected SG-TIETA decays using a model-free log-linear least squares inversion method validated by Monte Carlo simulations. A signal-averaged 1-min experiment is described. A flat Dinst(t) is measured on pure dodecamethylcyclohexasiloxane, whereas decreasing Dinst(t) is measured on yeast suspensions, consistent with the expected short-time Dinst(t) behavior for confining microstructural barriers on the order of micrometers.


Figures

FIG. 1.
FIG. 1.
Example G(t) calculation. (a) Radiofrequency (RF) pulses in a static gradient of amplitude g. (b) G(t), shifted G(t + s) (red, dashed), and F(t). (c) Corresponding G(t). G(t) is assumed to be zero outside of t = [0, 2τ].
FIG. 2.
FIG. 2.
Example SG-TIETA sequence. (a) Timings: mj = {1, 3, 1, 2, 1}, τ = 4δ, and δ = 14 µs = 1 dash. π-pulses occur at tn, and direct echoes (blue lines) form at Tn. Magenta line indicates timing behavior: Tn = tn + hn, where hn is the normalized |F(t)|/γg “height” at tn given by h1 = τ and hn = 2τ + mnδhn−1 for n > 1. (b) Direct echo F(t) and other coherence pathways that refocus (red dashed-dotted lines) or do not refocus (gray dotted lines). Relative values of hn are indicated.
FIG. 3.
FIG. 3.
LLS inversion on Monte Carlo simulated data. (a) Simulated r(t)g^2 (D0 = 2.15 μm2/ms) for free diffusion (black) and restricted geometries (see Fig. S1). Cn(t) (a.u.) for Eq. (15) is overlaid, omitting the first two echoes. (b) Echo decays simulated from same color curves in (a) for γg = 4.093 μm−1 ms−1. Insets show B with 2W1/2 for the black curve and A for Δt(k) = {50, 50, 50, 50, 75, 75, 125, 139} μs. (c) Dinst(t) from the gradient of r(t)g^2 curves in (a) (solid lines) compared to X inverted from decays in (b) with added Gaussian noise (SNR = 25). Error bars = ±1 SD from 100 replications. Initial X guesses were D0 for the first point and D (dashed lines, {0.9, 1.45, 1.48} μm2/ms) for the remaining points. λ = 2 × 10⁻⁶ is selected manually. See Eq. (S1) for Γ.
FIG. 4.
FIG. 4.
SG-TIETA Ap(n) calibration using pure liquids. (a) Observed SG-TIETA decays compared to exp(−bD0). D0 is measured (see Sec. IV of the supplementary material) in the legend order as 2.22 ± 0.01, 1.27 ± 0.01, 0.121 ± 0.002 μm2/ms. Error bars = ±1 SD for 25, 38, and 70 repetitions, respectively. (b) Decay vs exp(−bD0) ratio truncated at n = 12, 15, 25. Inset shows cubic spline fits. (c) Ap(n) approximated using adjacent fitted ratios.
FIG. 5.
FIG. 5.
Comparison of the direct echo SG-TIETA (blue) and CPMG (orange) attenuation and echo shape for 1-octanol with 2τ = TE = 98 ms. Echo shapes show the real (solid lines) and imaginary (dotted lines) signals normalized by the area under the real signal curve in a 16 µs window. The CPMG echo width decreases with n and stabilizes around n = 3, consistent with the approach to the asymptotic behavior described by Hürlimann and Griffin. In contrast, the SG-TIETA echo width increases and stabilizes around n = 3, consistent with the direct echo CTP being preferential to the on-resonance signal (see Figs. S7 and S8 for all echo shapes and an exemplar echo decay, respectively)
FIG. 6.
FIG. 6.
SG-TIETA decays and inverted X for D6, yeast, and water. (a) Decays analyzed as described in the text. See Sec. II of the supplementary material for fitting procedures. Error bars = ±1 SD in the legend order for 38, 3, 4, and 25 repetitions truncated at N = 34, 17, 17, and 15, respectively. Note the erratic early Ap(n) behavior. (b) X solutions. Inversion parameters are identical to Fig. 3 other than Δt(k) for D6. Initial guesses of D0 = 2.22, D = {0.9, 1.1} μm2/ms for yeast, and D0 = D = 0.114 μm2/ms for D6 are provided. Zoomed-in plot compares short-time Dinst(t) plotted up to t < 0.08 × τD.

References

    1. Kac M., Am. Math. Mon. 73, 1 (1966).10.1080/00029890.1966.11970915 - DOI
    1. Mitra P. P., Sen P. N., Schwartz L. M., and Le Doussal P., Phys. Rev. Lett. 68, 3555 (1992).10.1103/physrevlett.68.3555 - DOI - PubMed
    1. Mitra P. P., Sen P. N., and Schwartz L. M., Phys. Rev. B 47, 8565 (1993).10.1103/physrevb.47.8565 - DOI - PubMed
    1. Sen P. N., Concepts Magn. Reson., Part A 23A, 1 (2004).10.1002/cmr.a.20017 - DOI
    1. Reynaud O., Front. Phys. 5, 58 (2017).10.3389/fphy.2017.00058 - DOI