. 2021 Mar 22;22(1):18.
doi: 10.1186/s12868-021-00613-8.

SCN11A gene deletion causes sensorineural hearing loss by impairing the ribbon synapses and auditory nerves

Affiliations

SCN11A gene deletion causes sensorineural hearing loss by impairing the ribbon synapses and auditory nerves

Mian Zu et al. BMC Neurosci. .

Abstract

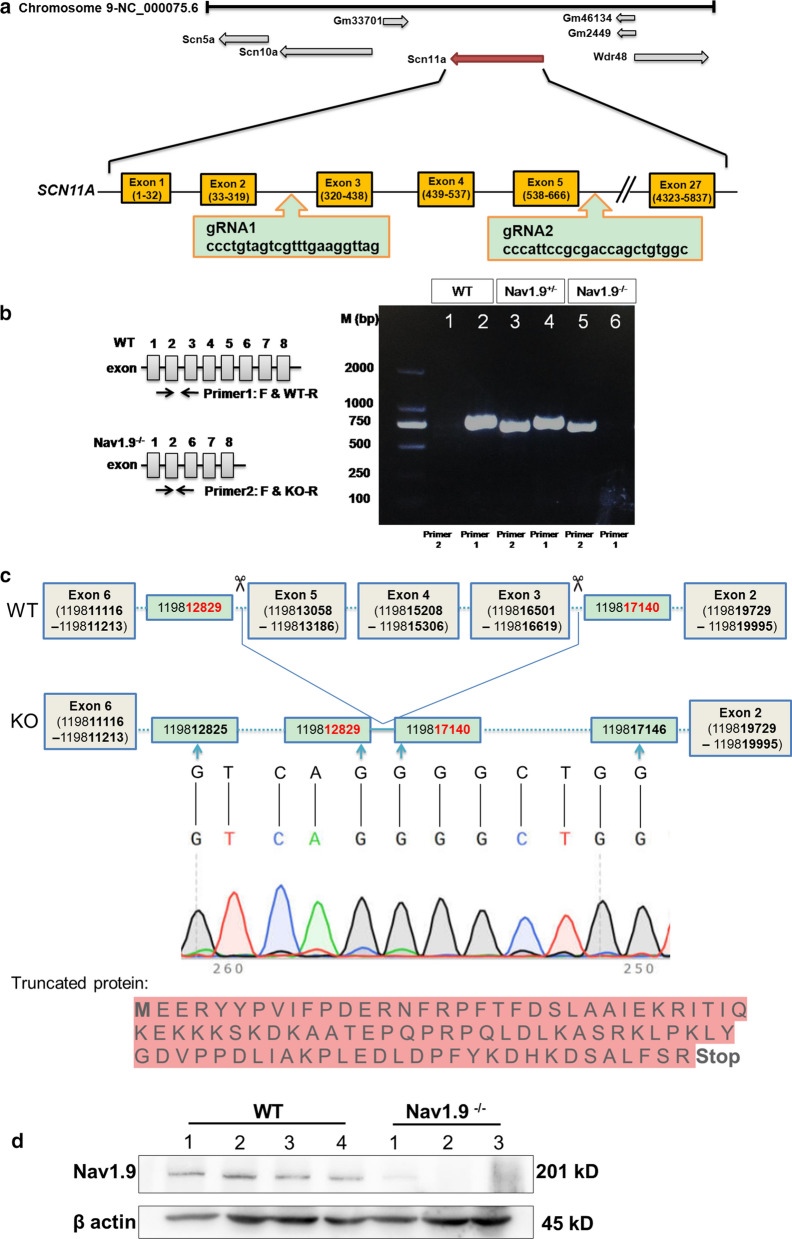
Background: The SCN11A gene, encoded Nav1.9 TTX resistant sodium channels, is a main effector in peripheral inflammation related pain in nociceptive neurons. The role of SCN11A gene in the auditory system has not been well characterized. We therefore examined the expression of SCN11A in the murine cochlea, the morphological and physiological features of Nav1.9 knockout (KO) ICR mice.

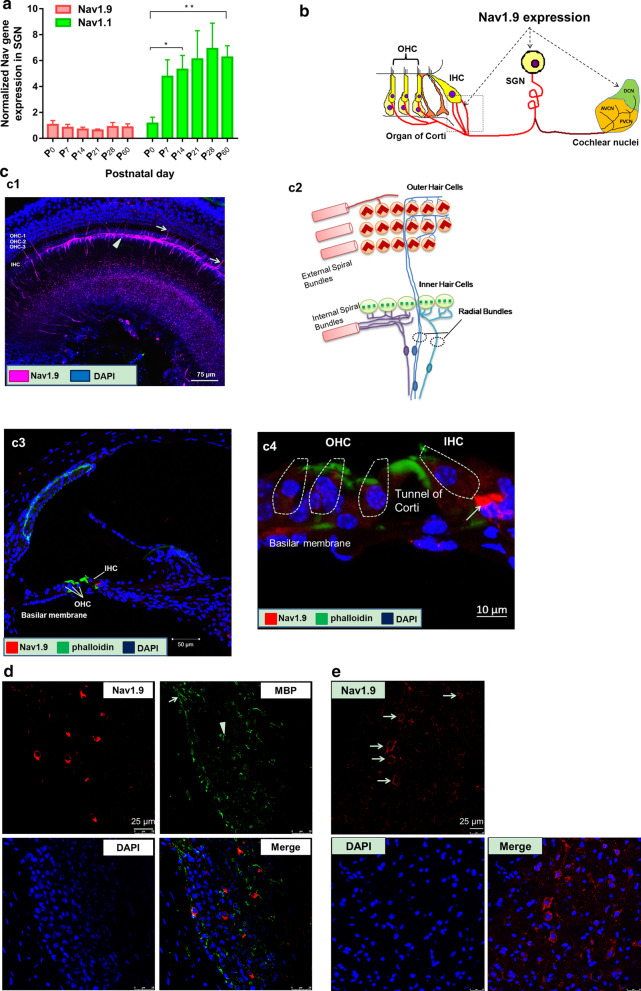
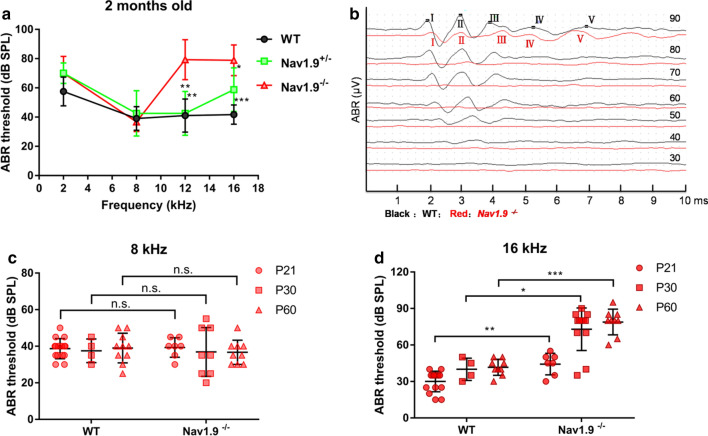
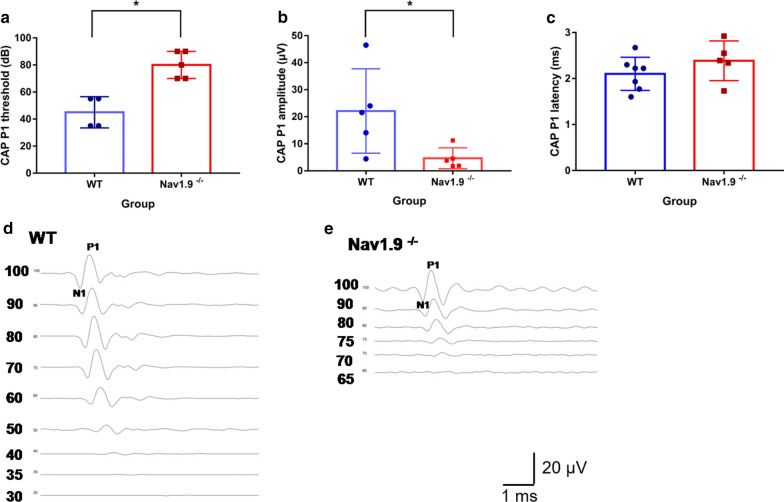
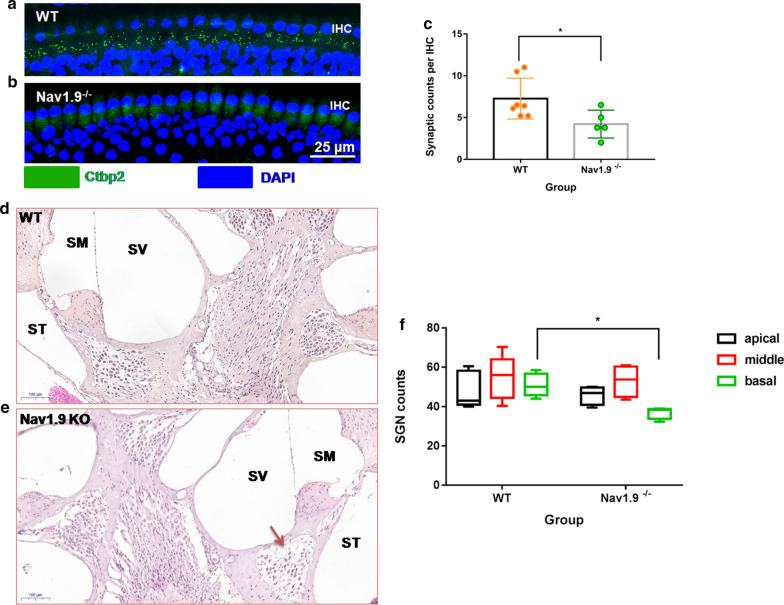
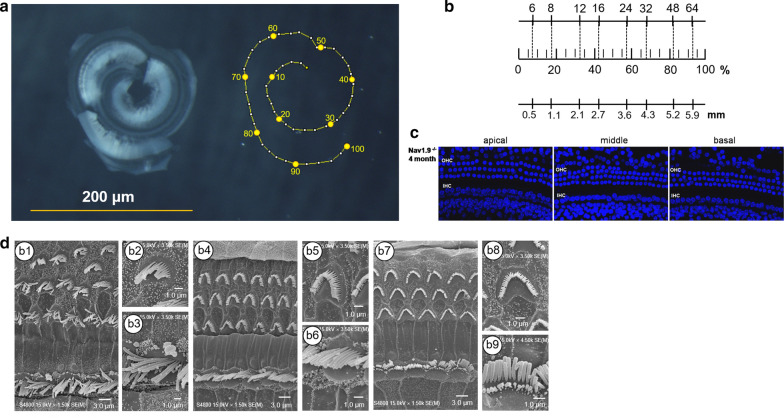
Results: Nav1.9 expression was found in the primary afferent endings beneath the inner hair cells (IHCs). The relative quantitative expression of Nav1.9 mRNA in modiolus of wild-type (WT) mice remains unchanged from P0 to P60. The number of presynaptic CtBP2 puncta in Nav1.9 KO mice was significantly lower than WT. In addition, the number of SGNs in Nav1.9 KO mice was also less than WT in the basal turn, but not in the apical and middle turns. There was no lesion in the somas and stereocilia of hair cells in Nav1.9 KO mice. Furthermore, Nav1.9 KO mice showed higher and progressive elevated ABR threshold at 16 kHz, and a significant increase in CAP thresholds.

Conclusions: These data suggest a role of Nav1.9 in regulating the function of ribbon synapses and the auditory nerves. The impairment induced by Nav1.9 gene deletion mimics the characters of cochlear synaptopathy.

Keywords: Expression; Nav1.9 knockout; Progressive hearing loss; Ribbon synapse; SGN; Synaptopathy; TTX resistant sodium channels.


Conflict of interest statement

The authors declare that they have no competing interests.

Figures

Fig. 1
Fig. 1
CRISPR/Cas 9-mediated generation of a Nav1.9−/− mouse model. a A representative illustration of the CRISPR/Cas9 targeting strategy for generating Nav1.9 knockout (KO) mice. The Cas9 mRNA and two single guide RNAs targeting a region from SCN11A exon 3 to 5, were microinjected into mouse zygotes. b Schematic diagram of primer pair design for PCR genotyping, a representative PCR genotyping result for Nav1.9 wild-type (WT), homozygous (Nav1.9−/−) and heterozygous (Nav1.9+/−), the region of junction of DSB is absent in the WT mice. Primer 2: primer pairs containing forward primer and KO specific reverse primer; Primer 1: primer pairs containing forward primer and WT specific reverse primer. c This successfully eliminated all of exon 3, 4 and 5, as confirmed by Sanger sequencing, induces reading frame shift and thus a premature translational- termination codon during the truncated protein expression. d The protein expression of Nav1.9 in the cochleas of Nav1.9−/− mice (n = 3) or WT mice (n = 4) was measured by western blot
Fig. 2
Fig. 2
Distribution of Nav1.9 in primary auditory afferents. a The voltage-gated sodium channel Nav1.9 and Nav1.1 mRNA levels in modiolus of WT ICR mice at the postnatal 0, 7th, 14th, 21th, 28th and 60th day. Each time point contains 5 mice. *p = 0.028, **p = 0.004. b A schematic representing the localization of Nav1.9 channels at primary afferent peripheral nerve endings on hair cells in cochlea, in SGN somata, in the auditory nerve located within the modiolus, and in the cochlear nuclei. c Nav1.9 is present in cochlea basilar membrane by surface preparation technique and immunofluorescence staining in cryo-section. c1 Horizontal section showing three rows of OHCs and one row of IHCs. In a linear distribution below the IHCs, Nav1.9 (purple) is in the afferent endings beneath the IHC bases. Also stained are the afferent radial fibers leading through the tunnel of Corti to their first hemi-nodes beneath the foramina nervosa. Scales = 75 μm. c2 The diagram of the cochlea’s afferent innervations pattern. c3 Nav1.9 is in the nerve endings of internal spiral fibers or radial fibers beneath IHC (red), the cilia of which exhibit phalloidin labeling (green). Scales = 50 μm. c4 The high magnification image of c3. Scale = 10 μm. d The expression of Nav1.9 in the SGNs of P60 WT mouse was measured by immunofluorescence. Nav1.9, MBP, and cell nucleus are stained as red, green and blue, respectively. e Some neurons from the dorsal cochlear nucleus are labeled by Nav1.9 (red)
Fig. 3
Fig. 3
Audiological characterization of Nav1.9−/− mice. a Mean ABR thresholds of six wild-type, four heterozygous and seven homozygous versus sound frequency, **p = 0.002, **p = 0.001 at 12 kHz compared with homozygous, *p = 0.01, ***p = 0.000 at 16 kHz compared with homozygous by one-way ANOVA with Bonferroni’s post-hoc test. b Example of ABR waveforms at 16 kHz in one ear of a wild-type superimposed on an example of ABR waveforms in one ear of Nav1.9−/− mice. c ABR thresholds of WT and homozygous mice of postnatal day 21 to 60 at 8 kHz. p = 0.807 at P21; p = 0.932 at P30; p = 0.504 with independent samples t test; n.s.: not significant. d ABR threshold of WT and homozygous mice of postnatal day 21 to 60 at 16 kHz. *p = 0.016, **p = 0.006, ***p = 0.000 with Mann–Whitney test. Data are expressed as mean ± s.d
Fig. 4
Fig. 4
Auditory compound action potentials are affected by Nav1.9 knockout. Nav1.9 knockout induces higher CAP P1 threshold, *p = 0.013 with Mann–Whitney test (a), lower CAP P1 amplitude, *p = 0.041 with independent samples t test (b), compared with WT group; c the CAP P1 latency is not affected at the time point of postnatal day 60, p = 0.242 with independent samples t test. d Representative CAP waveforms from a WT mouse. e Representative CAP waveforms from a Nav1.9−/− mice. Data are expressed as mean ± s.d
Fig. 5
Fig. 5
Nav1.9 knockout affects ribbon synapse density and survival of spiral ganglion neurons. Representative images of ribbon synapse immunostained with Ctbp2 (green) from WT (a) and Nav1.9−/− mice (b). c Quantitative analysis of ribbon synapse counts per IHC from five randomly selected visual fields for each mouse. n = 7 for WT group, n = 5 for Nav1.9−/− group. *p = 0.034 by Mann–Whitney test. Representative images of spiral ganglion neurons in Rosenthal’s canal from WT (d) and Nav1.9−/− mice (e). f Spiral ganglion neuron counts in the basal turn, the middle turn and apical turn together in 3 midmodiolar sections for each animal. n = 5 for WT group, n = 4 for Nav1.9−/− group. *p = 0.014 by Mann–Whitney test. Data are expressed as mean ± s.d
Fig. 6
Fig. 6
Nav1.9 knockout does not affect the morphology of hair cells. a The digital image of a dissected cochlea including the hook region (left) from a 4 months old mouse. Schematic drawing of the same cochlea with percent distance from the apex plotted (right). b Scale is showing frequency, percent distance from the apex, and distance (mm), according to Müller et al. [22]: x = 100 − (156.53 − 82.46 * log(F)). The full basilar membrane length is 6.3 mm for this particular cochlea. C, Images of organ of Cortis from 4 months old mice stained by DAPI (blue), with the apical turn (0–25% distance from the apex), the middle turn (30–55% distance from the apex) and the basal turn (60–85% distance from the apex). d Images of the organ of Corti of Nav1.9−/− mice at postnatal ages of 2 months by SEM, containing the apical turn (b1b3), the middle turn (b4b6), and the basal turn (b7b9)

Similar articles

Cited by

References

    1. Akopian AN, Sivilotti L, Wood JN. A tetrodotoxin-resistant voltage-gated sodium channel expressed by sensory neurons. Nature. 1996;379(6562):257–262. doi: 10.1038/379257a0. - DOI - PubMed
    1. Dib-Hajj SD, Tyrrell L, Waxman SG. Structure of the sodium channel gene SCN11A: evidence for intron-to-exon conversion model and implications for gene evolution. Mol Neurobiol. 2002;26(2–3):235–250. doi: 10.1385/MN:26:2-3:235. - DOI - PubMed
    1. Tyrrell L, Renganathan M, Dib-Hajj SD, Waxman SG. Glycosylation alters steady-state inactivation of sodium channel Nav1.9/NaN in dorsal root ganglion neurons and is developmentally regulated. J Neurosci. 2001;21(24):9629–9637. doi: 10.1523/JNEUROSCI.21-24-09629.2001. - DOI - PMC - PubMed
    1. Xu W, Zhang J, Wang Y, Wang L, Wang X. Changes in the expression of voltage-gated sodium channels Nav1.3, Nav1.7, Nav1.8, and Nav1.9 in rat trigeminal ganglia following chronic constriction injury. NeuroReport. 2016;27(12):929–934. doi: 10.1097/WNR.0000000000000632. - DOI - PubMed
    1. Thun J, Persson AK, Fried K. Differential expression of neuronal voltage-gated sodium channel mRNAs during the development of the rat trigeminal ganglion. Brain Res. 2009;1269:11–22. doi: 10.1016/j.brainres.2009.02.044. - DOI - PubMed

Publication types

MeSH terms

Substances