

Geospatial indicators of exposure, sensitivity, and adaptive capacity to assess neighbourhood variation in vulnerability to climate change-related health hazards
- PMID: 33752667
- PMCID: PMC7986027
- DOI: 10.1186/s12940-021-00708-z
Geospatial indicators of exposure, sensitivity, and adaptive capacity to assess neighbourhood variation in vulnerability to climate change-related health hazards
Abstract
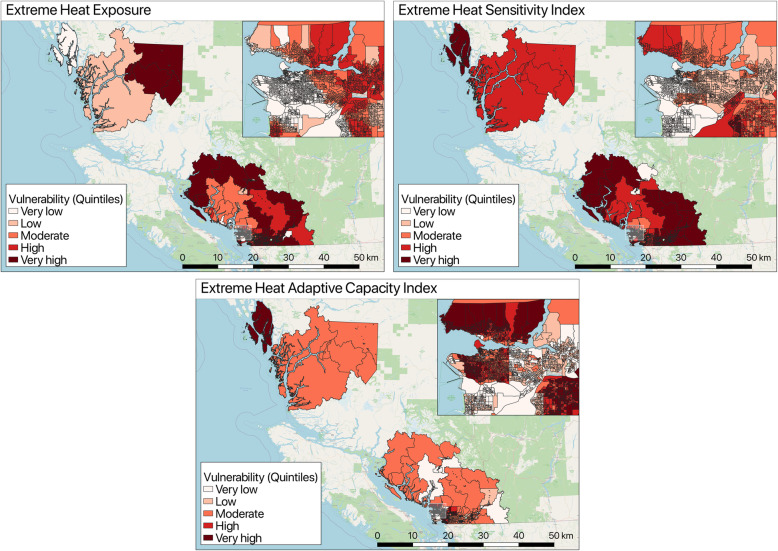
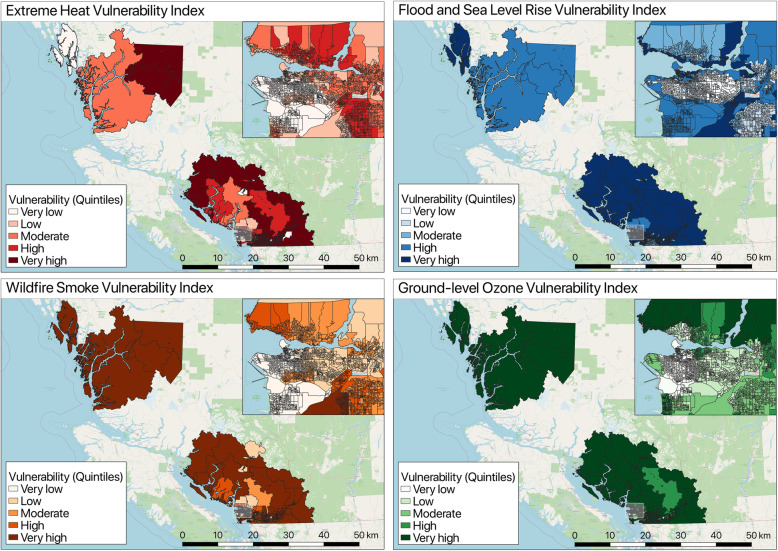
Background: Although the frequency and magnitude of climate change-related health hazards (CCRHHs) are likely to increase, the population vulnerabilities and corresponding health impacts are dependent on a community's exposures, pre-existing sensitivities, and adaptive capacities in response to a hazard's impact. To evaluate spatial variability in relative vulnerability, we: 1) identified climate change-related risk factors at the dissemination area level; 2) created actionable health vulnerability index scores to map community risks to extreme heat, flooding, wildfire smoke, and ground-level ozone; and 3) spatially evaluated vulnerability patterns and priority areas of action to address inequity.
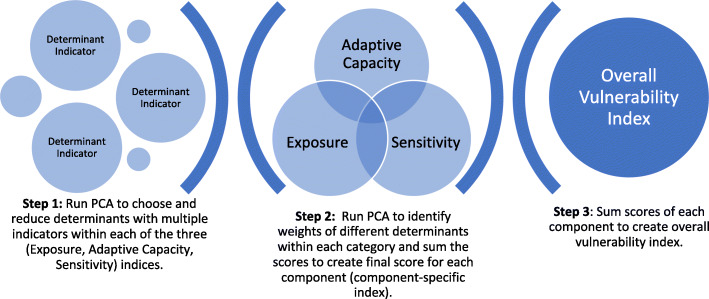
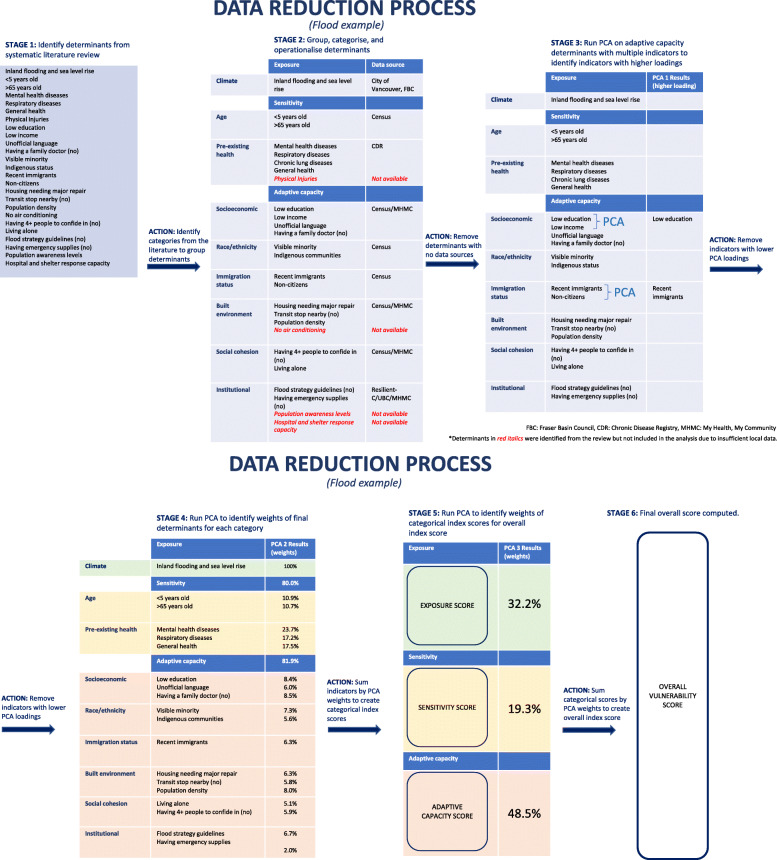
Methods: A systematic literature review was conducted to identify the determinants of health hazards among populations impacted by CCRHHs. Identified determinants were then grouped into categories of exposure, sensitivity, and adaptive capacity and aligned with available data. Data were aggregated to 4188 Census dissemination areas within two health authorities in British Columbia, Canada. A two-step principal component analysis (PCA) was then used to select and weight variables for each relative vulnerability score. In addition to an overall vulnerability score, exposure, adaptive capacity, and sensitivity sub-scores were computed for each hazard. Scores were then categorised into quintiles and mapped.
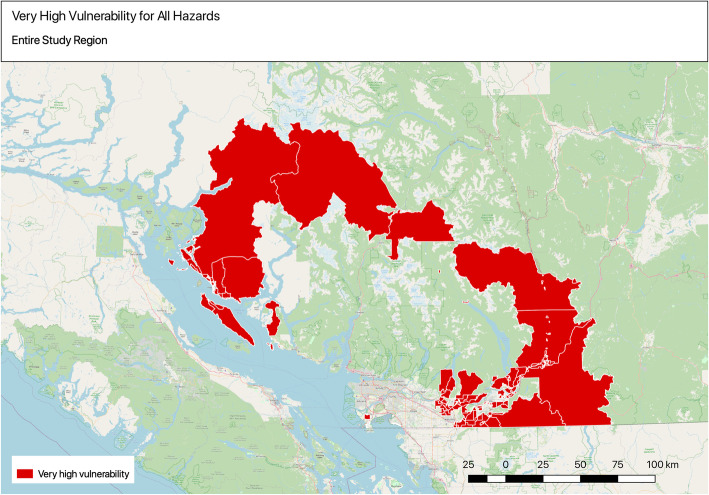
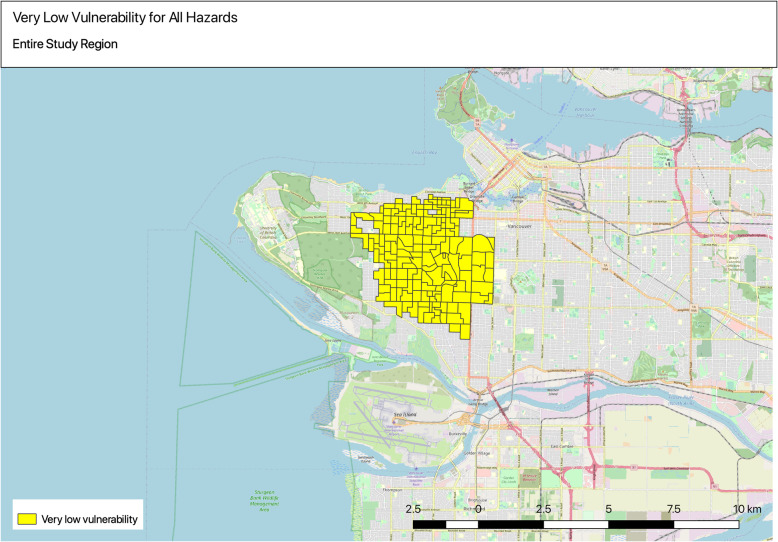
Results: Two hundred eighty-one epidemiological papers met the study criteria and were used to identify 36 determinant indicators that were operationalized across all hazards. For each hazard, 3 to 5 principal components explaining 72 to 94% of the total variance were retained. Sensitivity was weighted much higher for extreme heat, wildfire smoke and ground-level ozone, and adaptive capacity was highly weighted for flooding vulnerability. There was overall varied contribution of adaptive capacity (16-49%) across all hazards. Distinct spatial patterns were observed - for example, although patterns varied by hazard, vulnerability was generally higher in more deprived and more outlying neighbourhoods of the study region.
Conclusions: The creation of hazard and category-specific vulnerability indices (exposure, adaptive capacity and sensitivity sub-scores) supports evidence-based approaches to prioritize public health responses to climate-related hazards and to reduce inequity by assessing relative differences in vulnerability along with absolute impacts. Future studies can build upon this methodology to further understand the spatial variation in vulnerability and to identify and prioritise actionable areas for adaptation.
Keywords: Adaptive capacity; Climate change and health; Index scores; Principal component analysis; Vulnerability mapping.
Conflict of interest statement
The authors declare no competing interests.
Figures

References
-
- Organization WH, Others. Operational framework for building climate resilient health systems. World Health Organization; 2015.
-
- Pachauri RK, Allen MR, Barros VR, Broome J, Cramer W, Christ R, et al. Climate change 2014: synthesis report. Contribution of Working Groups I, II and III to the fifth assessment report of the Intergovernmental Panel on Climate Change. Ipcc; 2014.
-
- Copernicus Climate Change Service. Copernicus monitors above average summer temperatures and high number of days with heat stress; August 4th warmest on record 2020 [cited 2020 Nov 17]. Available from: https://climate.copernicus.eu/index.php/copernicus-monitors-above-averag...
Publication types
MeSH terms
Substances
Associated data
Grants and funding
LinkOut - more resources
Full Text Sources
Other Literature Sources
Medical
Miscellaneous
