

Size, composition and distribution of health workforce in India: why, and where to invest?
- PMID: 33752675
- PMCID: PMC7983088
- DOI: 10.1186/s12960-021-00575-2
Size, composition and distribution of health workforce in India: why, and where to invest?
Abstract
Background: Investment in human resources for health not only strengthens the health system, but also generates employment and contributes to economic growth. India can gain from enhanced investment in health workforce in multiple ways. This study in addition to presenting updated estimates on size and composition of health workforce, identifies areas of investment in health workforce in India.
Methods: We analyzed two sources of data: (i) National Health Workforce Account (NHWA) 2018 and (ii) Periodic Labour Force Survey 2017-2018 of the National Sample Survey Office (NSSO). Using the two sources, we collated comparable estimates of different categories of health workers in India, density of health workforce and skill-mix at the all India and state levels.
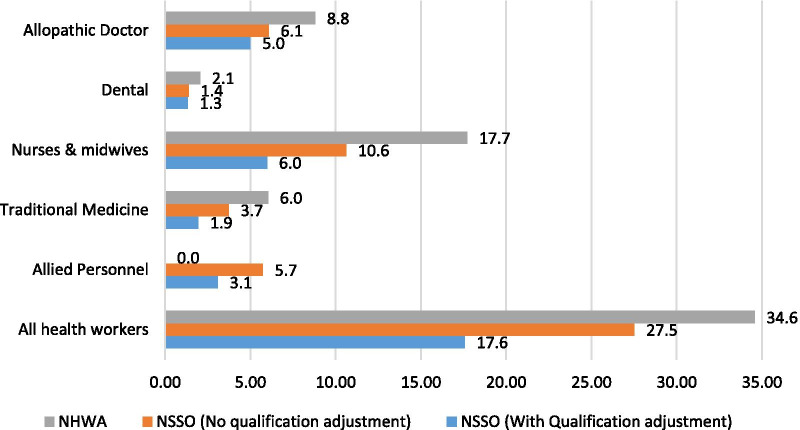
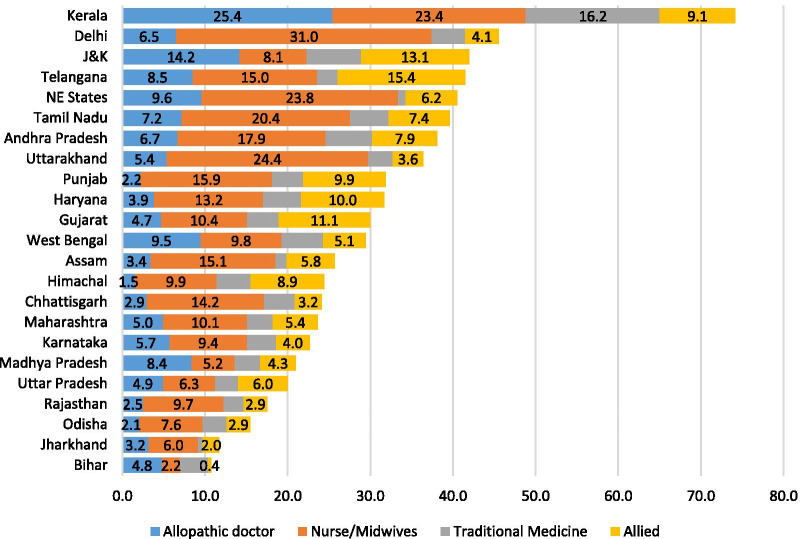
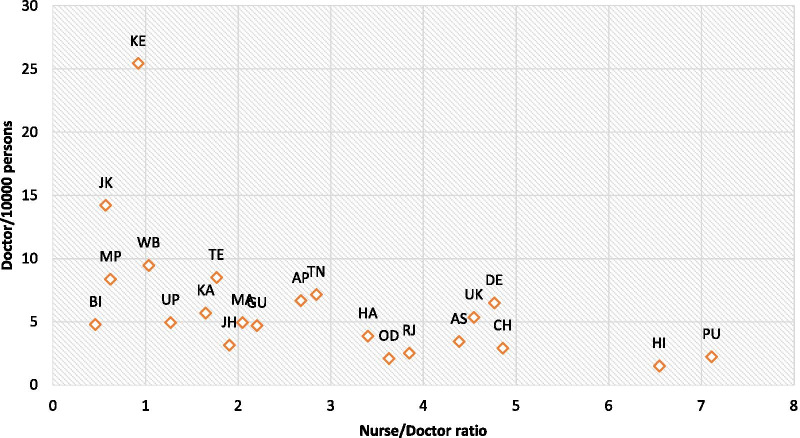
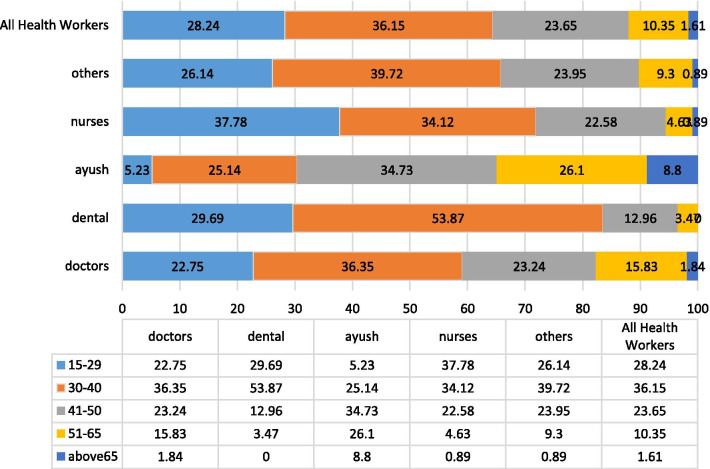
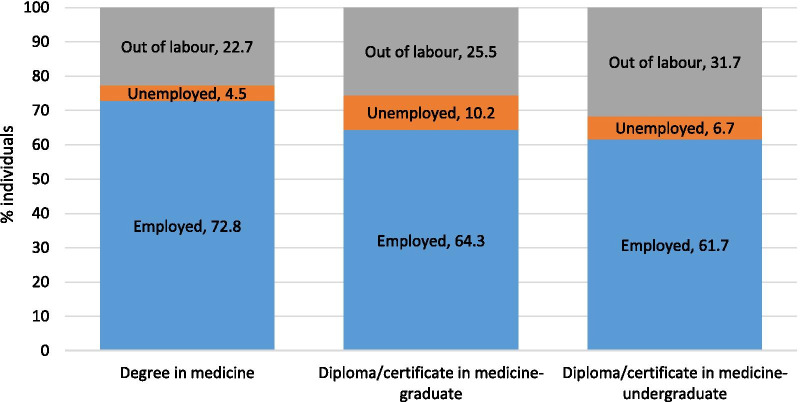
Results: The study estimated (from NHWA 2018) a total stock of 5.76 million health workers which included allopathic doctors (1.16 million), nurses/midwives (2.34 million), pharmacist (1.20 million), dentists (0.27 million), and traditional medical practitioner (AYUSH 0.79 million). However, the active health workforce size estimated (NSSO 2017-2018) is much lower (3.12 million) with allopathic doctors and nurses/midwives estimated as 0.80 million and 1.40 million, respectively. Stock density of doctor and nurses/midwives are 8.8 and 17.7, respectively, per 10,000 persons as per NHWA. However, active health workers' density (estimated from NSSO) of doctor and nurses/midwives are estimated to be 6.1 and 10.6, respectively. The numbers further drop to 5.0 and 6.0, respectively, after accounting for the adequate qualifications. All these estimates are well below the WHO threshold of 44.5 doctor, nurses and midwives per 10,000 population. The results reflected highly skewed distribution of health workforce across states, rural-urban and public-private sectors. A substantial proportion of active health worker were found not adequately qualified on the one hand and on the other more than 20% of qualified health professionals are not active in labor markets.
Conclusion: India needs to invest in HRH for increasing the number of active health workers and also improve the skill-mix which requires investment in professional colleges and technical education. India also needs encouraging qualified health professionals to join the labor markets and additional trainings and skill building for already working but inadequately qualified health workers.
Keywords: Health workforce; Human resource for health; India; Investment in health.
Conflict of interest statement
JB is Editor in Chief of the journal “Human Resources for Health” but blinded to the review process.
Figures
References
-
- WHO. The World Health Report–working together for health. Geneva, World Health Organization. 2006. https://www.who.int/whr/2006/whr06_en.pdf?ua=1. Accessed 20 Apr 2020.
-
- WHO. High-Level Commission on Health Employment and Economic Growth. Geneva, World Health Organization. 2016. https://apps.who.int/iris/bitstream/handle/10665/250040/9789241511285-en.... Accessed 20 Apr 2020.
-
- WHO. Global Strategy on Human Resources for Health: Workforce 2030. Geneva, World Health Organization. 2019. https://www.who.int/hrh/resources/global_strategy_workforce2030_14_print.... Accessed 20 Apr 2020.
Publication types
MeSH terms
Grants and funding
LinkOut - more resources
Full Text Sources
Other Literature Sources
