. 2021 Mar 22;18(1):31.
doi: 10.1186/s12986-020-00504-5.

An optimal glycemic load range is better for reducing obesity and diabetes risk among middle-aged and elderly adults

Affiliations

An optimal glycemic load range is better for reducing obesity and diabetes risk among middle-aged and elderly adults

Fengyi He et al. Nutr Metab (Lond). .

Abstract

Background: Due to the lack of evidence, advice pertaining to glycemic load (GL) can be misleading. Does the excessive restriction of GL, mostly through an extreme reduction in carbohydrate intake, result in a relatively high intake of fat and protein and result in overweight and obesity? This study was performed to initially explore the optimal GL range.

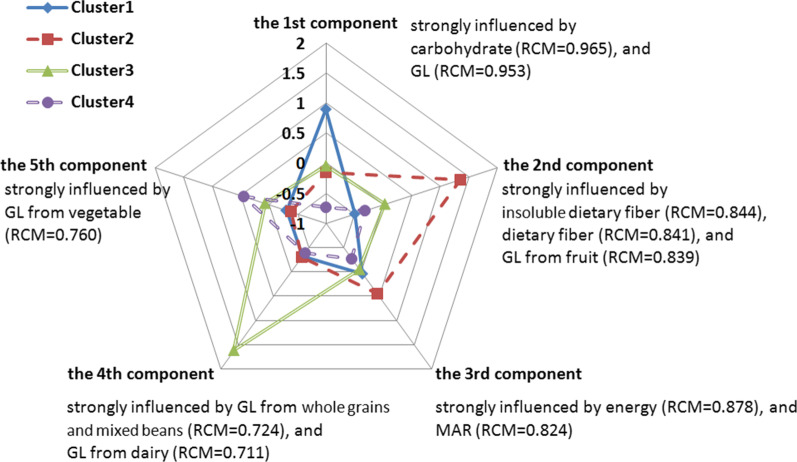
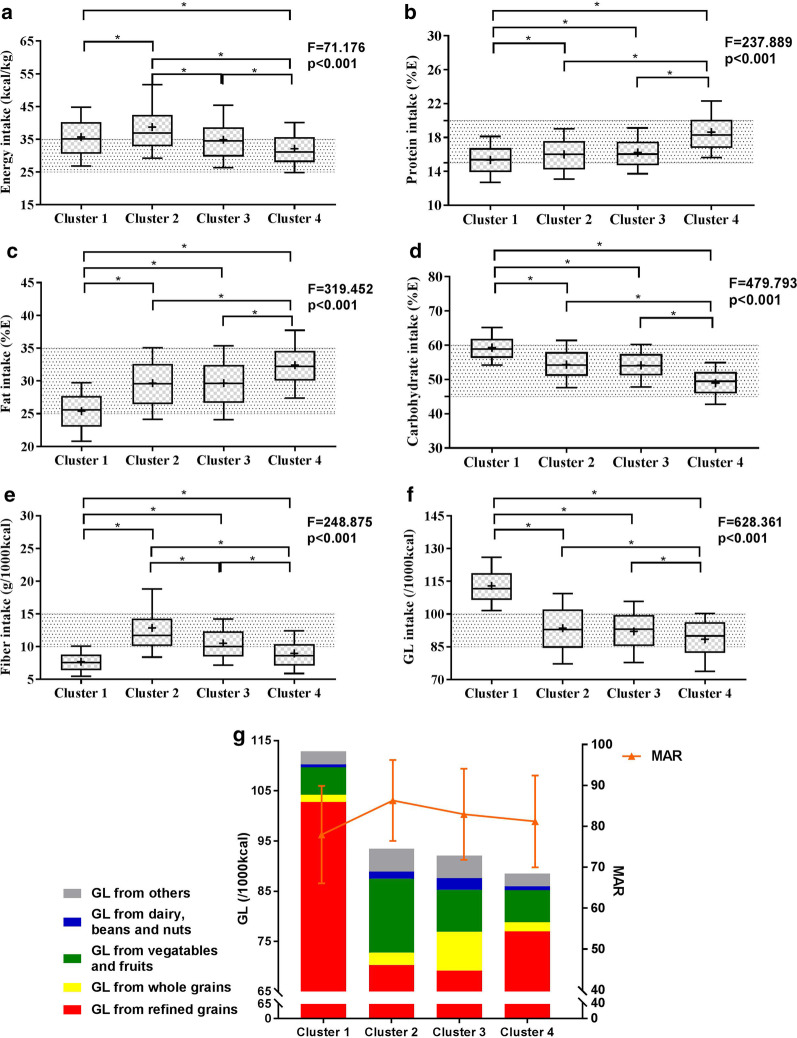
Methods: A cross-sectional study involving 2029 participants aged 40 years or older in Guangzhou, China was conducted. Participants were divided into four groups according to cluster analysis. Dietary data were assessed using a previously validated 3-day food record.

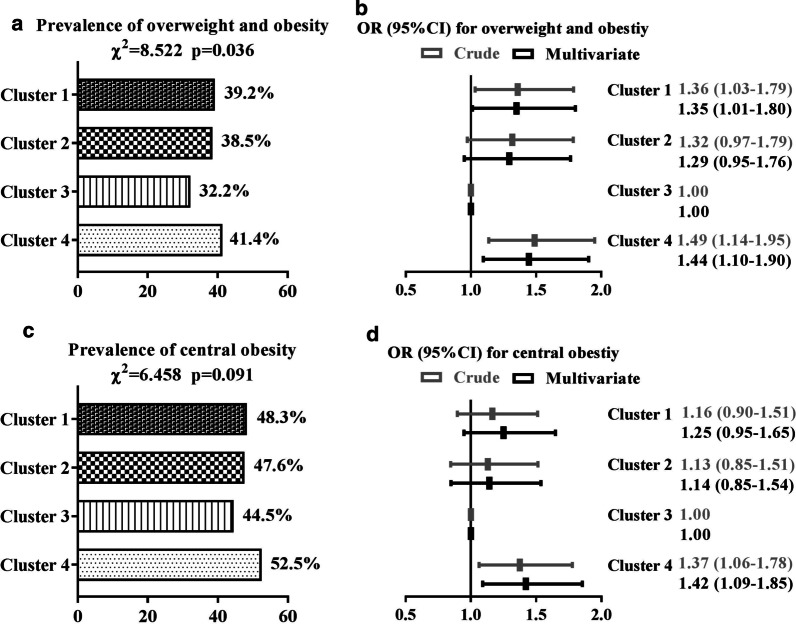
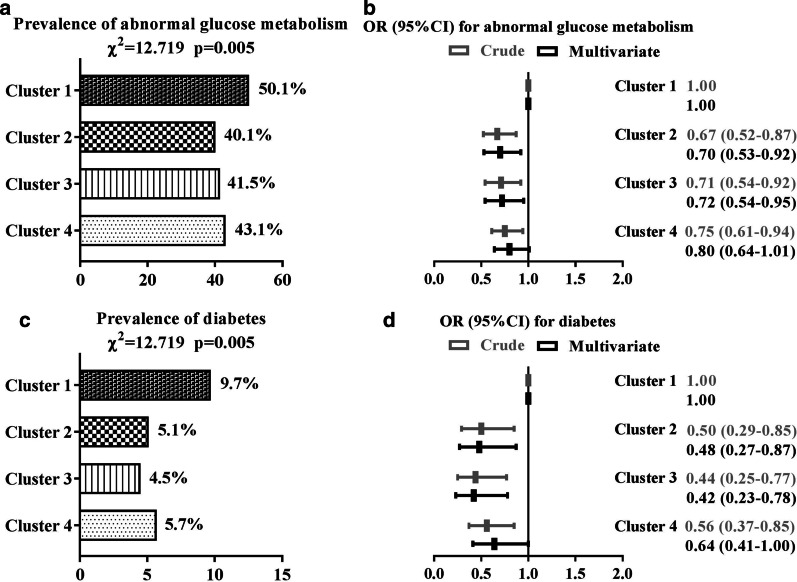
Results: Instead of participants with the highest [cluster 1, median (interquartile ranges) GL was 112(107-119)/1000 kcal] and the lowest GL intake [cluster 4, 90(82-96)/1000 kcal], those with moderate GL intakes [clusters 2 and 3, 93(85-102) and 93(85-99)/1000 kcal, respectively] had a lower prevalence of overweight, obesity and diabetes. In addition, clusters 2 and 3 were more consistent with the macronutrient intake reference with adequate micronutrient intake. Therefore, the optimal GL range was determined to be (85-100)/1000 kcal, rather than "lower is better".

Conclusions: Reducing the GL intake to prevent diabetes deserves more attention in the context of a balanced diet. An appropriate GL may be better than excessive restriction.

Keywords: Cluster analysis; Diabetes; Glycemic load; Obesity.


Conflict of interest statement

The authors declare that they have no competing interests.

Figures

Fig. 1
Fig. 1
Four identified clusters on dominant component loadings after varimax rotation. RCM rotated component matrix, GL glycemic load, MAR micronutrient adequacy ratio
Fig. 2
Fig. 2
Prevalence of obesity among the participants and adjusted ORs (95% CIs) by cluster based on a logistic regression analysis adjusted for advanced age (≥ 65 years or no), sex (male or female), regular exercise (yes or no), current smoking status (yes or no), current drinking status (yes or no), and diabetic family history (yes or no). Overweight and obesity were defined as a BMI ≥ 24.0 kg/m2; central obesity was defined as a waist circumference ≥ 85.0 cm for men or ≥ 80.0 cm for women
Fig. 3
Fig. 3
Prevalence of diabetes among the participants and adjusted ORs (95% CIs) by cluster based on a logistic regression analysis adjusted for advanced age (≥ 65 years or no), sex (male or female), regular exercise (yes or no), current smoking status (yes or no), current drinking status (yes or no), and diabetic family history (yes or no). Abnormal glucose metabolism was defined as FPG ≥ 6.1 mmol/L and/or 2-hPG ≥ 7.8 mmol/L; diabetes was defined as FPG ≥ 7.0 mmol/L and/or 2-hPG ≥ 11.1 mmol/L
Fig. 4
Fig. 4
Dietary characteristics of the four identified clusters. Whisker-box plot with boxes indicating the median and 25th and 75th percentiles and whiskers indicating the 10th and 90th percentiles. “+” indicates the mean. The shadow indicates the Chinese dietary reference intakes (ae) or the interquartile range of cluster 3 (f). *P < 0.05. GL glycemic load, MAR micronutrient adequacy ratio

Similar articles

References

    1. Cho NH, Shaw JE, Karuranga S, Huang Y, da Rocha Fernandes JD, Ohlrogge AW, et al. IDF Diabetes Atlas: Global estimates of diabetes prevalence for 2017 and projections for 2045. Diabetes Res Clin Pract. 2018;138:271–281. doi: 10.1016/j.diabres.2018.02.023. - DOI - PubMed
    1. National Diabetes Research Cooperative group A mass survey of diabetes mellitus in a population of 300,000 in 14 provinces and municipalities in China (author’s transl) Zhonghua Nei Ke Za Zhi. 1981;20:678–683. - PubMed
    1. Chan JCN, Malik V, Jia W, Kadowaki T, Yajnik CS, Yoon K-H, et al. Diabetes in Asia. JAMA. 2009;301:2129. doi: 10.1001/jama.2009.726. - DOI - PubMed
    1. Yang W, Lu J, Weng J, Jia W, Ji L, Xiao J, et al. Prevalence of diabetes among men and women in China. N Engl J Med. 2010;362:1090–1101. doi: 10.1056/NEJMoa0908292. - DOI - PubMed
    1. Xu Y. Prevalence and control of diabetes in Chinese adults. JAMA. 2013;310:948. doi: 10.1001/jama.2013.168118. - DOI - PubMed

LinkOut - more resources