. 2021 May 1;81(9):2345-2357.
doi: 10.1158/0008-5472.CAN-20-2870. Epub 2021 Mar 22.

GLUT1 Expression in Tumor-Associated Neutrophils Promotes Lung Cancer Growth and Resistance to Radiotherapy

Affiliations

GLUT1 Expression in Tumor-Associated Neutrophils Promotes Lung Cancer Growth and Resistance to Radiotherapy

Pierre-Benoit Ancey et al. Cancer Res. .

Abstract

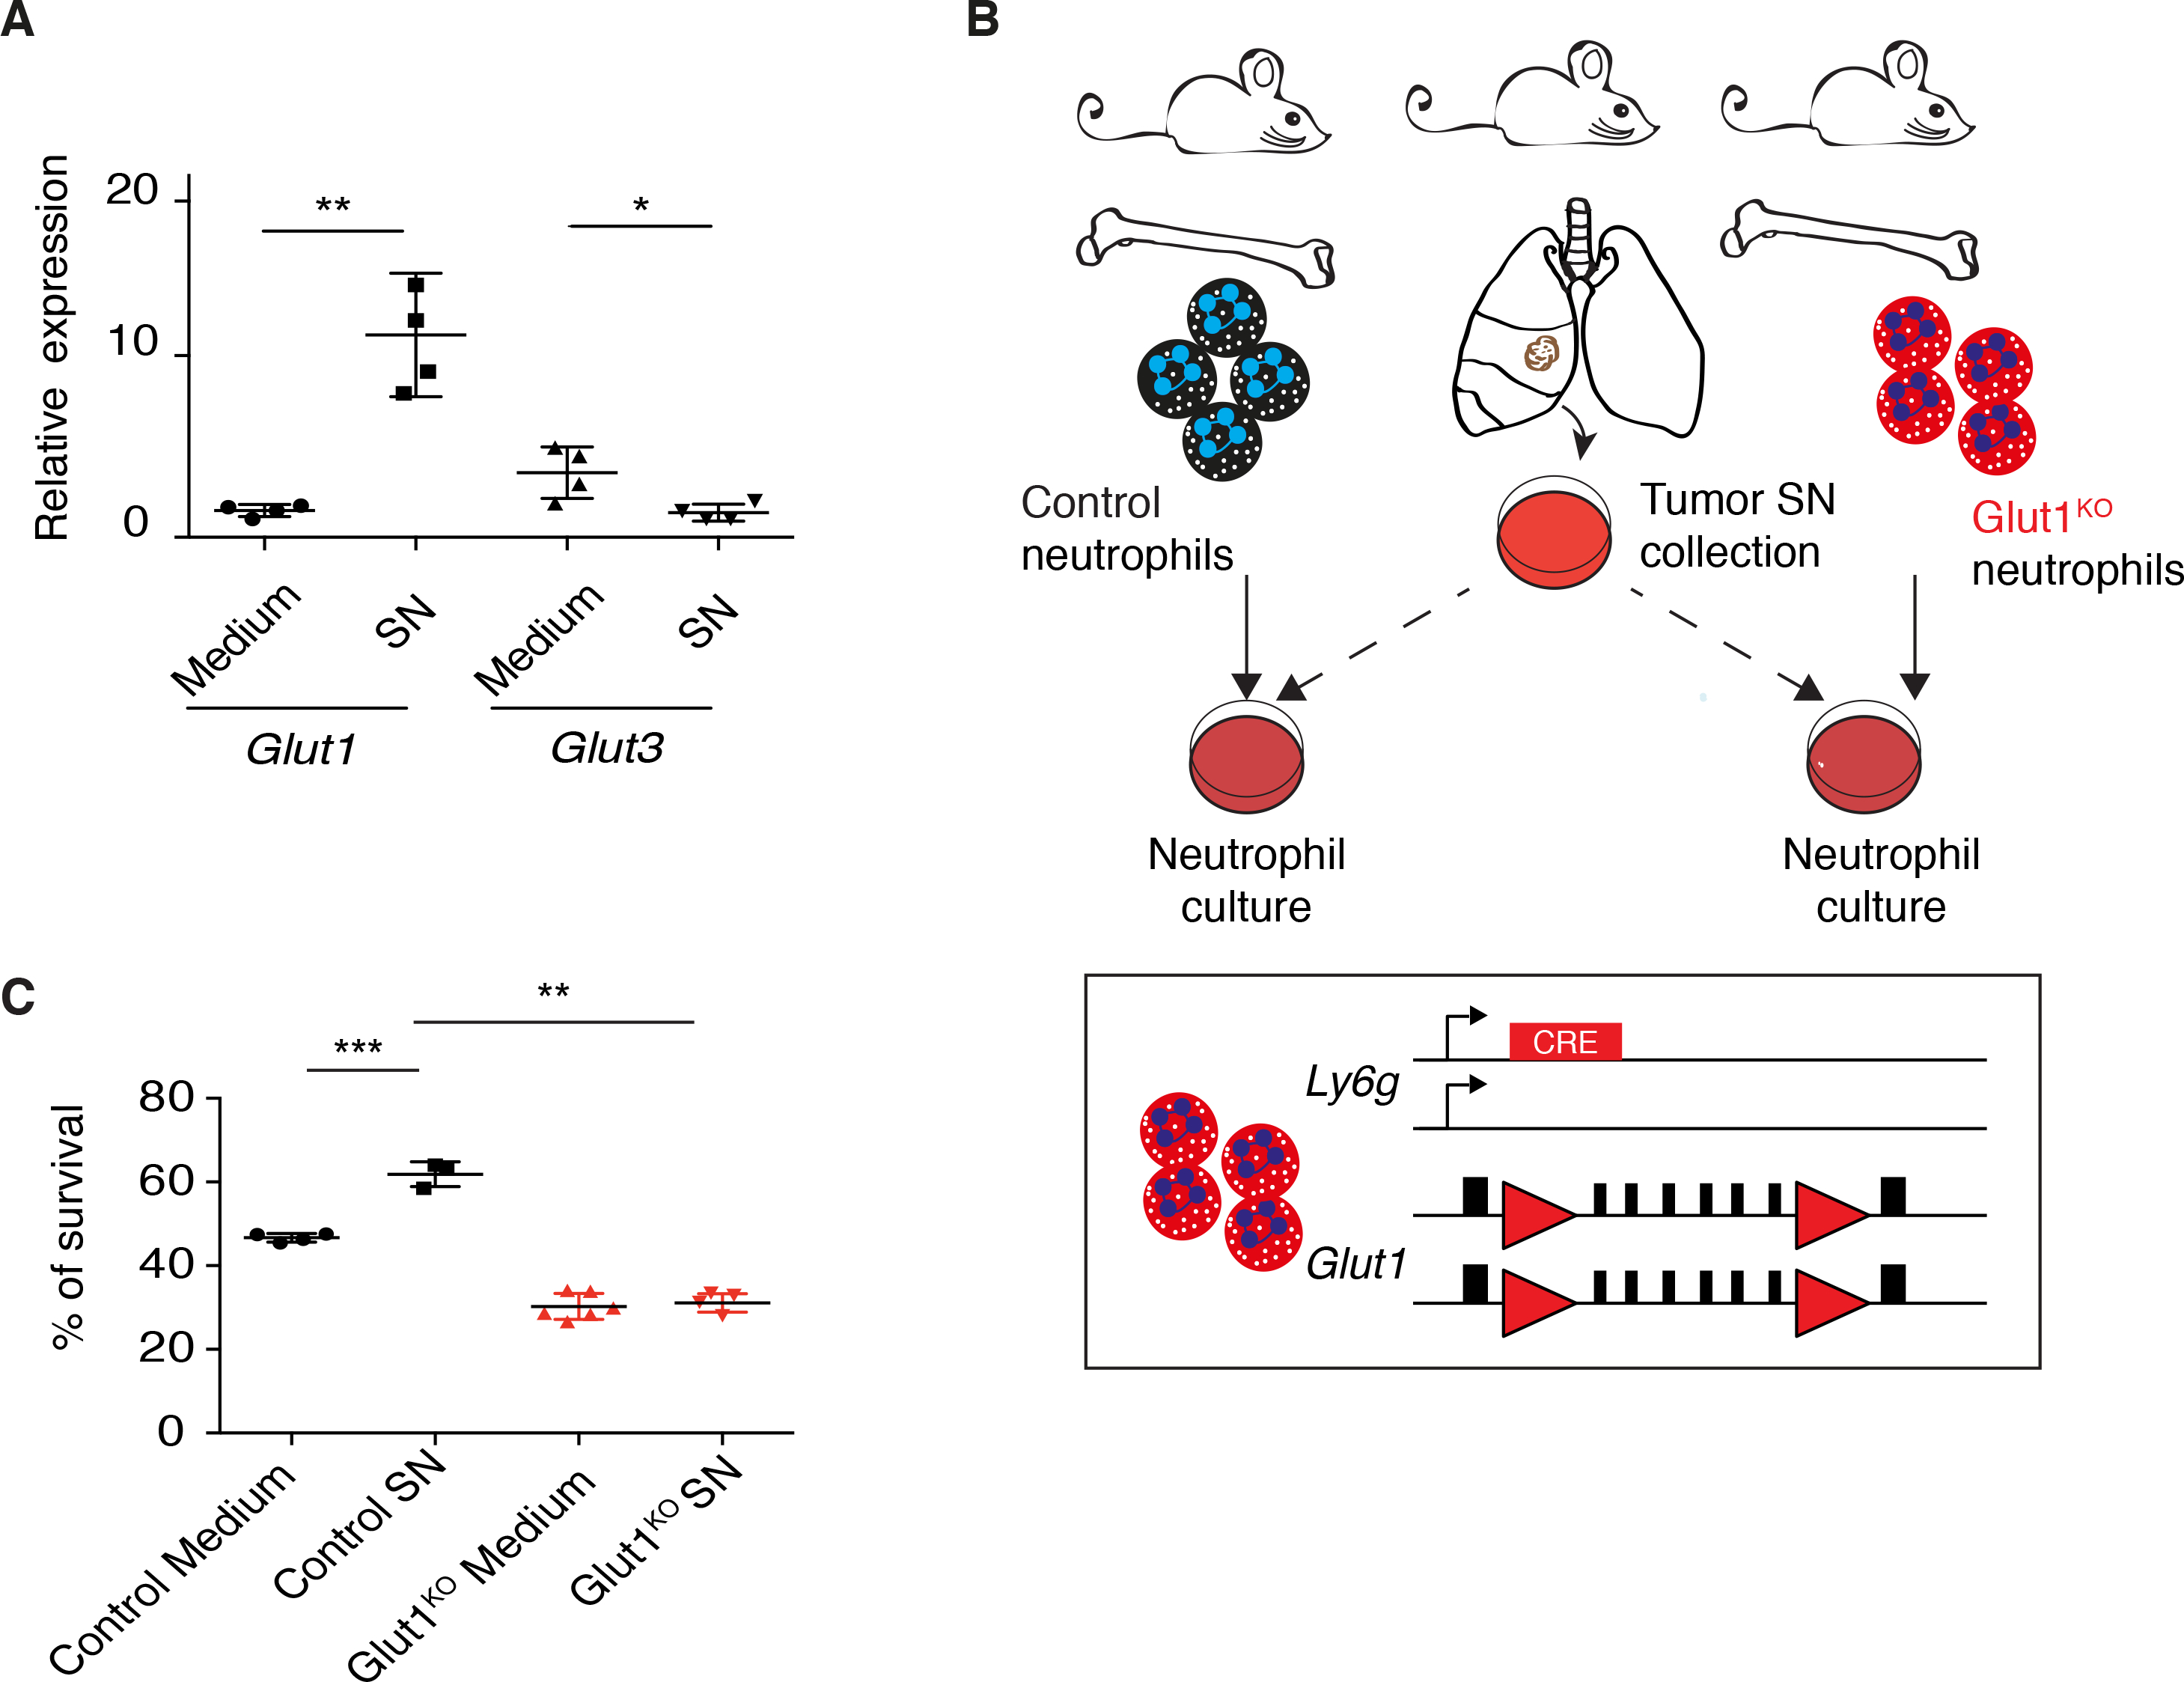
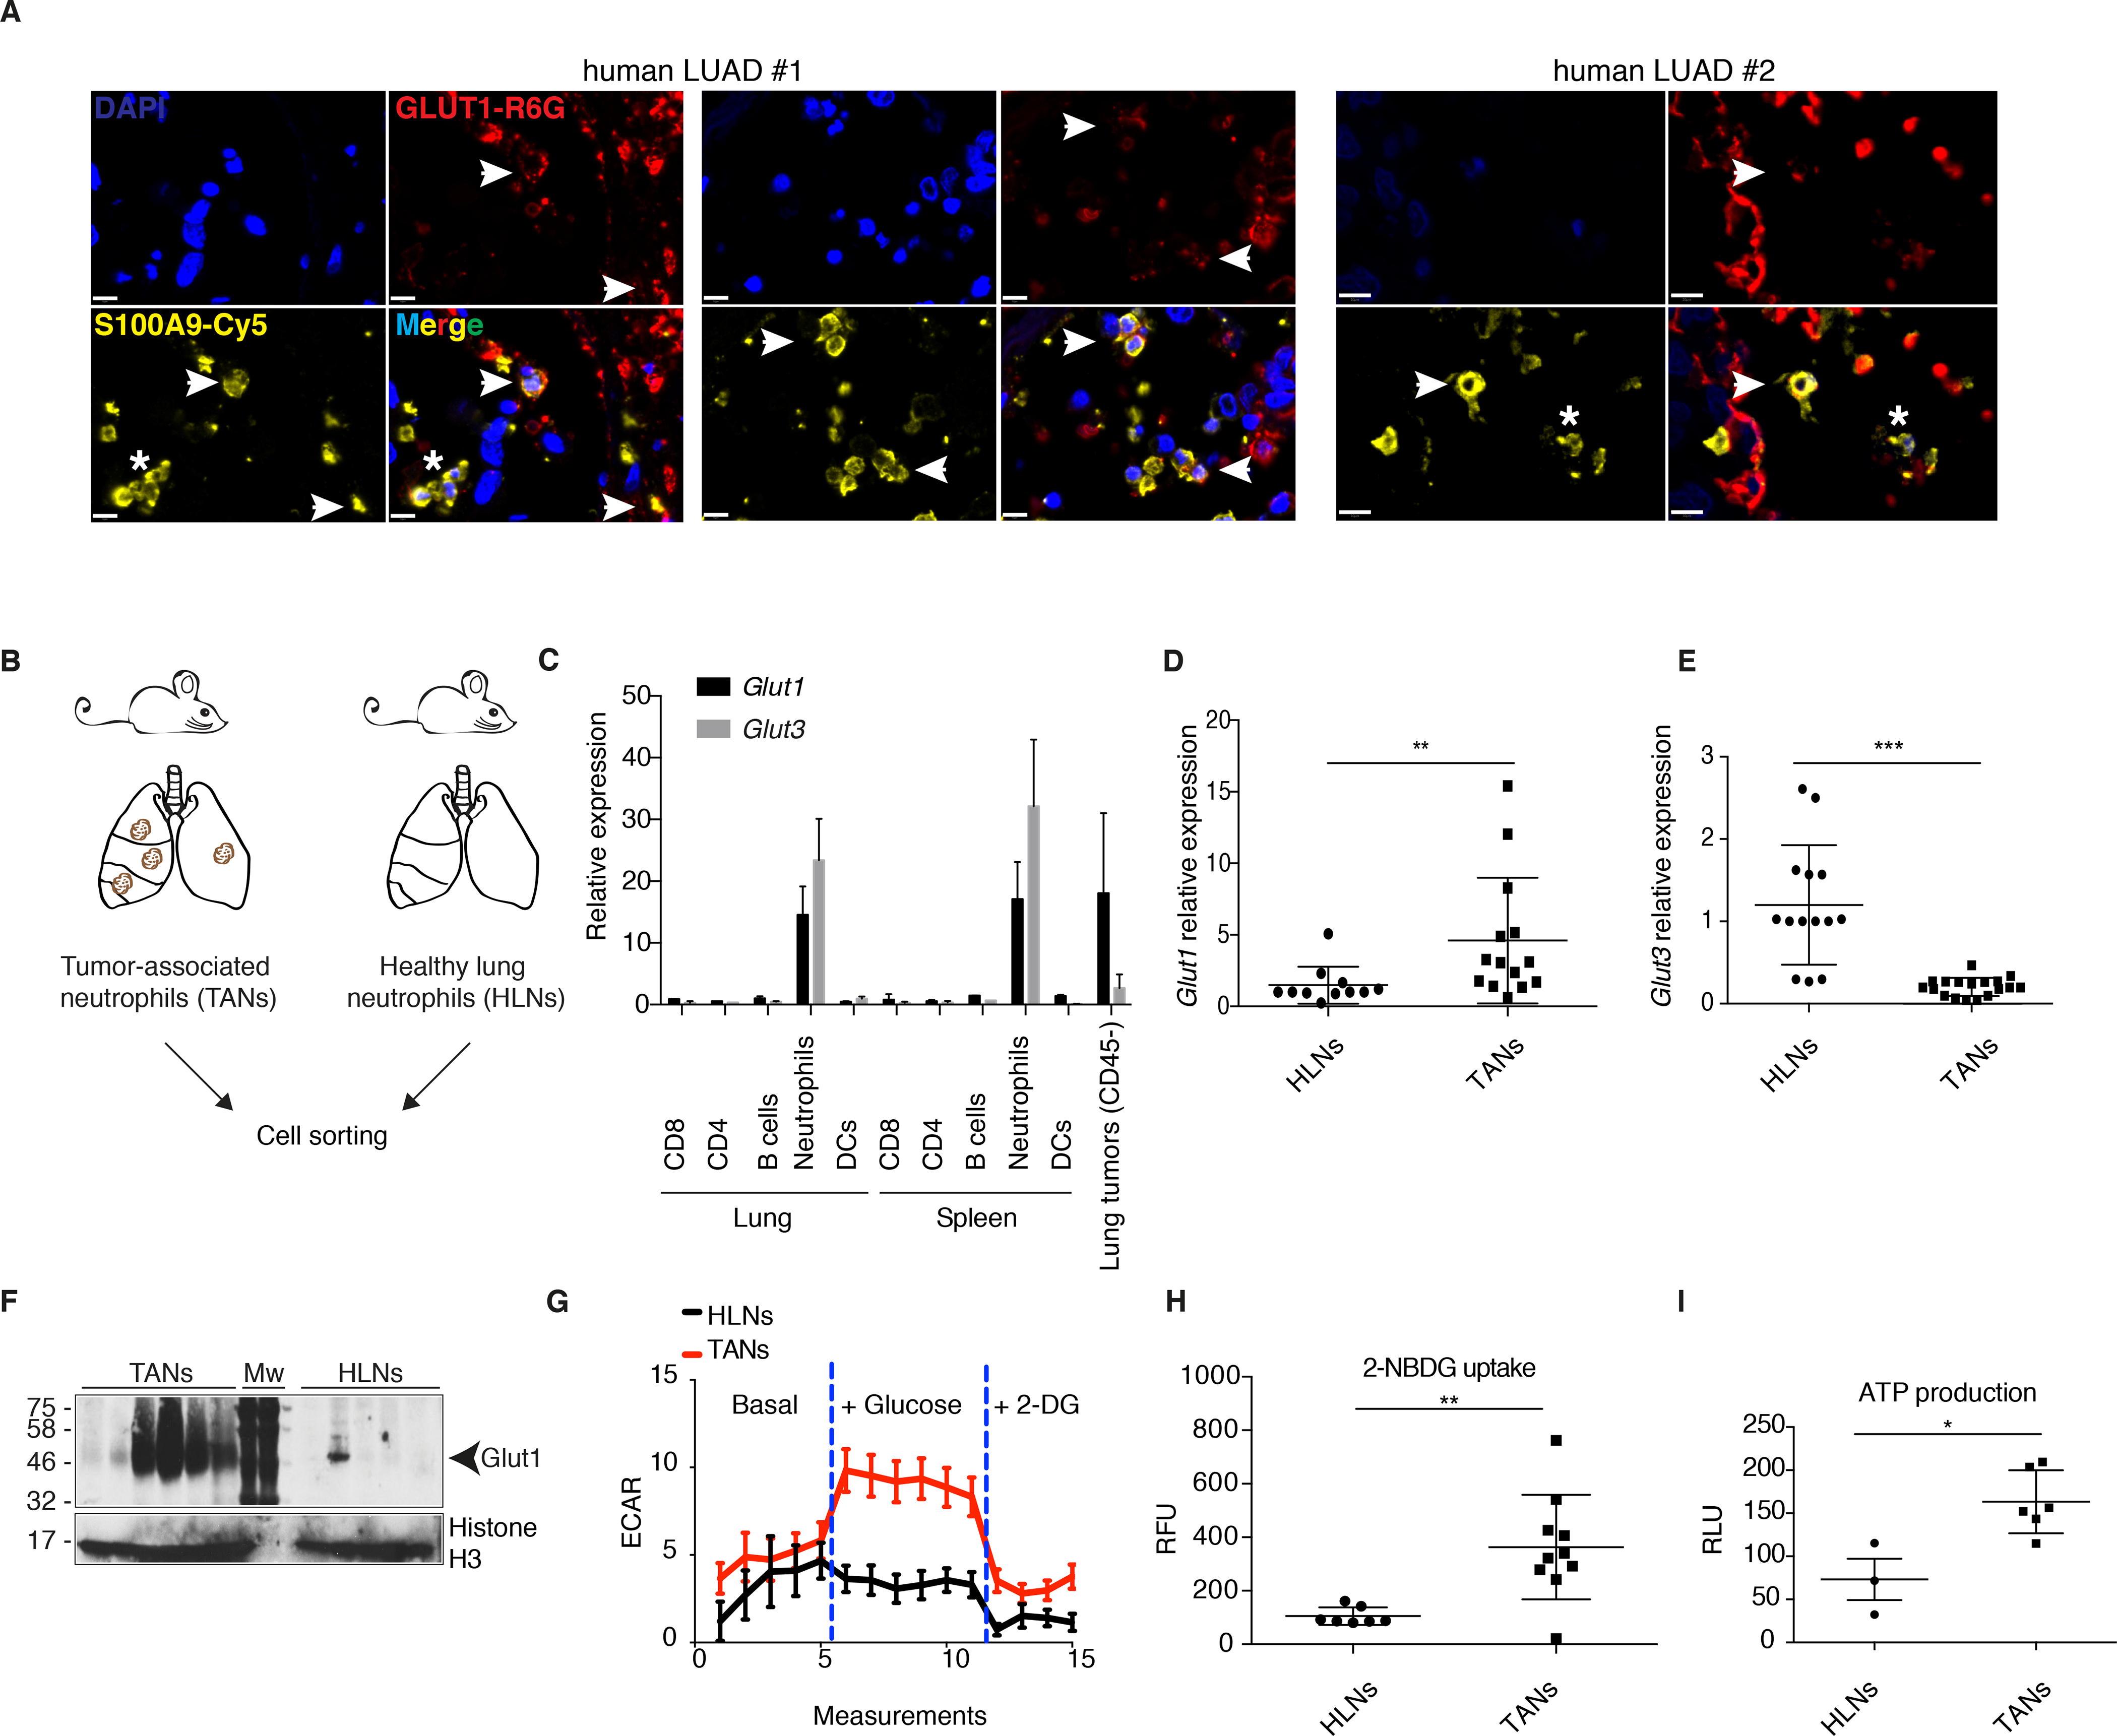
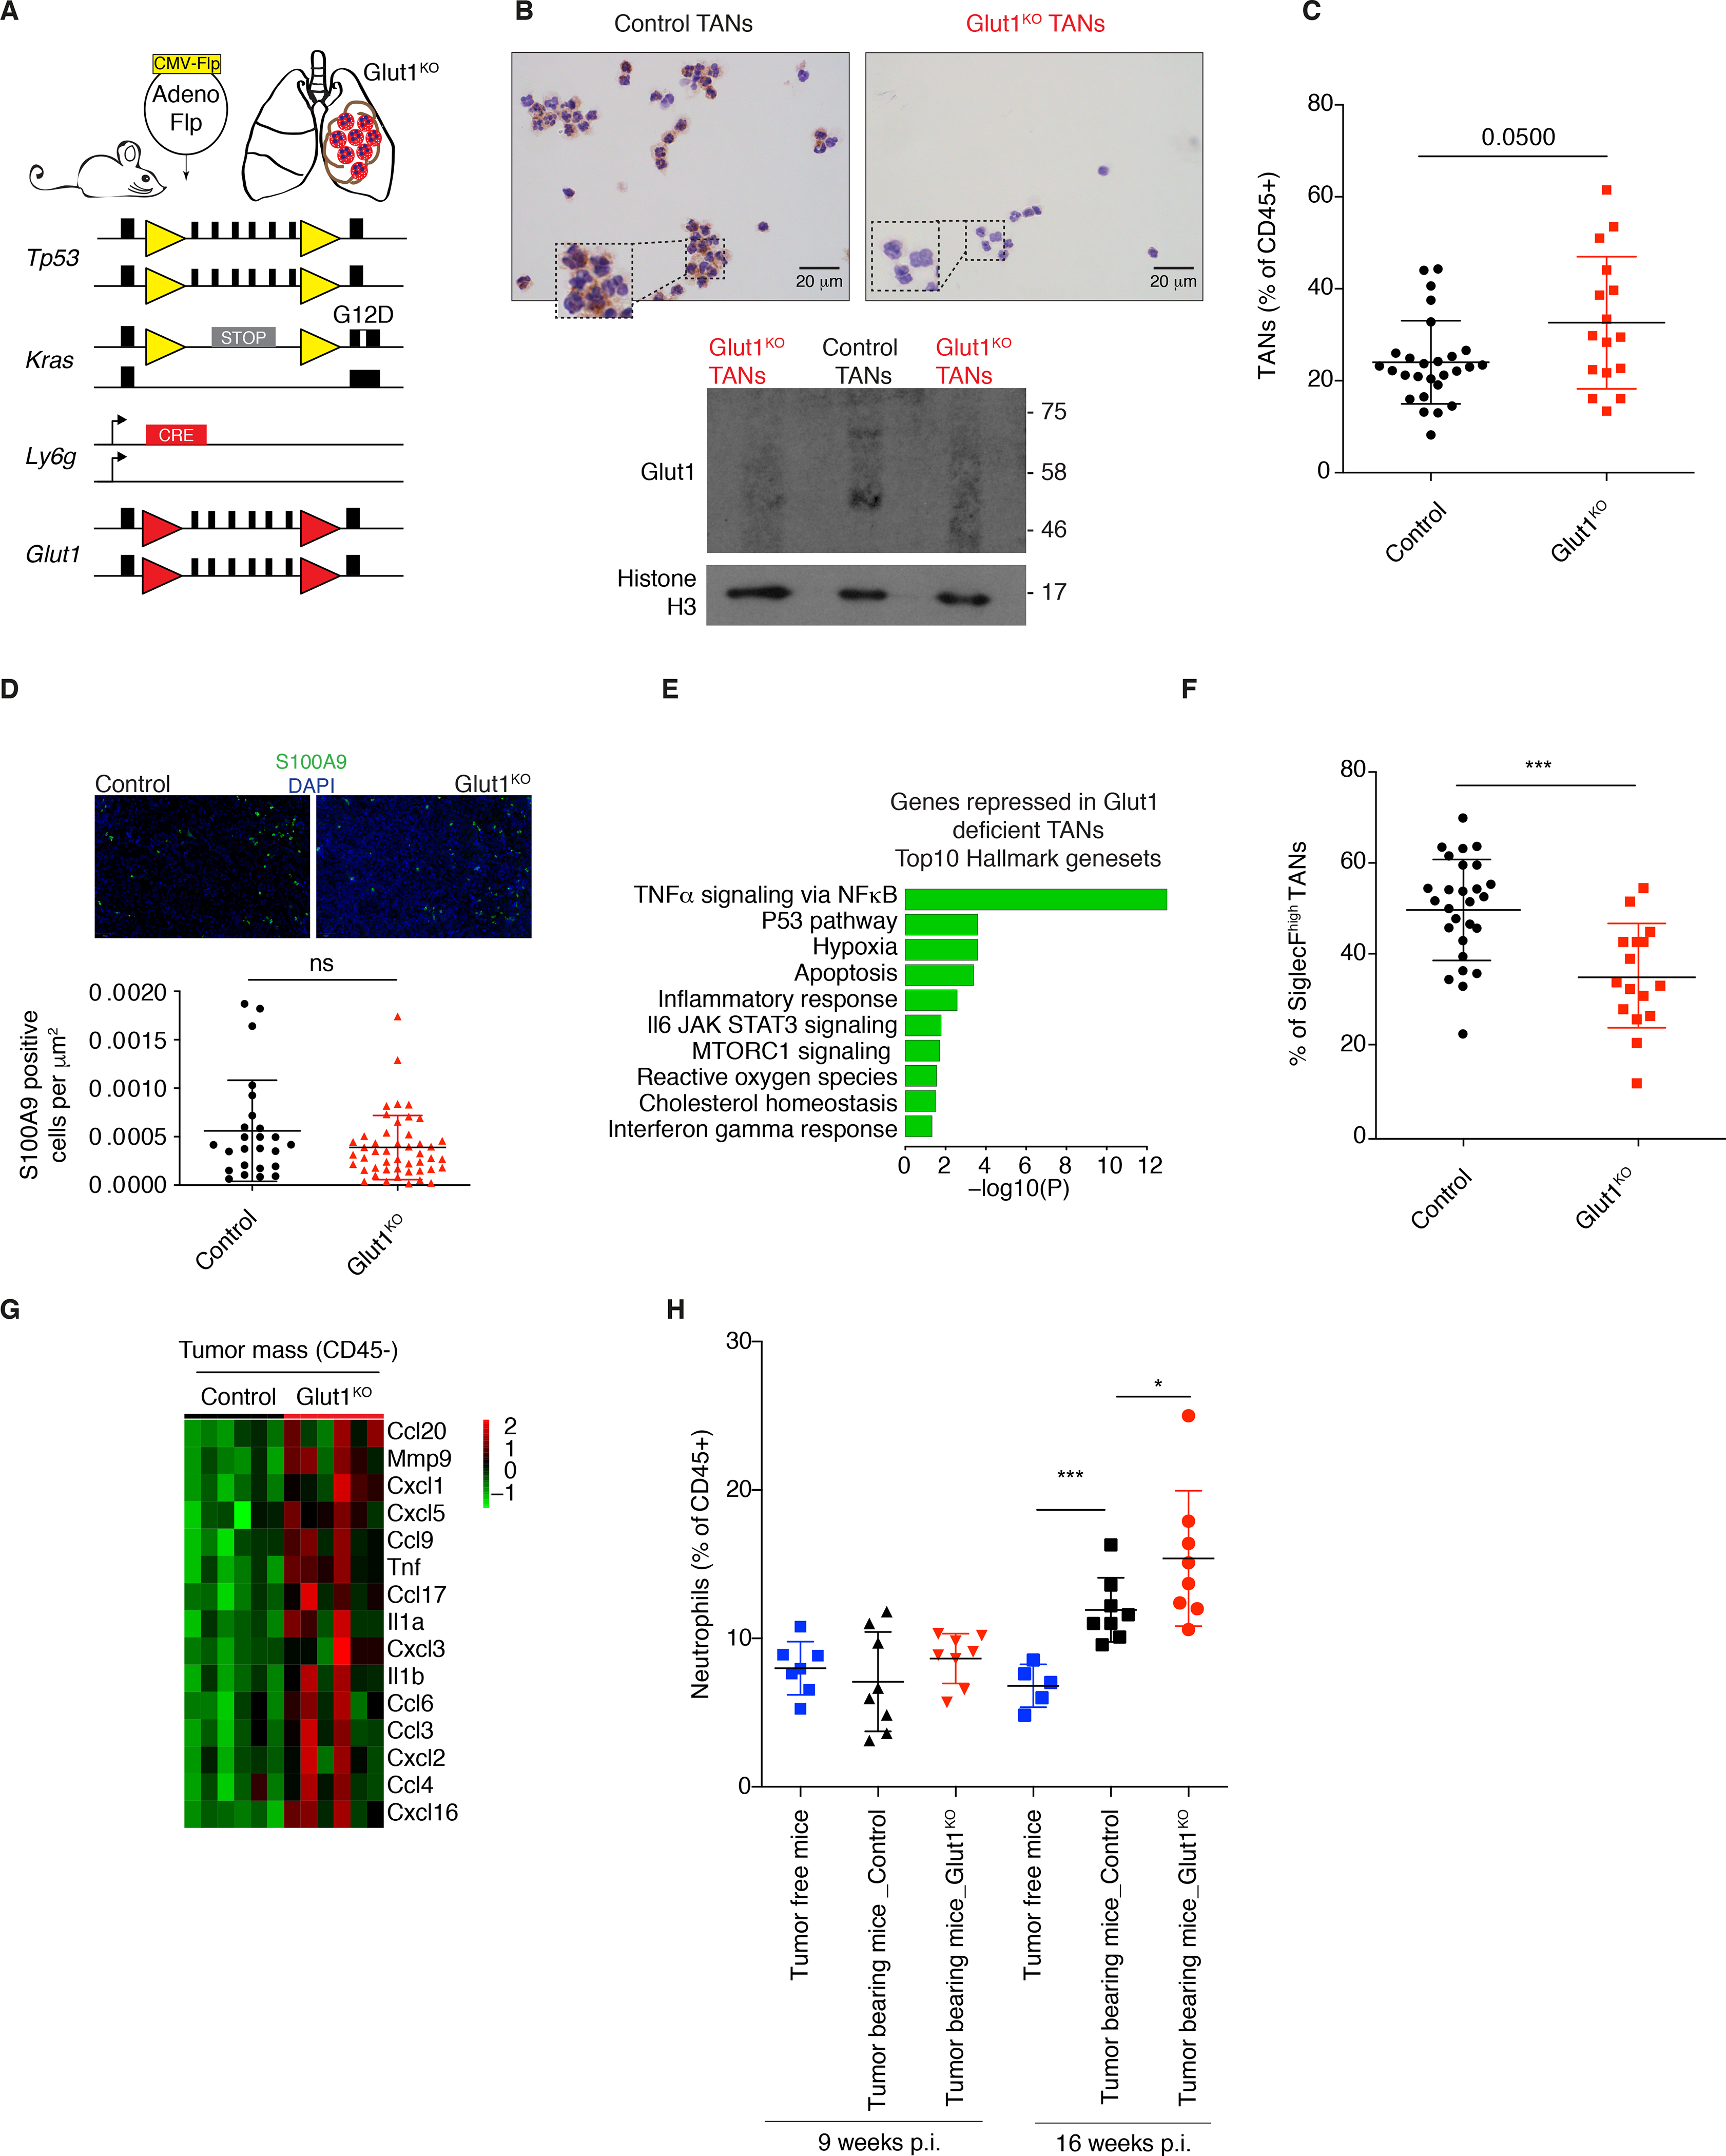
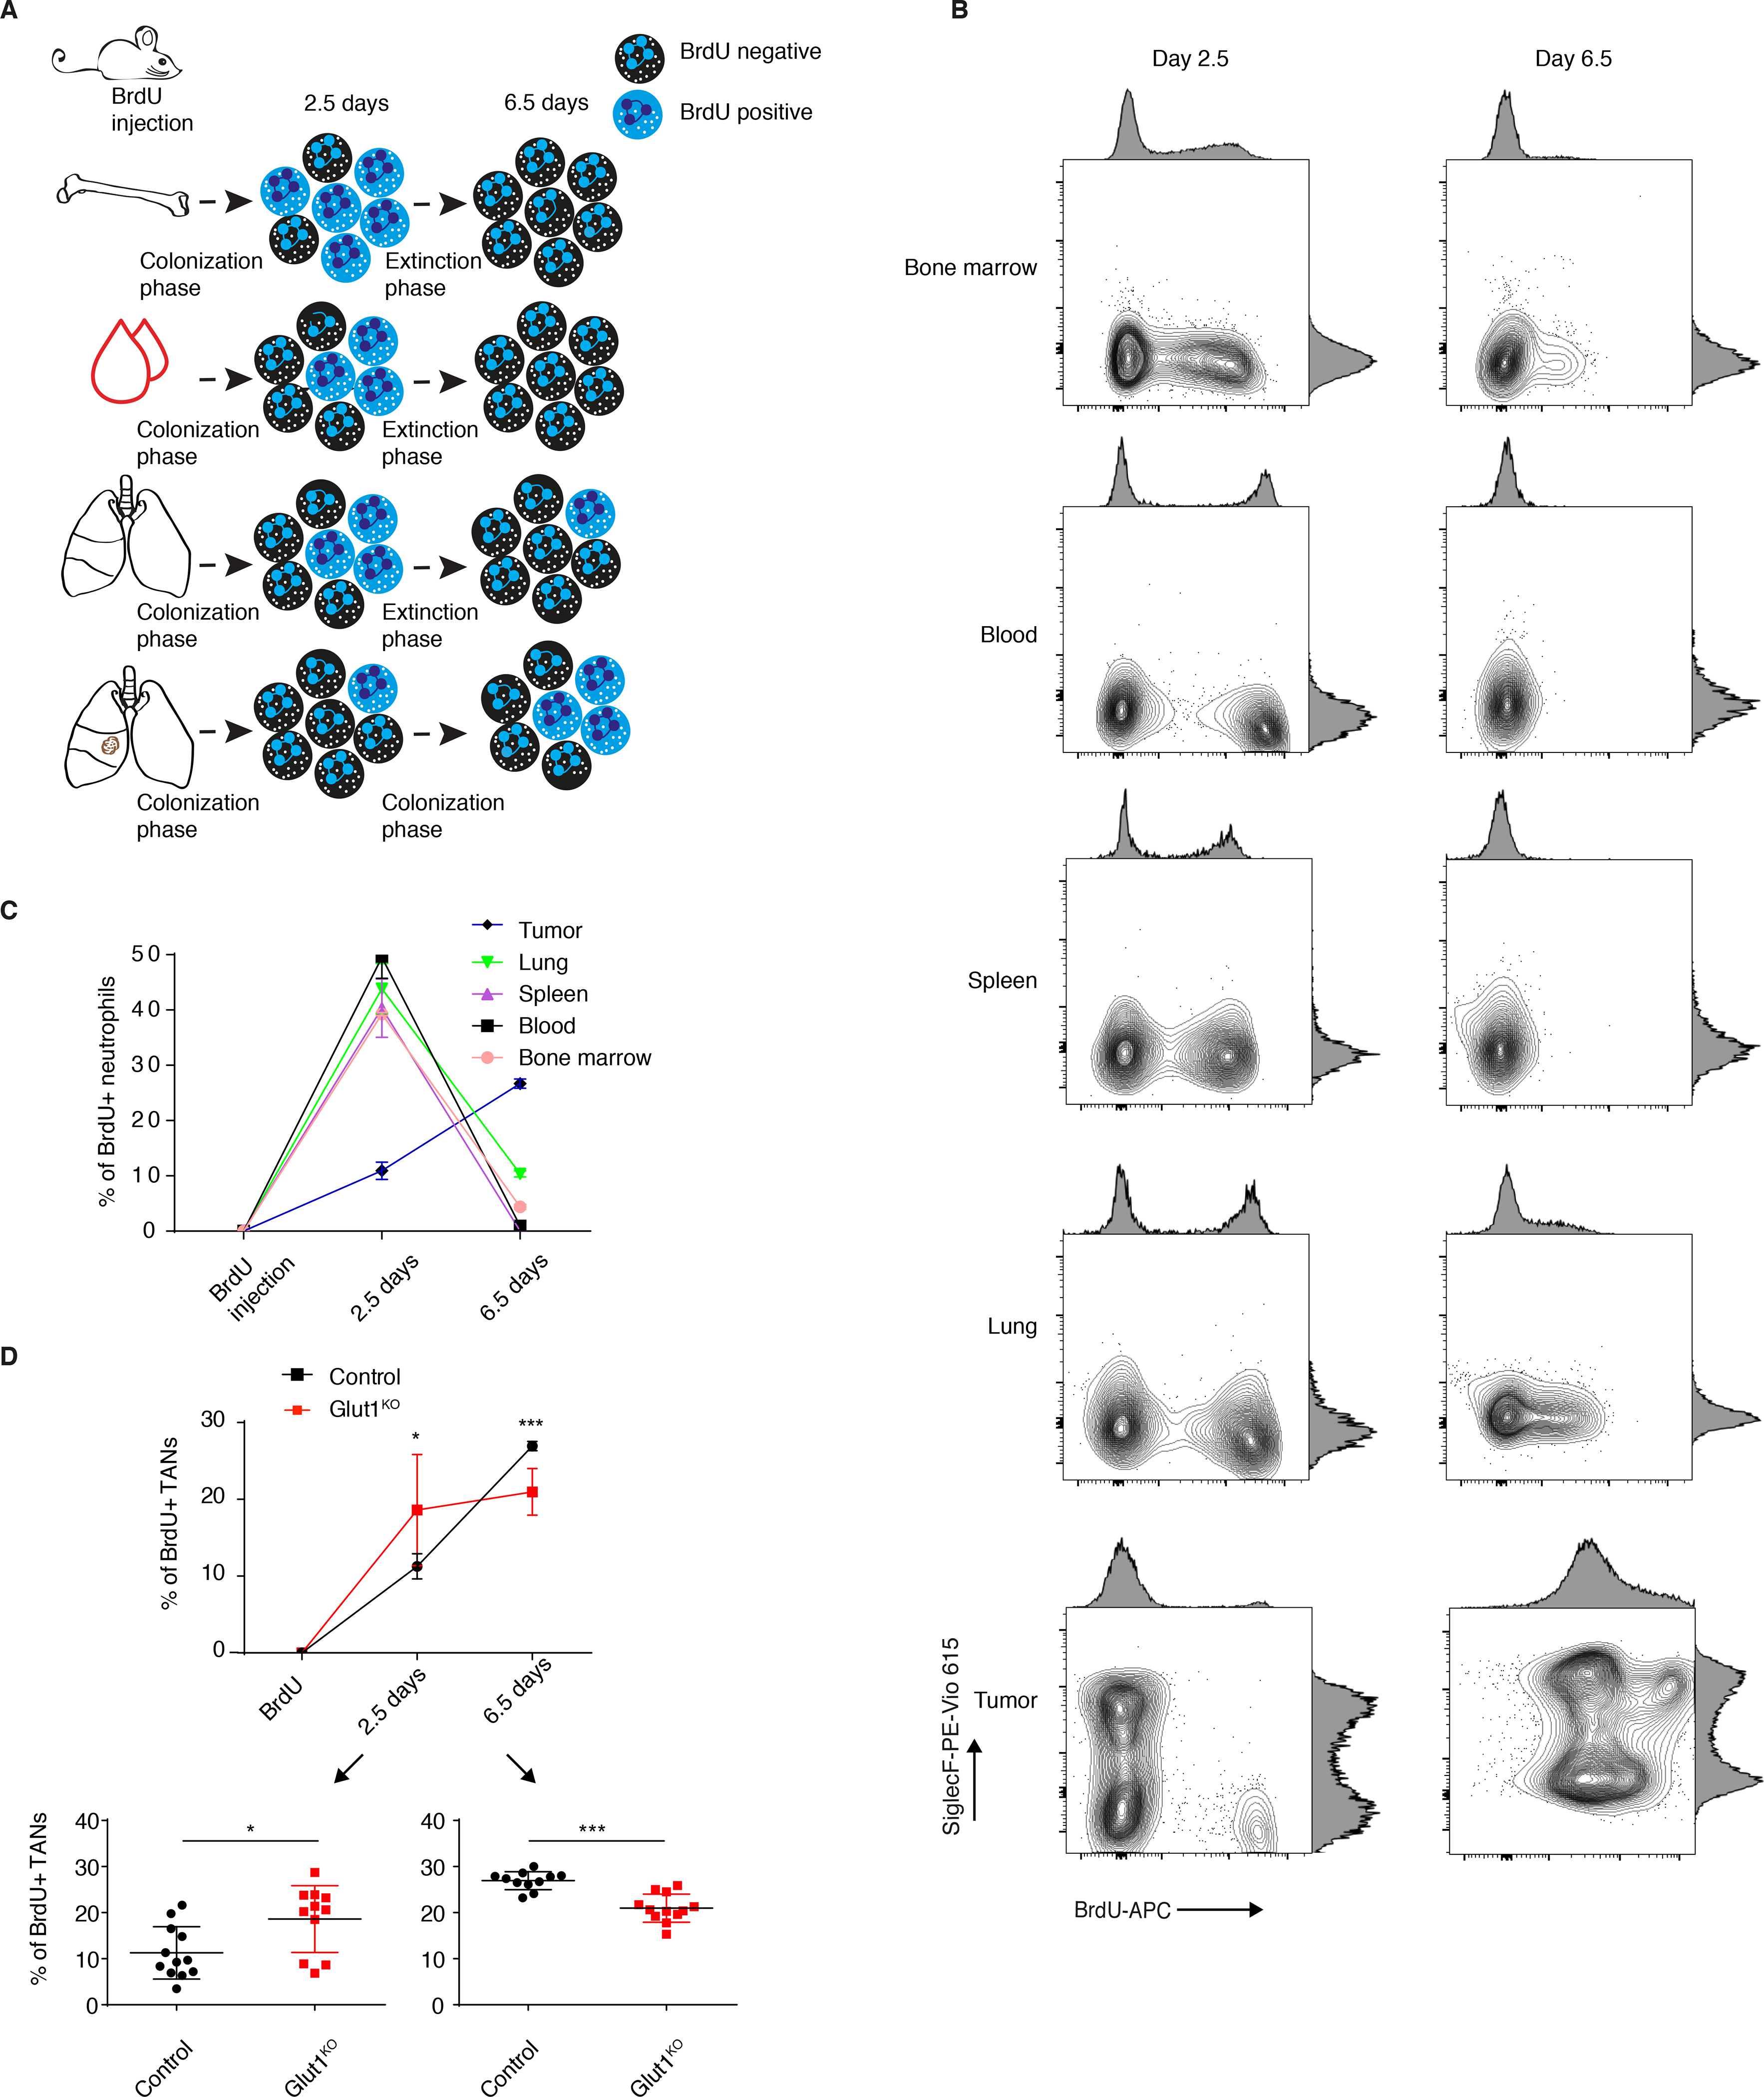
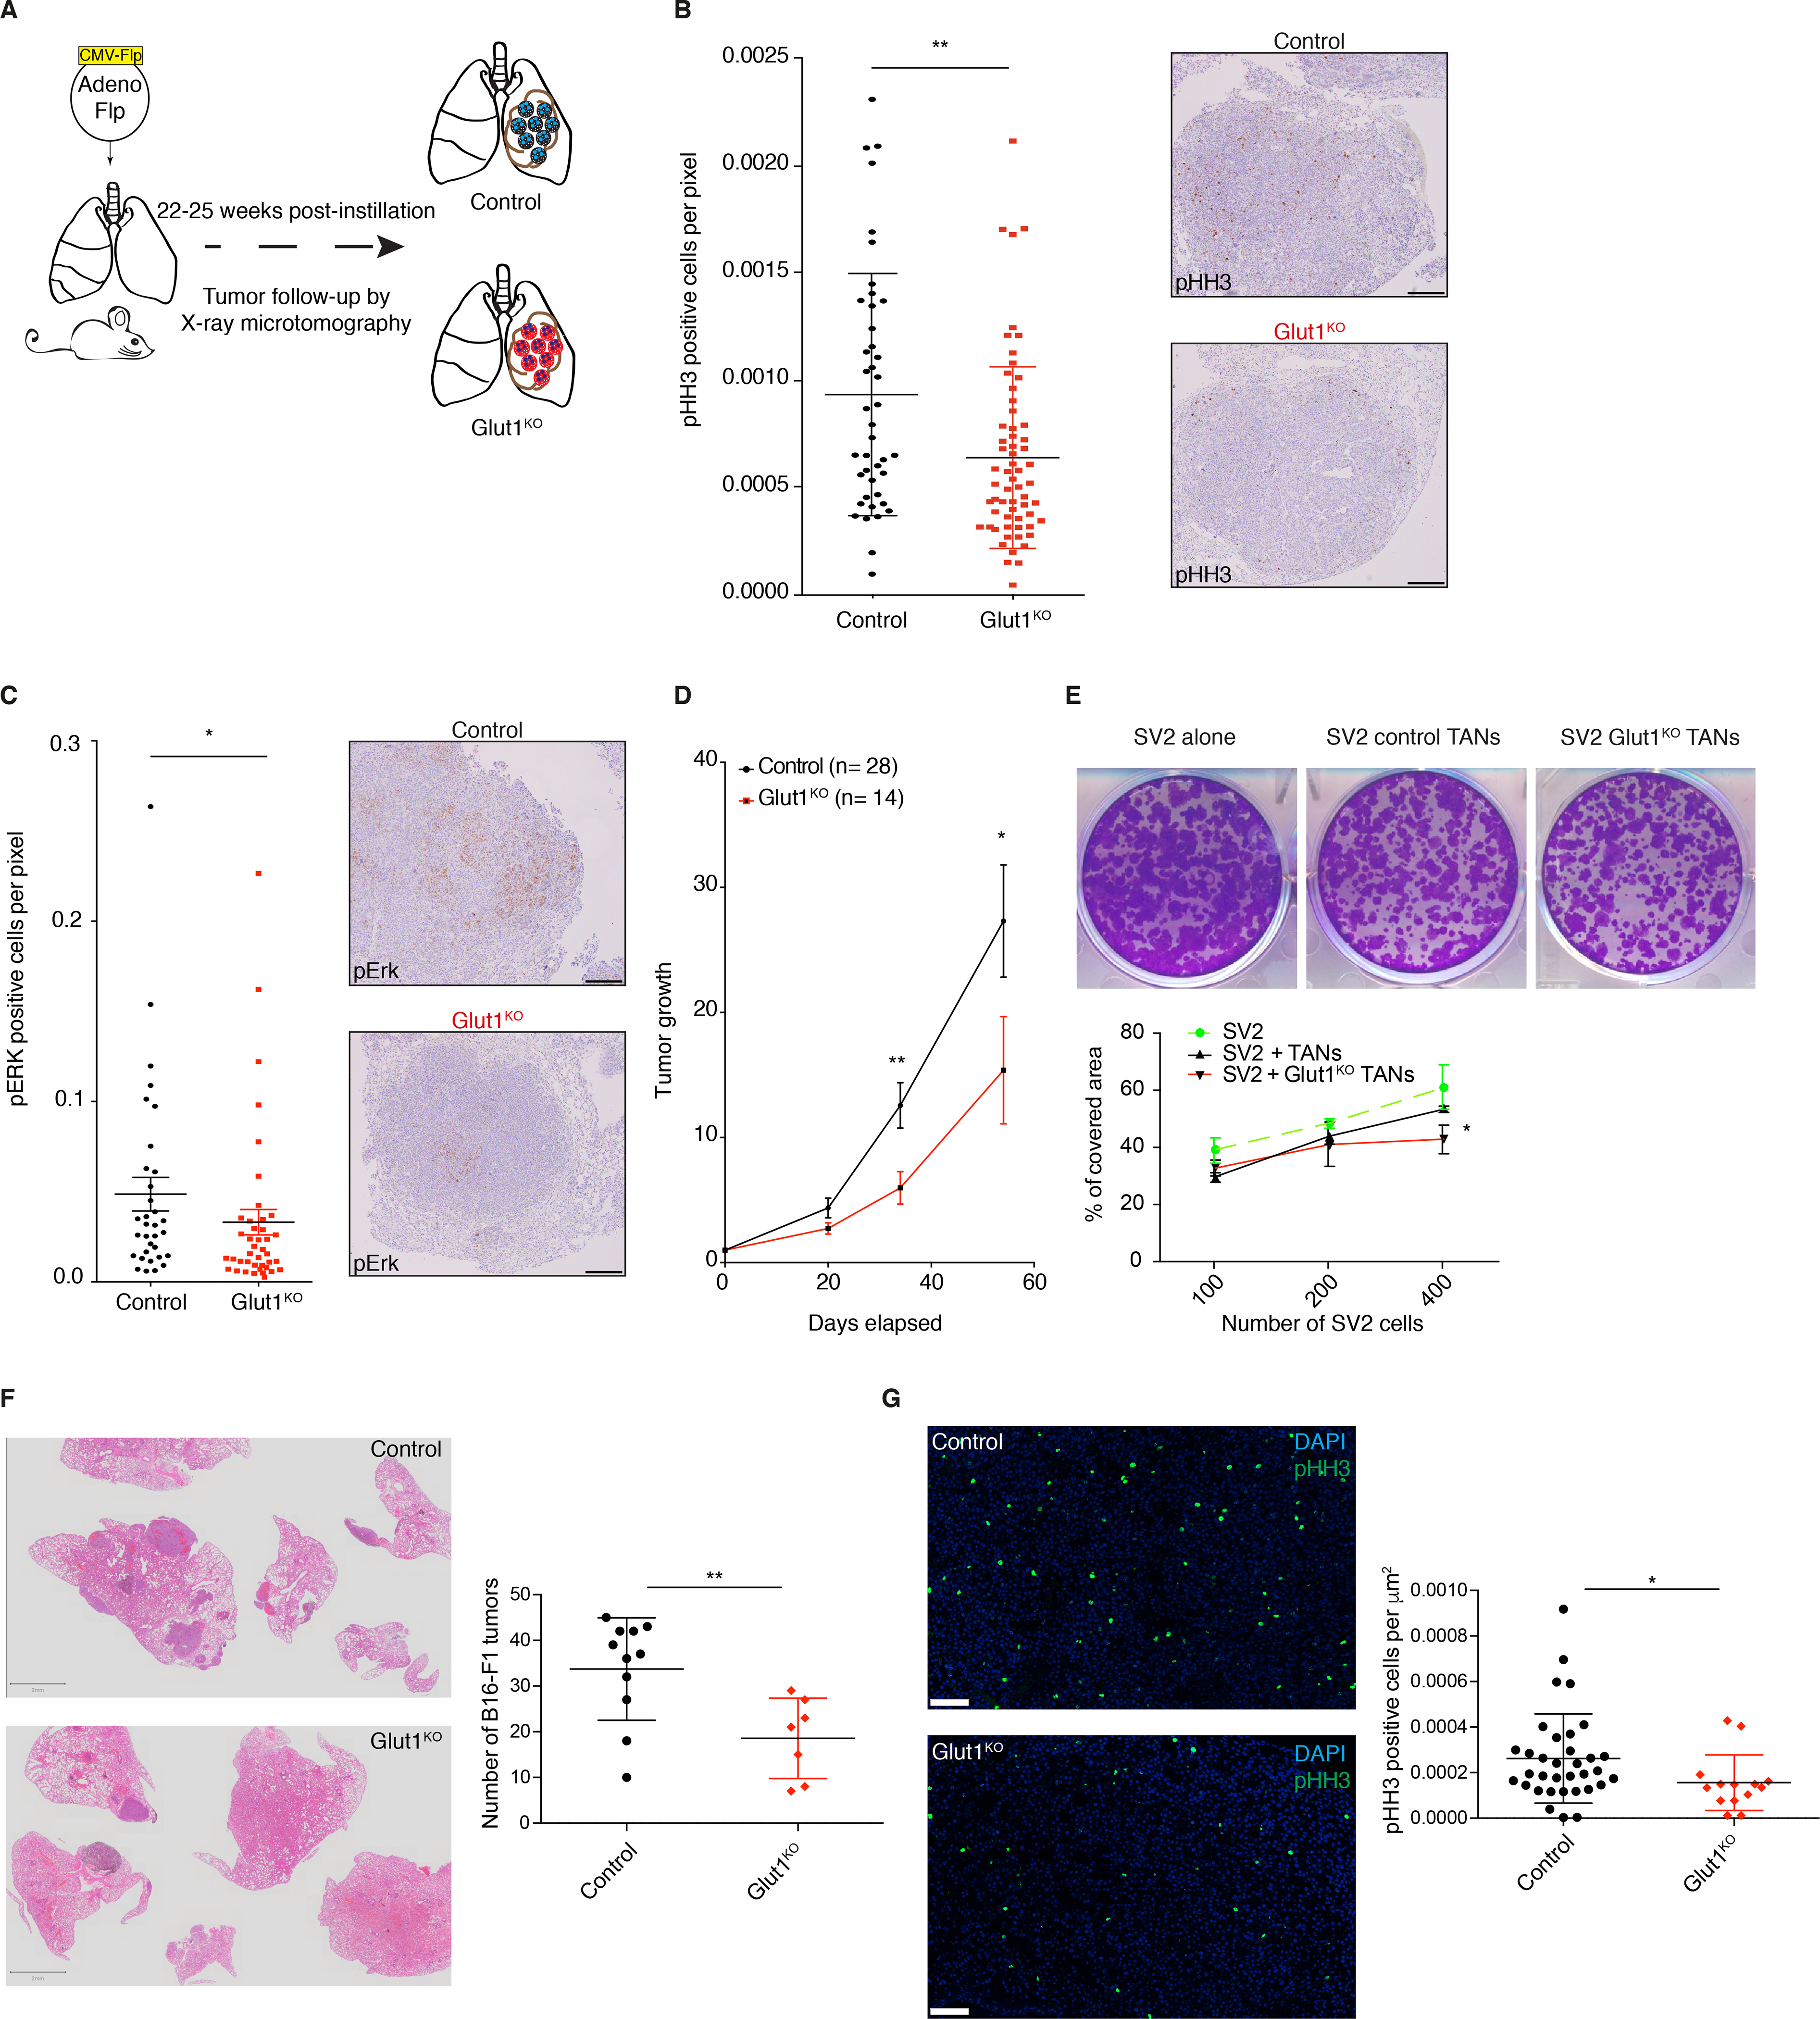
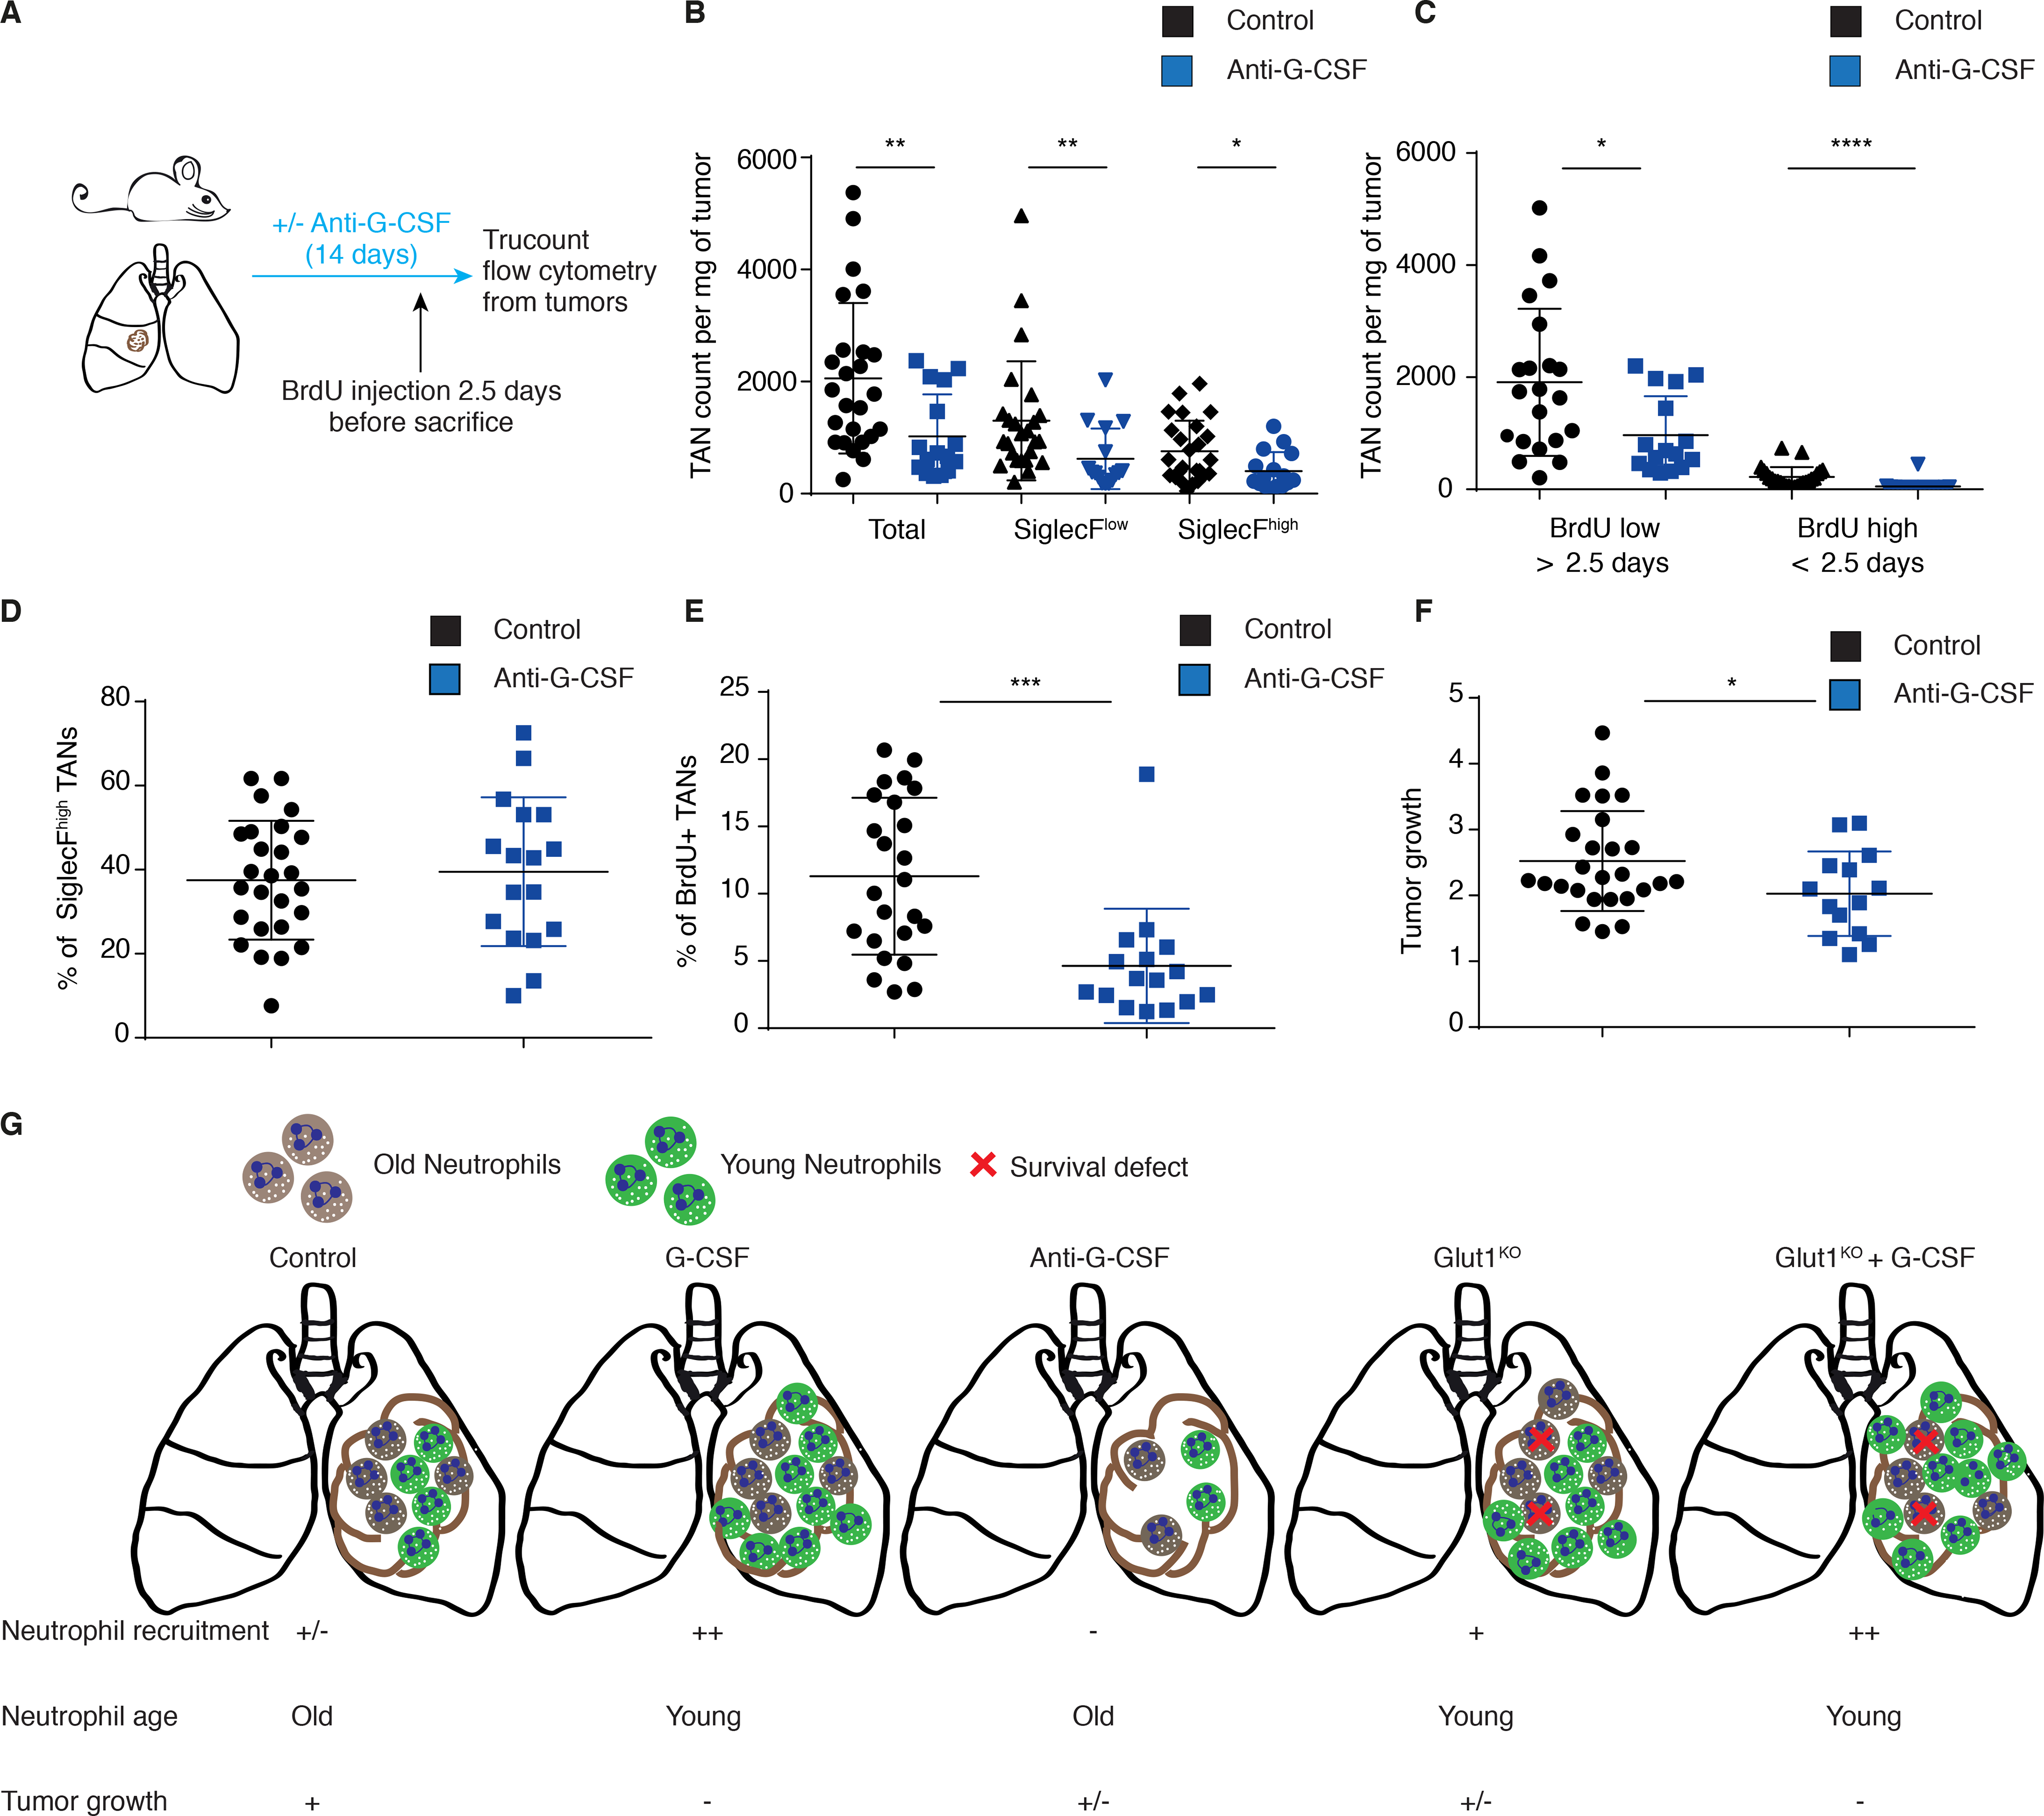
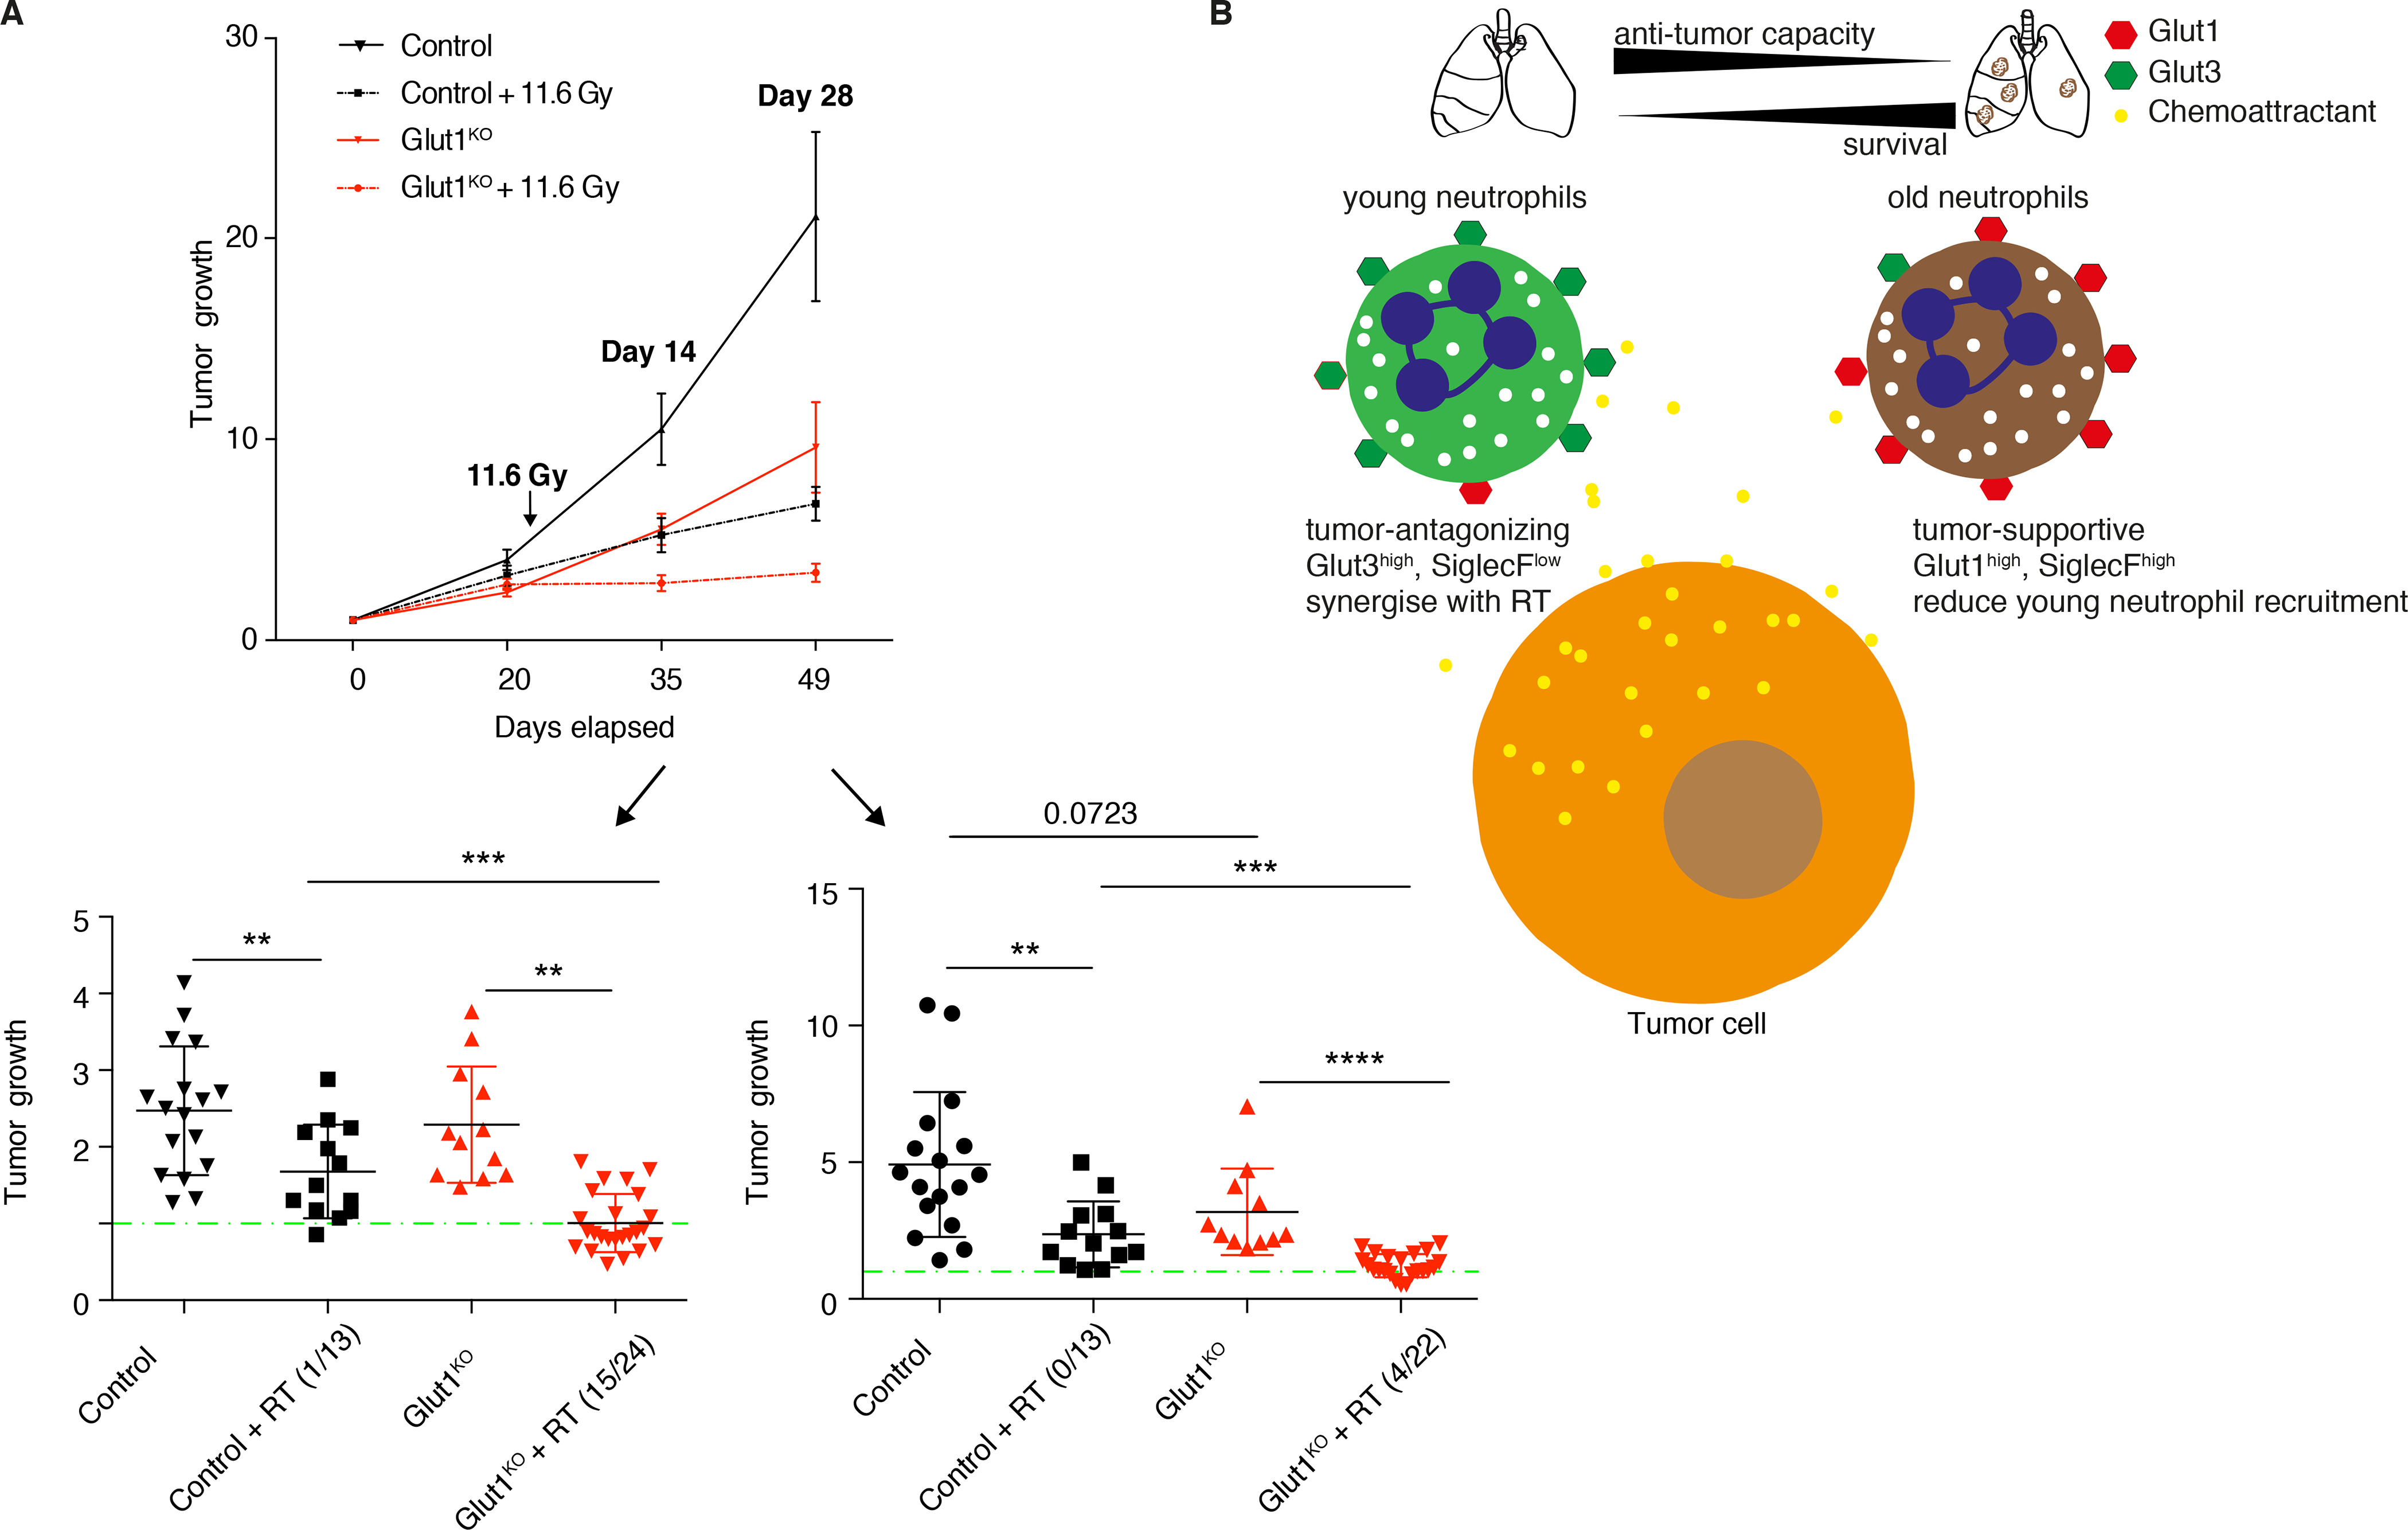
Neutrophils are the most abundant circulating leucocytes and are essential for innate immunity. In cancer, pro- or antitumor properties have been attributed to tumor-associated neutrophils (TAN). Here, focusing on TAN accumulation within lung tumors, we identify GLUT1 as an essential glucose transporter for their tumor supportive behavior. Compared with normal neutrophils, GLUT1 and glucose metabolism increased in TANs from a mouse model of lung adenocarcinoma. To elucidate the impact of glucose uptake on TANs, we used a strategy with two recombinases, dissociating tumor initiation from neutrophil-specific Glut1 deletion. Loss of GLUT1 accelerated neutrophil turnover in tumors and reduced a subset of TANs expressing SiglecF. In the absence of GLUT1 expression by TANs, tumor growth was diminished and the efficacy of radiotherapy was augmented. Our results demonstrate the importance of GLUT1 in TANs, which may affect their pro- versus antitumor behavior. These results also suggest targeting metabolic vulnerabilities to favor antitumor neutrophils. SIGNIFICANCE: Lung tumor support and radiotherapy resistance depend on GLUT1-mediated glucose uptake in tumor-associated neutrophils, indicating that metabolic vulnerabilities should be considered to target both tumor cells as well as innate immune cells. GRAPHICAL ABSTRACT: http://cancerres.aacrjournals.org/content/canres/81/9/2345/F1.large.jpg.


Figures

Figure 1.
Figure 1.. Glut1 expression is necessary for prolonged neutrophil survival.
A) Relative Glut1 and Glut3 expression by real-time PCR (mean ± s.d.) in response to supernatant (SN) or control medium. B) Schematic representation of the Glut1KO neutrophil model and survival assay. Red triangles, LoxP sites. C) WT or Glut1KO neutrophil survival (mean ± s.d.) after 20 hours in control medium or in presence of tumor-derived SN.
Figure 2.
Figure 2.. Tumor-associated neutrophils are more glycolytic than neutrophils from healthy lung.
A) Two human LUAD samples (with two different regions for the first one) showing TANs expressing (white arrowheads) or not (white asterisks) GLUT1. Staining was done with DAPI (dark blue), S100A9 (yellow) and GLUT1 (red). Scale bars: 10 μm. B) Schematic representation of the isolation of TANs and healthy lung neutrophils (HLNs). C) Glut1 and Glut3 expression (mean ± s.d.) in different cell-sorted populations from healthy lung or spleen, or from the CD45- fraction of lung tumors. D-E) Real-time PCR analyses of Glut1 and Glut3 expression (mean ± s.d.) in HLNs compared to TANs. F) Western blot of Glut1 from HLNs and TANs. Mw, molecular weight marker. G) Seahorse analysis to measure ECAR in response to glucose addition to the medium in HLNs compared to TANs (mean ± s.e.m.). H) Measurements of 2-NBDG uptake (mean ± s.d.) in HLNs compared to TANs. RFU, relative fluorescence units. I) ATP production in HLNs compared to TANs (mean ± s.d.). RLU, relative light units.
Figure 3.
Figure 3.. Neutrophil-specific Glut1 deletion reduces the proportion of SiglecFhigh TANs.
A) Schematic representation of the mouse model used. Yellow triangles, Frt sites; Red triangles, LoxP sites. B) Glut1 protein expression levels in isolated Glut1KO TANs or control TANs by immunocytochemistry. C) Neutrophil prevalence (mean ± s.d.) in KP tumors in control and Glut1KO conditions. D) Representative staining and quantification of S100A9 immunofluorescence from n= 25 control and n= 47 Glut1KO tumors. E) Top 10 pathways from Hallmark over-represented among the top 200 genes most repressed in Glut1KO TANs compared to WT TANs. P-value was computed with Fisher exact test. F) SiglecFhigh cells among control and Glut1KO TANs (mean ± s.d.). G) Heatmap of chemoattractant genes overexpressed in CD45- cells in Glut1KO compared to control neutrophil conditions. H) Neutrophil proportions in the blood of healthy and tumor-bearing mice 9 or 16 weeks post-tumor initiation (p.i.) (mean ± s.d.).
Figure 4.
Figure 4.. Neutrophil-specific Glut1 deletion accelerates their turnover.
A) Schematic representation of the BrdU experiments. B) Representative BrdU and SiglecF staining in neutrophils from the bone marrow, blood, healthy spleen, healthy lung and tumors 2.5 and 6.5 days after a single BrdU injection. C) BrdU positive neutrophil percentage (mean ± s.d.) among neutrophils in the bone marrow, blood, healthy spleen, healthy lung and tumors 2.5 and 6.5 days after a single BrdU injection. D) Neutrophil turnover kinetics experiment, with detailed measurements at 2.5 (lower left) and 6.5 days (lower right) after BrdU injection in tumors in control and Glut1KO conditions (mean ± s.d.).
Figure 5.
Figure 5.. Glut1 deletion in neutrophils reduces tumor growth.
A) Schematic representation of the experiments. B) (left) Quantification of phospho-Histone H3 (pHH3) staining in Glut1KO or control tumors (mean ± s.d.). (right) Representative staining of pHH3 in tumors. Scale bars: 200 μm. C) (left) Quantification of phospho-ERK (pERK) staining in tumors (mean ± s.d.). (right) Representative staining of pERK in tumors. Scale bars: 200 μm. D) Long-term μCT analysis of tumor-bearing mice. Data represent tumor volumes (mean ± s.e.m.) normalized to the first volume (set to 1) of the same tumors in control or GLUT1KO. Control n= 28 tumors; Glut1KO n= 14 tumors. E) Representative images (upper panel) of the SV2 cell line spreading assay, cultured alone or in presence of control or Glut1KO TANs. (lower panel), cell-covered area quantification of SV2 cell lines cultured alone or in presence of control or Glut1KO TANs. F) Representative Hematoxylin and Eosin (H&E) staining of experimental lung metastases from B16-F1 melanoma cells (left panel, scale bars: 2 mm). (right panel) Tumor quantification. G) Representative pHH3 imunofluorescence staining (left panel, scale bars: 100 μm) and quantification (right panel).
Figure 6.
Figure 6.. G-CSF neutralization reduces TAN numbers and tumor growth.
A) Schematic representation of the experiment. B) Trucount flow cytometry of total, SiglecFlow or SiglecFhigh TANs in control or anti-G-CSF conditions (mean ± s.d.). C) Trucount flow cytometry of BrdU positive and negative neutrophils in control or anti-G-CSF conditions (mean ± s.d.). D) Percentage of SiglecFhigh TANs in control or anti G-CSF conditions (mean ± s.d.). E) Percentage of young TANs (< 2.5 days) in control or anti G-CSF conditions (mean ± s.d.). F) μCT analysis of tumor growth in control or anti G-CSF conditions (mean ± s.d.). G) Schematic representation to summarize the conclusions linking neutrophil lifespan and tumor progression.
Figure 7.
Figure 7.. Glut1 deletion in neutrophils increases radiotherapy efficacy.
A) μCT analysis of control or Glut1KO tumors before and after 11.6 Gy radiotherapy (RT) or untreated (mean ± s.e.m.), normalized to the first volume (set to 1) of the same tumors. The tumors’ progression or regression are detailed at 14 days (lower left, n= 17, 13, 12 and 24) and 28 days (lower right, n=17, 13, 11 and 22) after radiotherapy (mean ± s.e.m.). The green line indicates a growth of 1 and numbers indicate the number of tumors with a reduced volume. B) Model illustrating the findings from this study. In the tumor, two neutrophil subpopulations exist. The young Glut3high anti-tumor neutrophils are recruited by chemoattractants secreted by the non-immune fraction of the tumor, presumably tumor cells. Within the tumor, neutrophils become dependent on Glut1 to survive and to support on-site aging and differentiation. This extensive survival forms a second subpopulation of neutrophils expressing SiglecF and exhibiting tumor-supportive properties. These old neutrophils limit chemoattractant production by tumor cells, thus inhibiting the recruitment of young neutrophils.

Similar articles

Cited by

References

    1. Rungelrath V, Kobayashi SD, DeLeo FR. Neutrophils in innate immunity and systems biology-level approaches. Wiley Interdiscip Rev Syst Biol Med. 2019;e1458. - PMC - PubMed
    1. Ocana A, Nieto-Jiménez C, Pandiella A, Templeton AJ. Neutrophils in cancer: prognostic role and therapeutic strategies. Mol Cancer. 2017;16. - PMC - PubMed
    1. Eruslanov EB, Singhal S, Albelda SM. Mouse versus human neutrophils in cancer–a major knowledge gap. Trends Cancer. 2017;3:149–60. - PMC - PubMed
    1. Coffelt SB, Kersten K, Doornebal CW, Weiden J, Vrijland K, Hau C-S, et al. IL17-producing γδ T cells and neutrophils conspire to promote breast cancer metastasis. Nature. 2015;522:345–8. - PMC - PubMed
    1. Wculek SK, Malanchi I. Neutrophils support lung colonization of metastasis-initiating breast cancer cells. Nature. 2015;528:413–7. - PMC - PubMed

Publication types

MeSH terms

Substances