. 2021 Mar 30;118(13):e2012748118.
doi: 10.1073/pnas.2012748118.

A glutaminase isoform switch drives therapeutic resistance and disease progression of prostate cancer

Affiliations

A glutaminase isoform switch drives therapeutic resistance and disease progression of prostate cancer

Lingfan Xu et al. Proc Natl Acad Sci U S A. .

Abstract

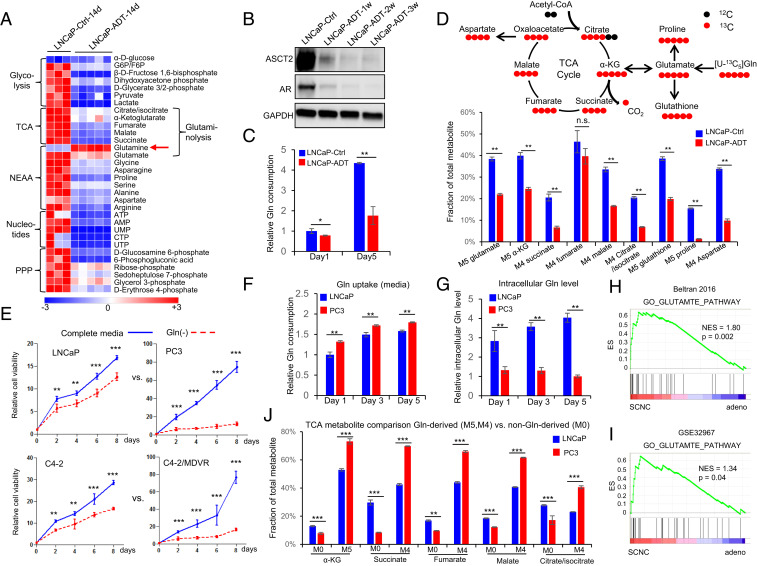
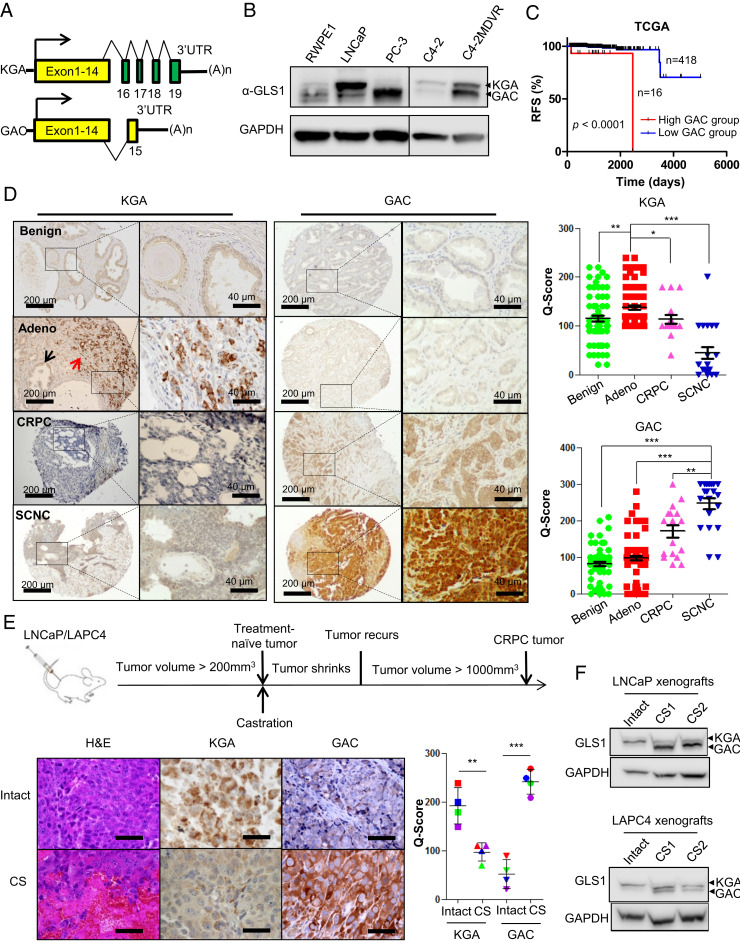
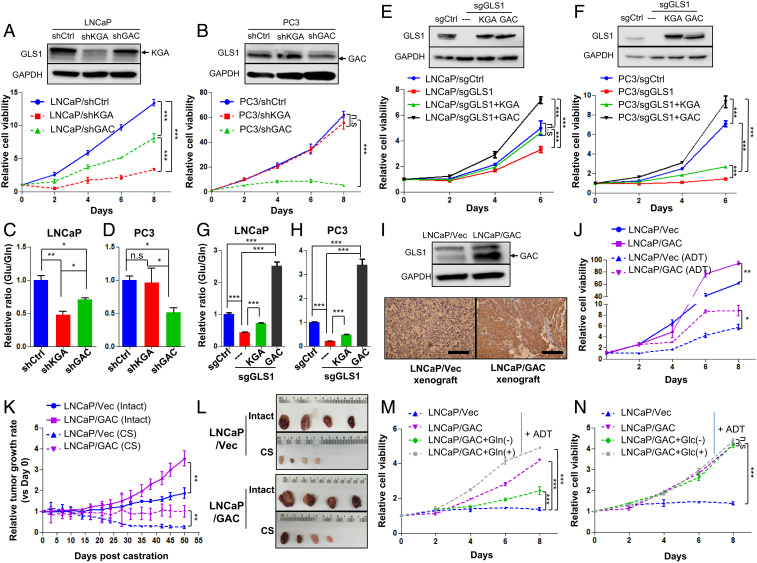
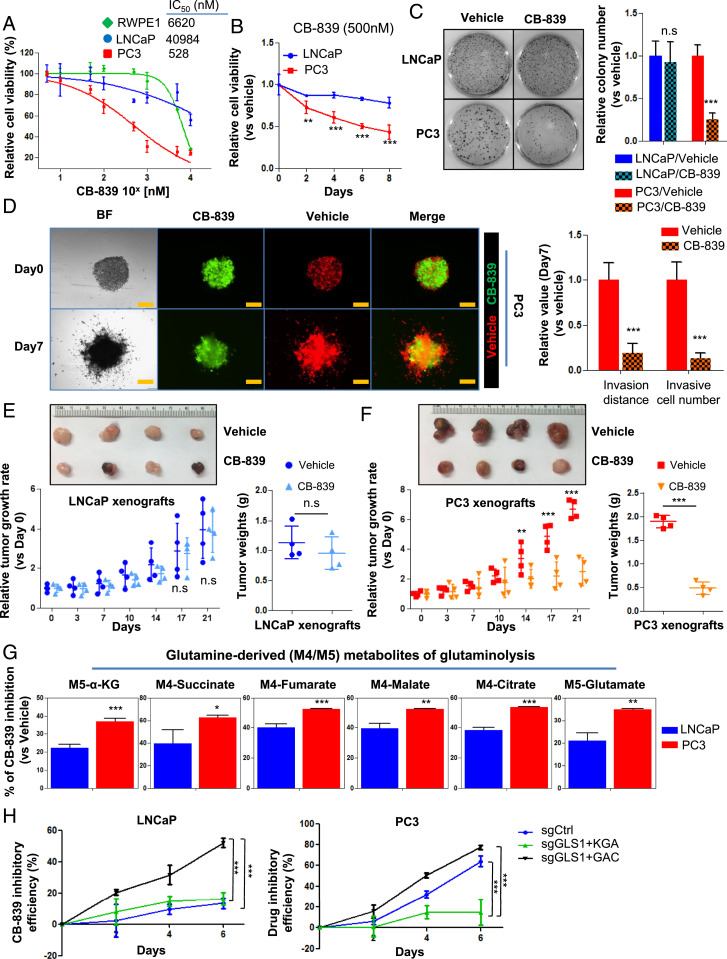
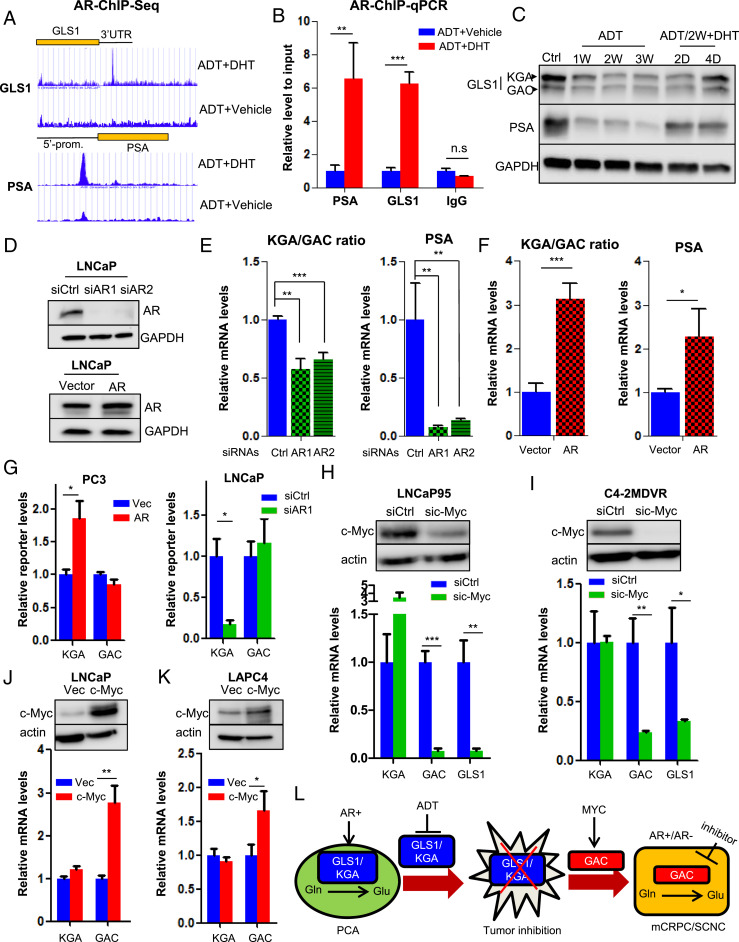
Cellular metabolism in cancer is significantly altered to support the uncontrolled tumor growth. How metabolic alterations contribute to hormonal therapy resistance and disease progression in prostate cancer (PCa) remains poorly understood. Here we report a glutaminase isoform switch mechanism that mediates the initial therapeutic effect but eventual failure of hormonal therapy of PCa. Androgen deprivation therapy inhibits the expression of kidney-type glutaminase (KGA), a splicing isoform of glutaminase 1 (GLS1) up-regulated by androgen receptor (AR), to achieve therapeutic effect by suppressing glutaminolysis. Eventually the tumor cells switch to the expression of glutaminase C (GAC), an androgen-independent GLS1 isoform with more potent enzymatic activity, under the androgen-deprived condition. This switch leads to increased glutamine utilization, hyperproliferation, and aggressive behavior of tumor cells. Pharmacological inhibition or RNA interference of GAC shows better treatment effect for castration-resistant PCa than for hormone-sensitive PCa in vitro and in vivo. In summary, we have identified a metabolic function of AR action in PCa and discovered that the GLS1 isoform switch is one of the key mechanisms in therapeutic resistance and disease progression.

Keywords: GAC; glutaminase; prostate cancer; therapeutic resistance.


Conflict of interest statement

Competing interest statement: J.H. is a consultant for or owns shares in the following companies: Kingmed, MoreHealth, OptraScan, Genetron, Omnitura, Vetonco, York Biotechnology, Genecode, and Sisu Pharma.

Figures

Fig. 1.
Fig. 1.
Androgen deprivation inhibits glutamine catabolism, and therapy-resistant PCa cells are more addicted to glutamine. (A) Heat map shows that ADT decreases levels of metabolites involved in important metabolism pathways (n = 3 and 5 replicates for the control and ADT groups, respectively). (B) Western blot shows that glutamine transporter ASCT2, similar to AR, is decreased after ADT. (C) UPLC-MS analysis of cell culture medium to compare glutamine consumption with or without ADT (n = 3 cultures per group). (D) Tracing of 13C-labeled glutamine influx and mass isotopomer analysis of [U–13C5] glutamine-derived metabolites in LNCaP cells with or without ADT. α-KG, α-ketoglutarate (n = 3 cultures per group). (E) Relative cell viability of LNCaP, PC3, C4-2, and C4-2MDVR cells cultured with or without glutamine (n = 3 replicates for two independent experiments). (F and G) Ultra performance liquid chromatography-mass spectrometry (UPLC-MS) analysis of glutamine uptake and intracellular glutamine levels in LNCaP and PC3 cells. Metabolites were extracted from culture medium and cell pellets at the indicated time points (n = 3 cultures per group). (H and I) GSEA of “GO_GLUTAMATE_PATHWAY” gene sets to compare SCNC and adenocarcinoma in Beltran 2016 (12) and GSE32967. ES, enrichment score; NES, normalized enrichment score. (J) Mass isotopomer analysis of TCA cycle metabolite abundance in LNCaP and PC3 cells (n = 3 cultures per group). M0 represents the non-Gln–derived (mainly glucose-derived) metabolite pool, whereas M5 and M4 represent the 13C-labled Gln-derived metabolite pool. Data are expressed as mean ± SD. *P < 0.05, **P < 0.01, and ***P < 0.001 by two-tailed Student’s t test. n.s., not significant.
Fig. 2.
Fig. 2.
Isoform switch of GLS1 during disease progression of PCa. (A) Gene structures of KGA and GAC isoforms of GLS1. (B) Western blot to determine KGA and GAC protein levels in RWPE1, LNCaP, PC3, C4-2, and C4-2MDVR cells with an anti-GLS1 antibody that recognizes both isoforms. (C) Recurrence-free survival of patients stratified by GAC mRNA expression in the TCGA dataset. Log-rank (Mantel–Cox) test. (D) Representative images of KGA and GAC IHC staining of tissue microarrays containing benign prostate tissue (Benign, n = 67), primary prostate adenocarcinoma (Adeno, n = 76), castration-resistant PCa (CRPC, n = 17), and small-cell neuroendocrine PCa (SCNC, n = 20). Black and red arrows denote benign and tumor compartments (KGA/Adeno). The Right panels are scores for KGA and GAC staining (staining intensity × the percentage of positive cells) by using the Quick-Score (Q-Score) system. P values were calculated using unpaired t test. Scale bars are shown as indicated. (E) Hematoxylin and eosin (H&E) staining and IHC analysis of KGA and GAC expression in mouse LNCaP xenograft tumors before castration (Intact) and in recurrent tumors after castration (CS) (n = 4). Upper panel shows the experimental procedure. (Scale bar, 40 µm.) Bottom Right panel shows a plot of Q-Score for KGA and GAC staining in each xenograft tumor group. (F) Western blot analysis of KGA and GAC protein levels in hormone-sensitive xenograft tumors (Intact) and castration-resistant xenograft tumor (CS) with GLS1 antibody. P values were calculated using two-tailed Student’s t test. *P < 0.05, **P < 0.01, and ***P < 0.001.
Fig. 3.
Fig. 3.
The GLS1 isoform switch confers castration resistance to PCa cells. (A and B) Western blots show KGA and GAC expression of LNCaP and PC3 cells transduced with KGA-specific, GAC-specific, or control shRNAs and the corresponding cell viability for each cell line (n = 3 replicates for two independent experiments). (C and D) Glutamine utilization indicated by the ratio of intracellular glutamate/glutamine of cells in A and B (n = 3 cultures per group). (E and F) Cell viability after knocking out GLS1 and introducing KGA and GAC back, respectively (n = 3 replicates for two independent experiments). (G and H) Enzymatic activity of KGA and GAC as measured by the ratio of intracellular glutamate/glutamine in cells described in E and F (n = 3 cultures per group). (I) Western blot and IHC staining of GAC overexpression in LNCaP cells and the corresponding xenograft tumor. (J) Cell viability of LNCaP cells overexpressing GAC and LNCaP/Vec control in regular medium or charcoal-stripped medium (ADT) (n = 3 replicates for two independent experiments). (K and L) Xenograft tumor growth curves with or without surgical castration (CS) and representative images of tumor size (n = 4 in each group). (M and N) Cell viability of LNCaP/Vec and LNCaP/GAC treated with glutamine (Gln)/glucose (Glc) depletion or supplemented glutamine/glucose in the charcoal-stripped medium (ADT) (n = 3 replicates for two independent experiments). Data are expressed as mean ± SD. *P < 0.05, **P < 0.01, and ***P < 0.001 by two-tailed Student’s t test. n.s., not significant.
Fig. 4.
Fig. 4.
GLS1 inhibitor CB-839 preferentially inhibits therapy-resistant PCa. (A) IC50 of CB-839 in RWPE1, LNCaP, and PC3 cells after 72 h of drug treatment (n = 3 replicates for two independent experiments). (B) Cell viability of LNCaP and PC3 cells treated with 500 nM CB-839 (n = 3 replicates for two independent experiments). (C) Colony formation of LNCaP and PC3 cells treated with CB-839 (500 nM) for 14 d (n = 3 replicates for two independent experiments). (D) Spheroid invasion assay showing the inhibitory effect of CB-839 on the migration of PC3 cells (n = 3 replicates for two independent experiments). Representative images (Left) and quantifications of relative cell invasion (Right) are shown. Cells labeled with RFP or GFP denote those cultured with vehicle or CB-839, respectively. (Scale bar, 200 µm.) (E and F) Representative images of tumor sizes (Top) and xenograft tumor growth curves (Bottom Left) and tumor weights (Bottom Right) with placebo or CB-839 oral administration (n = 4 in each group). (G) Mass isotopomer of 13C-glutanime–tracing analysis showing the inhibitory efficacy of CB-839 on glutaminolysis in LNCaP and PC3 cells (n = 3 cultures per group). (H) CB-839 inhibitory efficacy in LNCaP and PC3 cells expressing KGA only or GAC only in comparison to control single guide RNA (sgCtrl) (n = 3 replicates for two independent experiments). Data are depicted as mean ± SD. *P < 0.05, **P < 0.01, and ***P < 0.001 by two-tailed Student’s t test. n.s., not significant.
Fig. 5.
Fig. 5.
AR and MYC cooperatively regulate GLS1 isoform switch. (A) Identification of AR-binding sites in GLS1–3′UTR by ChIP sequencing. Prostate-Specific Antigen (PSA) is used as a positive control. (B) ChIP–qPCR showing AR binding to GLS1–3′UTR upon DHT stimulation. (C) Western blot showing KGA and GAC expression in LNCaP cells treated with ADT and followed by 10 nM DHT at the indicated time points. (D) Western blot showing AR expression in LNCaP cells transduced with siRNAs or complementary DNA (cDNA) plasmid expressing AR. (E and F) Transcript ratio of KGA/GAC in LNCaP cells after knockdown or overexpression of AR. (G) GLS1 minigene reporter was cotransfected with either AR cDNA plasmid in PC3 cells or AR-targeting siRNA in LNCaP cells. Transcript levels of isoforms were detected by qPCR by using KGA- and GAC-specific primer pairs. (H and I) Western blot showing knockdown of c-Myc by specific siRNA pool in LNCaP95 and C4-2MDVR cells (Top) and transcript levels of KGA, GAC, and GLS1 after c-Myc reduction (Bottom). (J and K) Western blot showing ectopic expression of c-Myc in LNCaP and LAPC4 cells (Top) and transcript levels of KGA, GAC, and GLS1 after c-Myc overexpression (Bottom). (L) A model depicting how GLS1 isoform switch drives castration resistance and disease progression in PCa. PCA, prostate adenocarcinoma; Glu, glutamate; Gln, glutamine; mCRPC, metastatic castration-resistant PCa; SCNC, small-cell neuroendocrine PCa. For each assay, n = 3 replicates were performed. Data are expressed as mean ± SD. *P < 0.05, **P < 0.01, and ***P < 0.001 by two-tailed Student’s t test. n.s., not significant.

Comment in

  • Uro-Science.
    Atala A. Atala A. J Urol. 2021 Nov;206(5):1319-1321. doi: 10.1097/JU.0000000000002153. Epub 2021 Aug 16. J Urol. 2021. PMID: 34392697 No abstract available.

References

    1. Antonarakis E. S., et al., AR-V7 and resistance to enzalutamide and abiraterone in prostate cancer. N. Engl. J. Med. 371, 1028–1038 (2014). - PMC - PubMed
    1. Barbieri C. E., Rubin M. A., Molecular characterization of prostate cancer following androgen deprivation: The devil in the details. Eur. Urol. 66, 40–41 (2014). - PubMed
    1. Chandrasekar T., Yang J. C., Gao A. C., Evans C. P., Mechanisms of resistance in castration-resistant prostate cancer (CRPC). Transl. Androl. Urol. 4, 365–380 (2015). - PMC - PubMed
    1. Watson P. A., Arora V. K., Sawyers C. L., Emerging mechanisms of resistance to androgen receptor inhibitors in prostate cancer. Nat. Rev. Cancer 15, 701–711 (2015). - PMC - PubMed
    1. Tran C., et al., Development of a second-generation antiandrogen for treatment of advanced prostate cancer. Science 324, 787–790 (2009). - PMC - PubMed

Publication types

MeSH terms