. 2021 Mar 30;118(13):e2021093118.
doi: 10.1073/pnas.2021093118.

Paxbp1 controls a key checkpoint for cell growth and survival during early activation of quiescent muscle satellite cells

Affiliations

Paxbp1 controls a key checkpoint for cell growth and survival during early activation of quiescent muscle satellite cells

Shaopu Zhou et al. Proc Natl Acad Sci U S A. .

Abstract

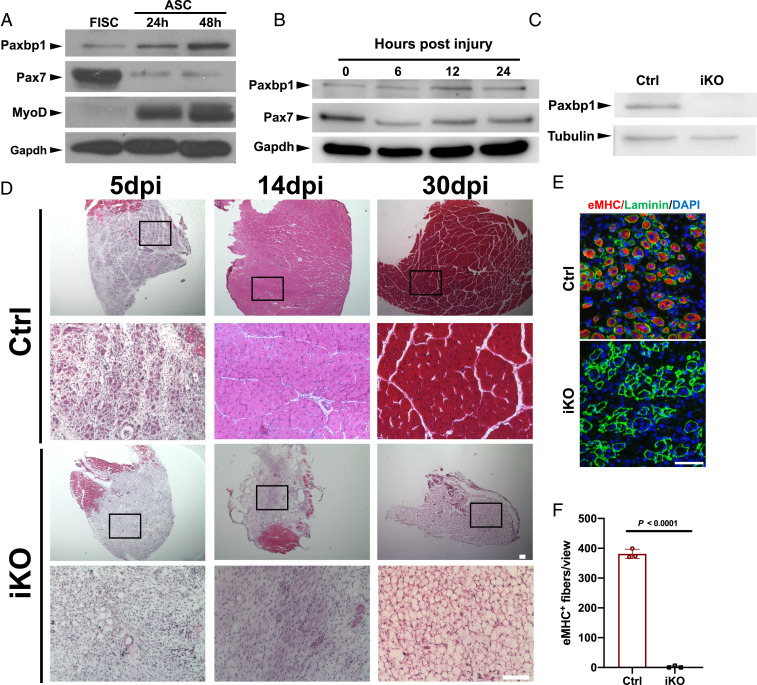
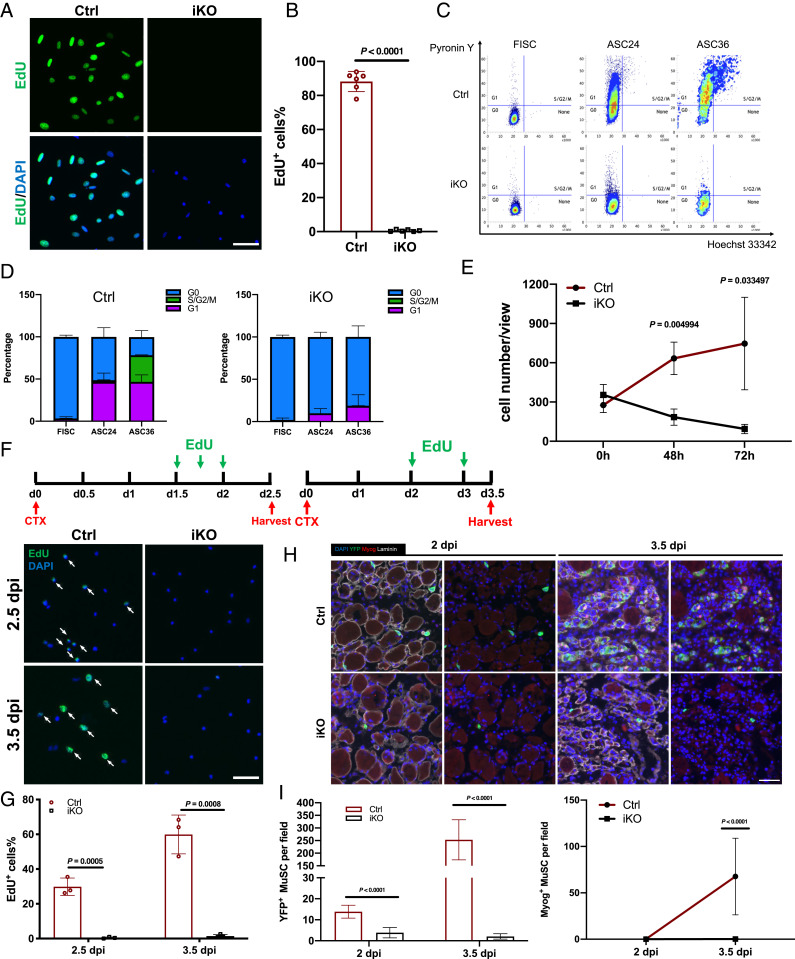
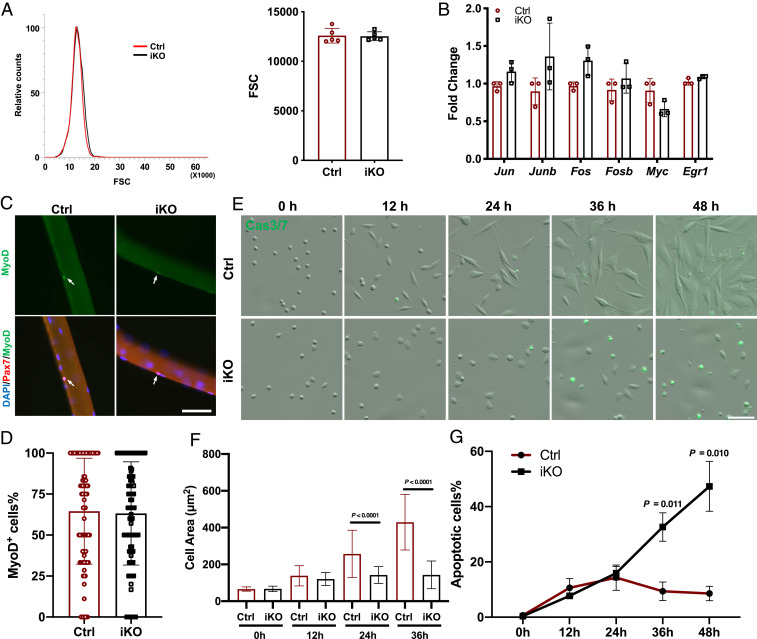
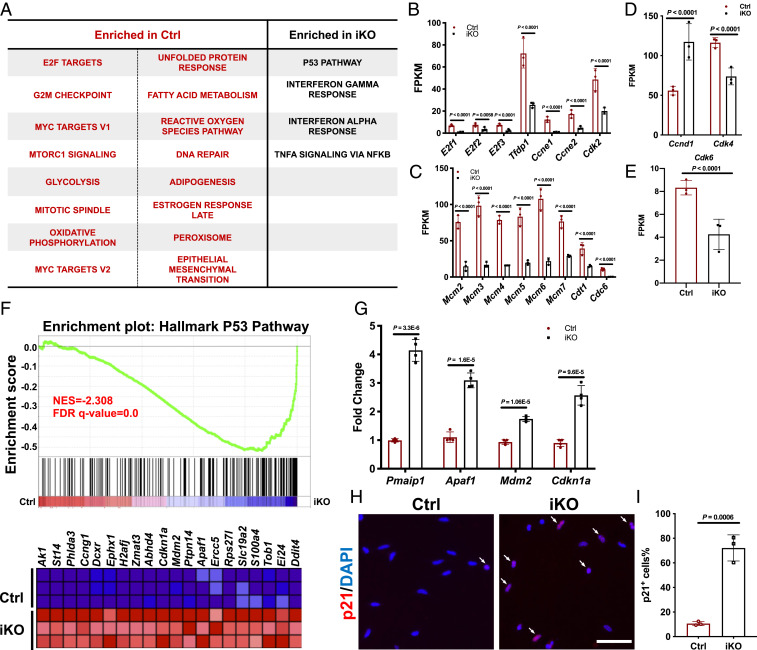
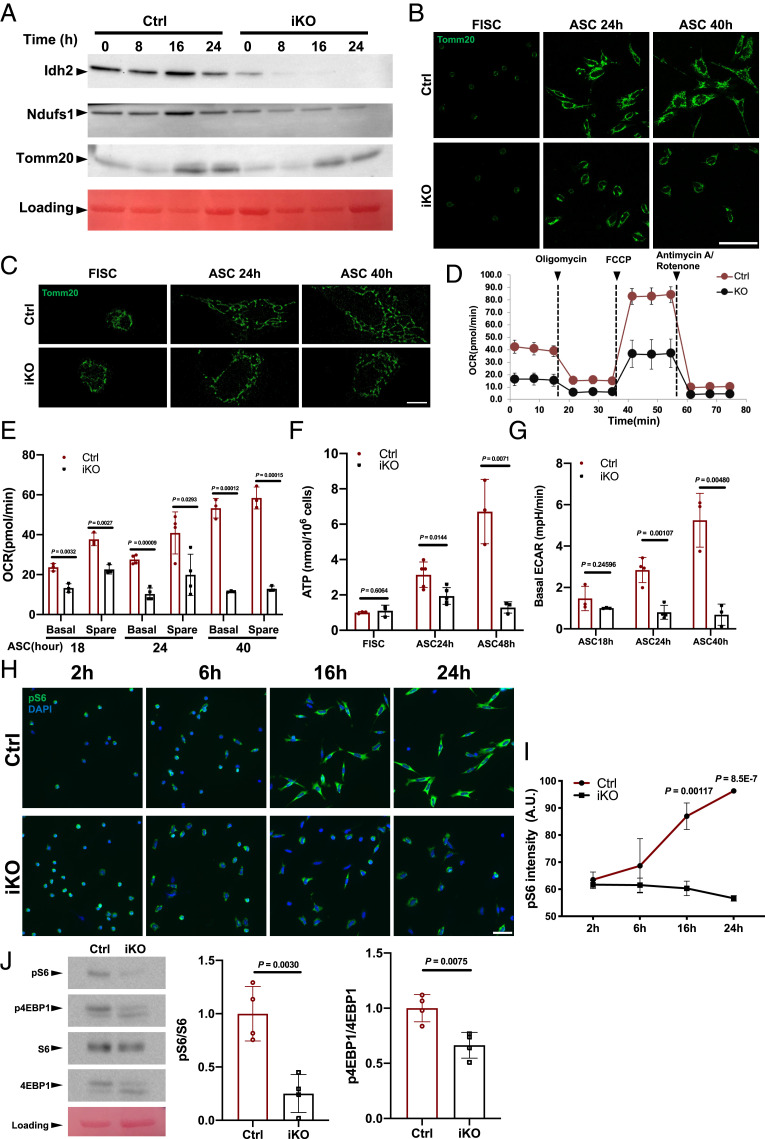
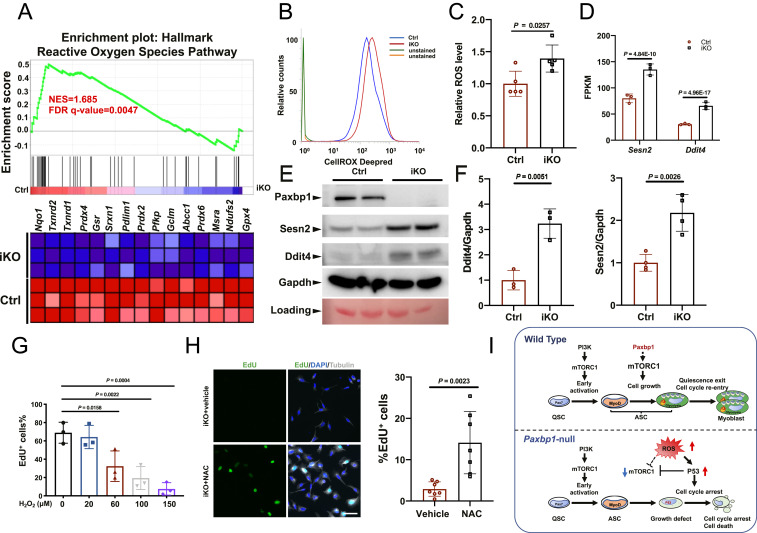
Adult mouse muscle satellite cells (MuSCs) are quiescent in uninjured muscles. Upon muscle injury, MuSCs exit quiescence, reenter the cell cycle to proliferate and self-renew, and then differentiate and fuse to drive muscle regeneration. However, it remains poorly understood how MuSCs transition from quiescence to the cycling state. Here, we report that Pax3 and Pax7 binding protein 1 (Paxbp1) controls a key checkpoint during this critical transition. Deletion of Paxbp1 in adult MuSCs prevented them from reentering the cell cycle upon injury, resulting in a total regeneration failure. Mechanistically, we found an abnormal elevation of reactive oxygen species (ROS) in Paxbp1-null MuSCs, which induced p53 activation and impaired mTORC1 signaling, leading to defective cell growth, apoptosis, and failure in S-phase reentry. Deliberate ROS reduction partially rescued the cell-cycle reentry defect in mutant MuSCs. Our study reveals that Paxbp1 regulates a late cell-growth checkpoint essential for quiescent MuSCs to reenter the cell cycle upon activation.

Keywords: Paxbp1; ROS; cell growth; muscle satellite cells; quiescence.


Conflict of interest statement

The authors declare no competing interest.

Figures

Fig. 1.
Fig. 1.
Paxbp1 was indispensable for muscle regeneration. (AC) The expression of various proteins was examined by Western blot using equal amounts of soluble whole-cell lysates from (A) FISCs and ASCs cultured for 24 and 48 h; (B) MuSCs directly isolated from wild-type mice that were either noninjured or injured for various times as indicated; and (C) FISCs from control (Ctrl) and Paxbp1-iKO mice. (D) Representative images of regenerating TA muscles stained by hematoxylin & eosin at 5, 14, and 30 dpi in Ctrl and Paxbp1-iKO mice. The second and fourth rows are enlarged views from the corresponding images in the first and third rows, respectively. (E) Immunostaining for embryonic MHC (red) and laminin (green) on TA muscle cross-sections at 5 dpi from Ctrl and iKO mice. (F) Quantification of eMHC+ myofibers in E (n = 3 mice per group). In E, nuclei were counterstained with DAPI (blue). Data are presented as mean ± SD. (Scale bars, 100 µm [D] and 50 µm [E].)
Fig. 2.
Fig. 2.
Paxbp1 critically controlled cell-cycle reentry of quiescent MuSCs. (A) FISCs from Ctrl and Paxbp1-iKO mice were cultured for 48 h in the presence of EdU (10 µM) before fixation followed by staining for EdU. (B) Quantification of the percentage of EdU+ SCs over total sorted SCs (n = 6 mice per group). (C) FISCs from Ctrl and iKO mice with or without additional culturing were subjected to cell-cycle analysis using Pyronin Y and Hoechst 33342 double staining. Representative flow cytometry plots are shown. (D) Quantification of the data in C (n = 3 mice per group). (E) Similar numbers of FISCs from Ctrl and iKO mice were cultured for up to 3 d and growth curves were plotted (n = 3 mice per group). (F, Top) Experimental schematics. (F, Bottom) YFP+ SCs were sorted by FACS and immediately stained for EdU. White arrows indicate EdU+ MuSCs. (G) Quantification of the percentage of EdU+ SCs over total YFP+ SCs in F (n = 3 mice per group for each time point). (H) TA muscle sections from Ctrl and iKO mice that were injured for 2 and 3.5 d were subjected to immunostaining for YFP, Myog, and laminin. (I) Enumeration of YFP+ and Myog+ cells per field of view in H (cells in five different fields of view from each mouse were counted; n = 3 mice per group). Nuclei were counterstained with DAPI. Data are presented as mean ± SD. (Scale bars, 50 µm.)
Fig. 3.
Fig. 3.
Loss of Paxbp1 impaired the cell growth of MuSCs without affecting the initial early activation. (A) Representative forward scatter (FSC) distribution of FISCs from a Ctrl and an iKO mouse (Left) and quantification of the mean FSC for two types of FISCs (Right) (n = 5 mice per group). (B) Measurement of relative mRNA expression of selected IEGs by qRT-PCR using FISCs from Ctrl and iKO mice (n = 3 mice per group). (C) Freshly isolated myofibers from Ctrl and iKO mice were cultured for 8 h before fixation followed by immunostaining for MyoD and Pax7. White arrows indicate ASCs on myofibers. (D) Quantification of the percentage of MyoD+ ASCs over Pax7+ ASCs in C; ∼90 fibers from n = 3 mice per group were used for quantification. (E) Live-cell imaging was conducted on FISCs from control and iKO mice grown in culture together with CellEvent Caspase-3/7 Green Detection Reagent for 72 h. Representative snapshots at the indicated time points are presented. (F) Quantification of the mean cell size in E by Fiji (ImageJ): At each time point, >100 cells from n = 3 mice per group were measured. (G) Quantification of the percentage of Caspase3/7-positive cells in E (n = 3 mice per group). Data are presented as mean ± SD. (Scale bars, 50 µm.)
Fig. 4.
Fig. 4.
RNA-seq revealed dysregulated cell cycle-related genes and p53 target genes in Paxbp1-null ASCs. (A) Enriched terms (false discovery rate [FDR] < 0.05) in ASCs from Ctrl and iKO mice by GSEA using the Hallmark database are shown. (BE) Based on RNA-seq data, the mean FPKM values of selected genes involved in G1/S transition (B, D, and E) and replication origin licensing (C) are shown (n = 3 mice per group). (F) GSEA plot showing many p53 target genes were up-regulated in Paxbp1-null ASCs. NES, normalized enrichment score. (G) The increased mRNA expression of selected p53 target genes in Paxbp1-null ASCs was validated by qRT-PCR using FACS-isolated ASCs 24 h postinjury (n = 4 mice per group). (H) p21 protein expression was examined in ASCs after 24 h in culture by immunostaining. White arrows indicate p21+ ASCs. (I) Quantification of the percentage of p21+ ASCs over total ASCs in H (n = 3 mice per group). Data are presented as mean ± SD. (Scale bar, 50 µm.)
Fig. 5.
Fig. 5.
Sharp increase in Paxbp1-dependent mTORC1 activity correlated with enhanced mitochondrial biogenesis and anabolic metabolism. (A) FISCs from Ctrl and iKO mice were cultured for various times as indicated. Cells were then collected and subjected to Western blot for the indicated mitochondrial proteins. Idh2, isocitrate dehydrogenase 2; Ndufs1, NADH-ubiquinone oxidoreductase Fe-S protein 1. (B and C) Representative confocal (B) and superresolution (C) microscopic images of Tomm20 immunostaining using FISCs and ASCs that were cultured for various times as indicated. (D) Representative OCR measured by Seahorse Mito Stress assays for ASCs after 24 h in culture. (E) Quantification of OCR for ASCs after 18, 24, and 40 h in culture (n = 3 mice per group for samples at 18 and 40 h; n = 4 mice per group for samples at 24 h). (F) Cellular ATP levels were measured in FISCs and ASCs that were cultured for 24 and 48 h (n = 3 mice per group for FISCs and samples at 48 h; n = 5 mice per group for samples at 24 h). (G) Quantification of ECAR for ASCs that were cultured for 18, 24, and 40 h (n = 3 mice per group for samples at 18 and 40 h; n = 4 mice per group for samples at 24 h). mpH/min, milli-pH/minute. (H) FISCs from Ctrl and iKO mice were cultured for the indicated times followed by immunostaining for pS6 (green). Nuclei were counterstained with DAPI (blue). (I) Quantification of the intensity of pS6 by Fiji (ImageJ) in H (n = 3 mice per group for each time point). A.U., arbitrary unit. (J) Representative Western blot (n = 4 mice per group) showing the levels of total protein and the phosphorylated forms for S6 and 4EBP1 in ASCs after 24 h in culture. Quantification data by densitometry are presented (Right). Data are presented as mean ± SD. (Scale bars, 50 µm [B and H] and 5 µm [C].)
Fig. 6.
Fig. 6.
Paxbp1-dependent redox regulation influenced the mTORC1 and p53 signaling and cell-cycle reentry of QSCs. (A) GSEA plot showing the defective ROS pathway in Paxbp1-null ASCs. (B) A representative flow cytometry plot showing increased ROS levels in Paxbp1-null ASCs directly isolated from Ctrl and iKO mice at 1 dpi. (C) Quantification of relative ROS levels in B (n = 5 mice per group). (D) Mean FPKM values for Sesn2 and Ddit4 based on our RNA-seq data. (E) A representative Western blot showing the protein levels of Sesn2 and Ddit4 in ASCs after 24 h in culture. (F) Quantification of data in E by densitometry (n ≥ 3). (G) FISCs from wild-type adult mice were cultured for 40 h with EdU in the absence or presence of different doses of H2O2 before fixation followed by staining for EdU. The percentage of EdU+ ASCs over total ASCs is shown (n = 3 independent experiments). (H) FISCs from iKO mice were cultured in the presence of EdU with or without NAC (5 mM) for 60 h before fixation followed by staining for EdU and tubulin. Quantification of the percentage of EdU+ ASCs over total ASCs (n = 7 independent experiments) is also shown. (I) Schematic diagrams summarizing key findings from our work. Data are presented as mean ± SD. (Scale bar, 50 µm.)

Similar articles

Cited by

References

    1. Chapman N. M., Boothby M. R., Chi H., Metabolic coordination of T cell quiescence and activation. Nat. Rev. Immunol. 20, 55–70 (2020). - PubMed
    1. Gonzales K. A. U., Fuchs E., Skin and its regenerative powers: An alliance between stem cells and their niche. Dev. Cell 43, 387–401 (2017). - PMC - PubMed
    1. Li L., Clevers H., Coexistence of quiescent and active adult stem cells in mammals. Science 327, 542–545 (2010). - PMC - PubMed
    1. Urbán N., Blomfield I. M., Guillemot F., Quiescence of adult mammalian neural stem cells: A highly regulated rest. Neuron 104, 834–848 (2019). - PubMed
    1. van Velthoven C. T. J., Rando T. A., Stem cell quiescence: Dynamism, restraint, and cellular idling. Cell Stem Cell 24, 213–225 (2019). - PMC - PubMed

Publication types

Substances