. 2021 Mar 30;118(13):e2021385118.
doi: 10.1073/pnas.2021385118.

Mitochondrial metabolism is essential for invariant natural killer T cell development and function

Affiliations

Mitochondrial metabolism is essential for invariant natural killer T cell development and function

Xiufang Weng et al. Proc Natl Acad Sci U S A. .

Abstract

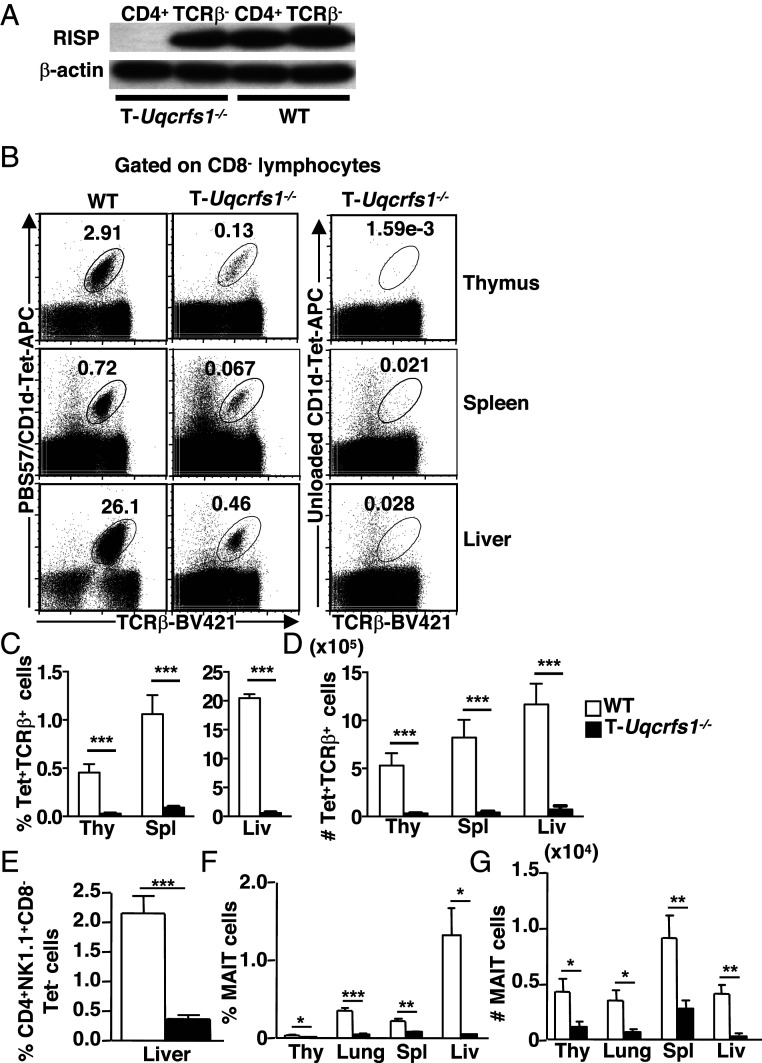
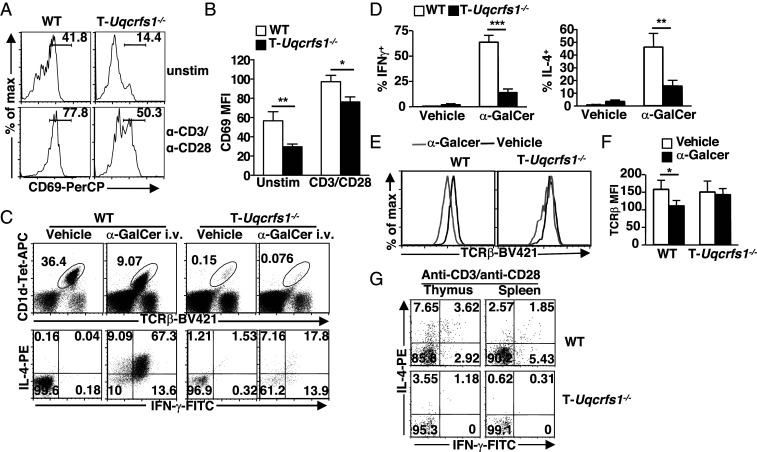
Conventional T cell fate and function are determined by coordination between cellular signaling and mitochondrial metabolism. Invariant natural killer T (iNKT) cells are an important subset of "innate-like" T cells that exist in a preactivated effector state, and their dependence on mitochondrial metabolism has not been previously defined genetically or in vivo. Here, we show that mature iNKT cells have reduced mitochondrial respiratory reserve and iNKT cell development was highly sensitive to perturbation of mitochondrial function. Mice with T cell-specific ablation of Rieske iron-sulfur protein (RISP; T-Uqcrfs1-/- ), an essential subunit of mitochondrial complex III, had a dramatic reduction of iNKT cells in the thymus and periphery, but no significant perturbation on the development of conventional T cells. The impaired development observed in T-Uqcrfs1-/- mice stems from a cell-autonomous defect in iNKT cells, resulting in a differentiation block at the early stages of iNKT cell development. Residual iNKT cells in T-Uqcrfs1-/- mice displayed increased apoptosis but retained the ability to proliferate in vivo, suggesting that their bioenergetic and biosynthetic demands were not compromised. However, they exhibited reduced expression of activation markers, decreased T cell receptor (TCR) signaling and impaired responses to TCR and interleukin-15 stimulation. Furthermore, knocking down RISP in mature iNKT cells diminished their cytokine production, correlating with reduced NFATc2 activity. Collectively, our data provide evidence for a critical role of mitochondrial metabolism in iNKT cell development and activation outside of its traditional role in supporting cellular bioenergetic demands.

Keywords: CD1; NKT cells; T cell development; knockout mice; mitochondrial metabolism.


Conflict of interest statement

The authors declare no competing interest.

Figures

Fig. 1.
Fig. 1.
iNKT cells exhibit distinct metabolic profile. (AC) OCR of purified iNKT cells and CD4+ T cells from the spleen and liver were measured under basal conditions and in response to oligomycin (oligo), FCCP, and rotenone plus antimycin A (Rot/AM). Real-time OCR levels (A and B) and SRC (percent maximum OCR after FCCP injection of baseline OCR) (C) of indicated cells are presented as mean + SEM (n = 3 to 6). (D) FAO of splenic iNKT and CD4+ T cells was detected by measuring the OCR level in response to substrate palmitate-BSA (Pal-BSA) and inhibitor etomoxir (Eto). (E) FAO of indicated cells was calculated as increase in OCR in response to palmitate-BSA and shown as mean + SEM (n = 6 for spleen and n = 3 for liver). (F) Cells from indicated organs of B6 mice were stained with CD1d/PBS57 tetramer and mAb against TCR-β, CD4, and CD8 followed by incubation with MitoTracker Green (MTG) or TMRE. Data are representative from seven experiments. (G) Relative mtDNA was quantifying the ratio of mitochondrial cytochrome C oxidase subunit 1 (MitoCO1) or NADH dehydrogenase (MitoND1) to nuclear DNA in iNKT cells and normalized to CD4+ T cells (n = 3). Data are shown as mean + SEM from three experiments. *P < 0.05, **P < 0.01, and ***P < 0.001.
Fig. 2.
Fig. 2.
Disruption of mitochondrial metabolism affects iNKT cells development. Thymic lobes from 1-d-old B6 neonates were cultured in the presence of indicated doses of FCCP for 8 d. CD1d/PBS57 tetramer stained iNKT cells, CD4sp and CD8sp cells were detected by flow cytometry. (A) Representative dot plots from three independent experiments. (B) Bar graphs depict mean + SEM of percentages (Left) and total numbers (Right) of iNKT cells (n = 5). (C) Bar graphs depict mean + SEM of absolute numbers of CD4sp (Left) and CD8sp (Right) cells. *P < 0.05, **P < 0.01, and ***P < 0.001.
Fig. 3.
Fig. 3.
RISP-deficiency affects the development of iNKT cells, type II NKT cells, and MAIT cells. (A) Immunoblot of RISP protein in purified TCR-β+CD4+ and TCR-β splenocytes from T-Uqcrfs1−/− and WT mice (n = 2). (BD) Lymphocytes were stained with CD1d/PBS57 tetramer or unloaded CD1d tetramer and mAb against TCR-β, CD4, and CD8. CD8 cells were gated for flow cytometry analysis (B). Bar graphs depict mean + SEM of percentage (C) and number (D) of iNKT cells in indicated organs (n = 10). (E) Bar graph depicts mean + SEM of percentage of type II NKT cells in liver lymphocytes (n = 5). (F and G) Lymphocytes from indicated organs and mice were stained with anti–TCR-β and MR1/5OP-RU tetramer. Bar graph depicts mean + SEM of percentage (F) and number (G) of MAIT cells in indicated organs (n = 5). ***P < 0.001; **P < 0.01; *P < 0.05.
Fig. 4.
Fig. 4.
Defective development of iNKT cells in T-Uqcrfs1−/− mice is cell intrinsic. (A) Cells were stained with anti-CD1d (filled histograms) or isotype control (open histograms). Representative histograms of CD1d expression on DP thymocytes and on splenic leukocyte subsets from three independent experiments. (B) IL-2 production by iNKT cell hybridomas cocultured with thymocytes in the absence or presence of α-GalCer, data shown as mean + SEM, figure generated from two experiments. (C and D) Lymphocytes from indicated organs of mixed BM chimeras were stained with CD1d/PBS57 tetramer and anti-CD45.1 for FACS analysis. (C) Numbers in each quadrant of representative dot plots show the percentage of tetramer+CD45.1+ iNKT cells in the indicated organs from two experiments. (D) Bar graph depicts the mean + SEM for the proportion of iNKT cells (n = 6). **P < 0.01; n.s., not significant.
Fig. 5.
Fig. 5.
Mitochondrial complex III deficiency impairs proper iNKT cell maturation. (A) Relative Vα14Jα18 expression in DP and total thymocytes from indicated mice. Data are representative of three experiments. (B and C) Thymocytes were stained with CD1d/PBS57 tetramer and mAb against TCR-β, CD24, CD44, and NK1.1. (B) Dot plots depict the gating strategy for iNKT cell developmental stages. (C) Bar graphs depict mean + SEM for the proportions and absolute numbers of iNKT stages (n = 6). (DF) Thymocytes were stained with CD1d/PBS57 tetramer and mAb to TCR-β and CCR7 followed by intracellular staining with PLZF, T-bet, and RORγt (n = 6). (D) Dot plots depict the gating strategy for NKT1, NKT17, NKT2+preNKT (NKT2+Pre) subsets. (E) Bar graphs depict the for the percentages (Upper) and absolute numbers (Lower) of different NKT cell subsets. (F) The percentage of CCR7+ cells (mean + SEM) among PLZFhi iNKT cells. (G and H) Proportion of BrdU+ iNKT cells (mean + SEM) in indicated organs (G) and at different stages of iNKT maturation in thymus (n = 6). (I and J) Proportions of Annexin V+ iNKT cells (mean + SEM) in indicated organ (I) and at different stages of iNKT maturation in thymus (J) (n = 6). *P < 0.05, **P < 0.01, and ***P < 0.001.
Fig. 6.
Fig. 6.
T-Uqcrfs1−/− iNKT cells have impaired TCR signaling and altered responsiveness to IL-15. (A) Expression of Nur77 in CD4sp, CD8sp, and DP thymocytes. (B) Bar graphs depict mean + SEM of Nur77 mean fluorescence intensity (MFI) (n = 6). (C) Representative recordings of Ca2+ flux in WT and T-Uqcrfs1−/− DP thymocytes measured before and after anti-CD3/anti-CD4 cross-linking in Ca2+ free DPBS, and after addition of 2 mM Ca2+ in DPBS. (D and E) Peak of calcium flux (ratios of Fluo 4/Flura red) after anti-CD3 cross-linking (D) and Ca2+ addition (E) (n = 5). (F) Expression of T-bet in thymic iNKT cells. (G) Bar graphs depict mean + SEM of T-bet MFI (n = 6). (H) Representative histograms show CD122 expression on thymic iNKT cells. (I) Bar graphs depict mean + SEM of CD122 MFI (n = 7). (J and K) Thymocytes were incubated in the presence or absence of IL-15. Surface staining with CD1d/PBS57 tetramer and anti–TCR-β were performed, followed by intracellular staining for pSTAT5. (J) Representative histograms show pSTAT5 level in iNKT cells. (K) Bar graphs depict mean + SEM of pSTAT5 MFI (n = 5). Data are representative of three experiments. *P < 0.05, **P < 0. 01, and ***P < 0.001.
Fig. 7.
Fig. 7.
T-Uqcrfs1−/− iNKT cells have impaired activation and responsiveness to stimulation. (A) CD69 expression on iNKT cells ex vivo or upon anti-CD3/anti-CD28 stimulation. (B) Bar graphs depict mean + SEM of CD69 MFI (n = 5). (CF) WT and T-Uqcrfs1−/− mice were injected intravenously with α-GalCer. Hepatic lymphocytes were harvested 1 h postinjection followed by flow cytometry analysis. (C) Represntative dot plots depict the percentages of iNKT cells (Upper) and IL-4– and IFN-γ–producing cells in iNKT cells. (D) Bar graphs show mean + SEM of IFN-γ+ and IL-4+ iNKT cells (n = 6). (E) Surface TCR-β expression on iNKT cells in α-GalCer (gray) and vehicle-injected mice (black). (F) Bar graphs depict mean + SEM of MFI of TCR-β (n = 6). (G) Dot plots show percentages of IL-4– and IFN-γ–producing cells in iNKT cells upon in vitro stimulation with anti-CD3/anti-CD28. Results shown are representative of three experiments. *P < 0.05, **P < 0.01, and ***P < 0.001.
Fig. 8.
Fig. 8.
Knockdown of Uqcrfs1 in mature iNKT cells results in impaired TCR-induced cytokine production. (AE) Splenocytes from Vα14Tg mice were transfected with siNC and siUqcrfs1. After 3 d in culture, cells were stimulated with anti-CD3 for intracellular cytokine staining. (A) Knockdown efficiency of Uqcrfs1 was measured by qRT-PCR. (B and C) Percentage (B) and cell number (C) of iNKT cells and CD4+ T cells in siNC and siUqcrfs1-treated groups. (D and E) Bar graphs depict percentage of IFN-γ–producing iNKT cells and CD4+ T cells after anti-CD3 stimulation. (n = 3). (n.s., not significant. *P < 0.05 and **P < 0.01). (FK) NKT cell hybridoma DN32.D3 cells were transduced with lentivirus encoding Uqcrfs1-targeting or NC shRNA. (F) Knockdown efficiency of Uqcrfs1 was confirmed by Western blot. (G) shUqcrfs1 and shNC-expressing DN32.D3 cells were stimulated with anti-CD3/anti-CD28 or α-GalCer for 48 h and IL-2 production was quantified by ELISA. (**P < 0.01). (H) Representative recordings of Ca2+ flux in shUqcrfs1 and shNC-expressing DN32.D3 cells. (I) Calcium flux of indicated cells after α-GalCer stimulation (n = 3). (J) Nuclear (N) and cytoplasmic (C) extracts were prepared from shNC and shUqcrfs1-expressing cells after stimulation with α-GalCer at the indicated time points and were immunoblotted for basal level and nuclear translocation of NFATc2. α-Tubulin and HDAC1 were served as loading control. (K) Bar graph of NFATc2 nuclear/cytoplasm ratio was normalized by the corresponding cells at 0 h. Data are representative of three experiments.

Similar articles

Cited by

References

    1. Geiger R., et al. ., L-arginine modulates T cell metabolism and enhances survival and anti-tumor activity. Cell 167, 829–842.e13 (2016). - PMC - PubMed
    1. Blagih J., et al. ., The energy sensor AMPK regulates T cell metabolic adaptation and effector responses in vivo. Immunity 42, 41–54 (2015). - PubMed
    1. Chang C. H., et al. ., Posttranscriptional control of T cell effector function by aerobic glycolysis. Cell 153, 1239–1251 (2013). - PMC - PubMed
    1. Pearce E. L., Pearce E. J., Metabolic pathways in immune cell activation and quiescence. Immunity 38, 633–643 (2013). - PMC - PubMed
    1. Sena L. A., et al. ., Mitochondria are required for antigen-specific T cell activation through reactive oxygen species signaling. Immunity 38, 225–236 (2013). - PMC - PubMed

Publication types