. 2021 Mar 30;118(13):e2023348118.
doi: 10.1073/pnas.2023348118.

The number of catalytic cycles in an enzyme's lifetime and why it matters to metabolic engineering

Affiliations

The number of catalytic cycles in an enzyme's lifetime and why it matters to metabolic engineering

Andrew D Hanson et al. Proc Natl Acad Sci U S A. .

Abstract

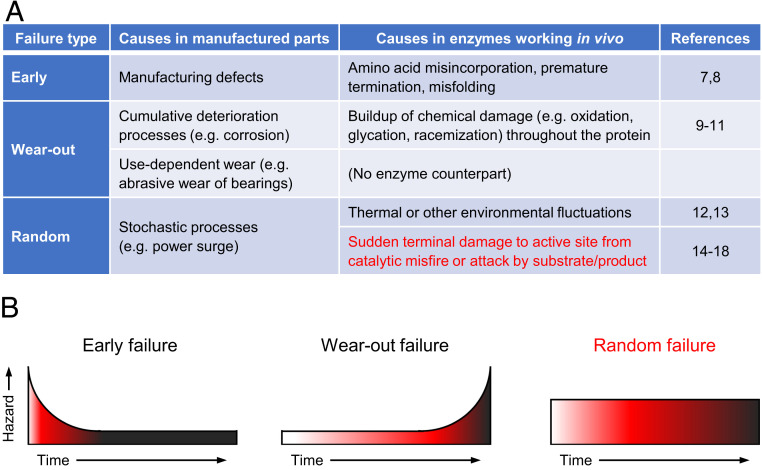
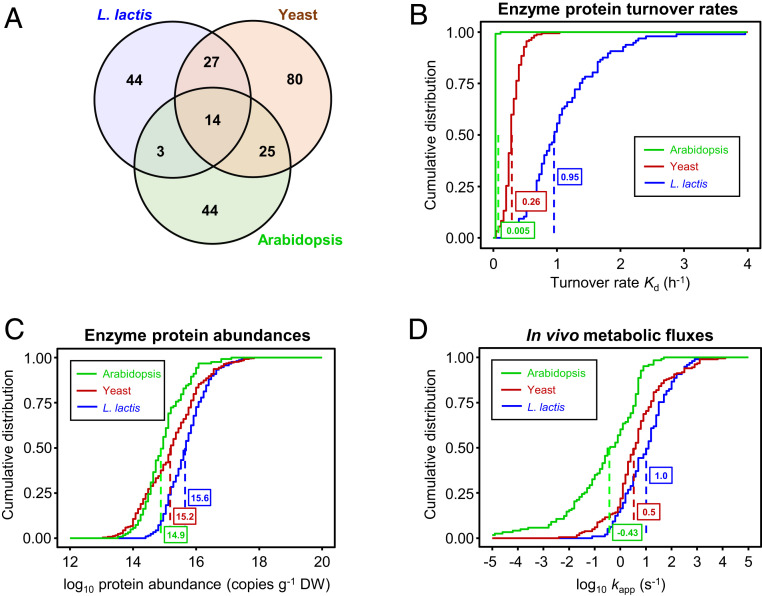
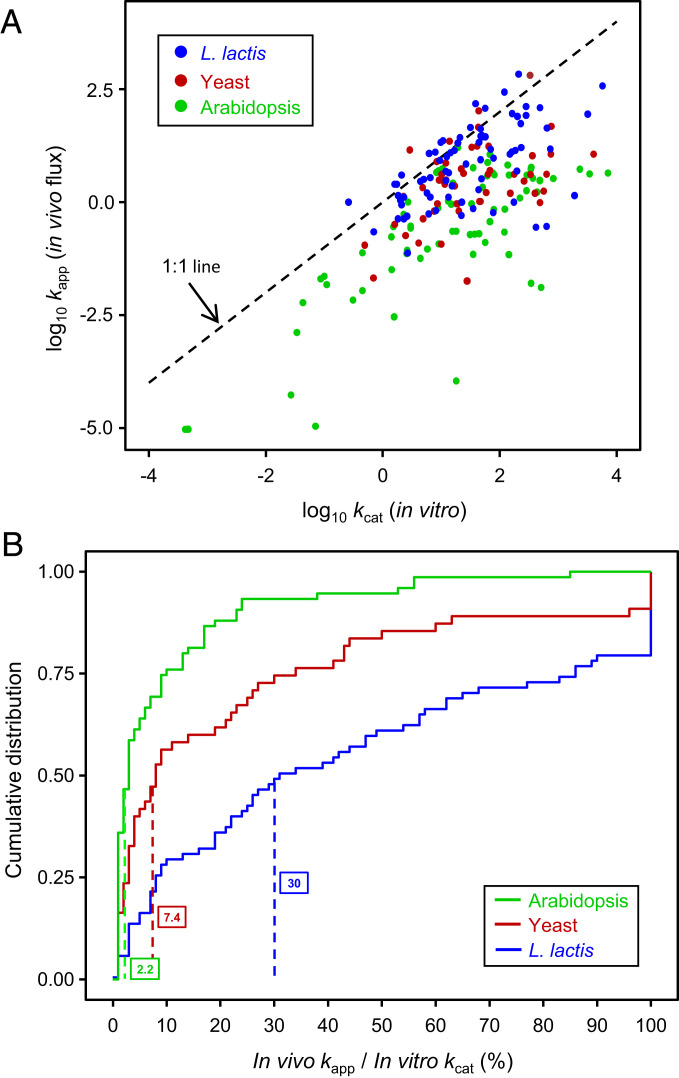
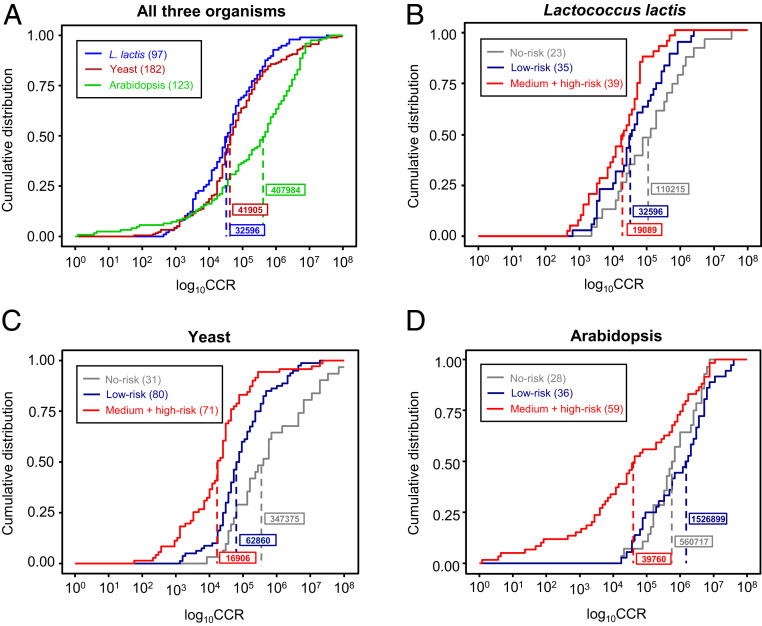
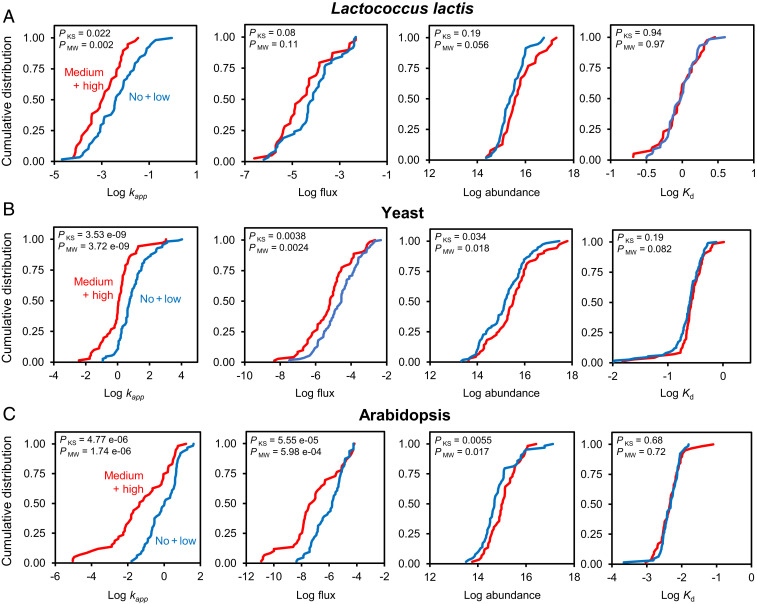
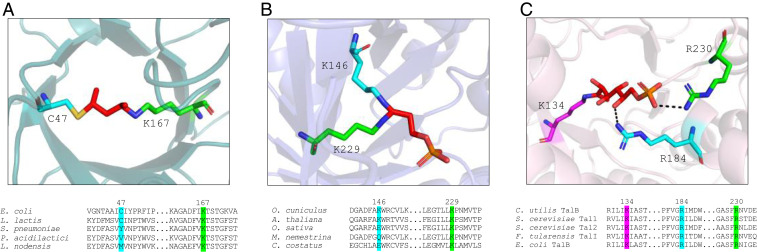
Metabolic engineering uses enzymes as parts to build biosystems for specified tasks. Although a part's working life and failure modes are key engineering performance indicators, this is not yet so in metabolic engineering because it is not known how long enzymes remain functional in vivo or whether cumulative deterioration (wear-out), sudden random failure, or other causes drive replacement. Consequently, enzymes cannot be engineered to extend life and cut the high energy costs of replacement. Guided by catalyst engineering, we adopted catalytic cycles until replacement (CCR) as a metric for enzyme functional life span in vivo. CCR is the number of catalytic cycles that an enzyme mediates in vivo before failure or replacement, i.e., metabolic flux rate/protein turnover rate. We used estimated fluxes and measured protein turnover rates to calculate CCRs for ∼100-200 enzymes each from Lactococcus lactis, yeast, and Arabidopsis CCRs in these organisms had similar ranges (<103 to >107) but different median values (3-4 × 10⁴ in L. lactis and yeast versus 4 × 10⁵ in Arabidopsis). In all organisms, enzymes whose substrates, products, or mechanisms can attack reactive amino acid residues had significantly lower median CCR values than other enzymes. Taken with literature on mechanism-based inactivation, the latter finding supports the proposal that 1) random active-site damage by reaction chemistry is an important cause of enzyme failure, and 2) reactive noncatalytic residues in the active-site region are likely contributors to damage susceptibility. Enzyme engineering to raise CCRs and lower replacement costs may thus be both beneficial and feasible.

Keywords: catalytic cycles; energetic costs; enzyme longevity; protein turnover; synthetic biology.


Conflict of interest statement

The authors declare no competing interest.

Figures

Fig. 1.
Fig. 1.
The engineering concept of component failure and its application to enzymes in vivo. (A) The types of failure in manufactured components and their counterparts in enzymes operating in vivo. (B) Schematic representation of the time dependence of the hazard rate and the cumulative probability (increasing color density) that an individual component will have failed.
Fig. 2.
Fig. 2.
Summary of primary data from which CCR values for 97 L. lactis, 182 yeast, and 123 Arabidopsis enzymes were calculated. (A) Venn diagram showing how many enzymes having the same EC number are shared between the datasets. There are fewer EC numbers than enzymes in each dataset because each organism had several enzymes (isoforms) with the same EC number. (BD) Cumulative distribution plots of enzyme protein turnover rates (per hour) (B), log10 enzyme protein abundances (copies per gram dry weight) (C), and log10 kapp, the estimated net in vivo metabolic flux for each enzyme (moles substrate processed per mole enzyme per second) (D). Median values are boxed.
Fig. 3.
Fig. 3.
Relationships between estimated kapp values (in vivo fluxes) and published kcat values for 76 enzymes from L. lactis or other bacteria, 55 from yeast or other fungi, and 75 from Arabidopsis or other plants. (A) Scatter plot (log10 scale) of kapp vs. kcat for the enzymes from each organism. Note that most points fall below the 1:1 line. Linear regression analysis indicated that an “average” enzyme (kcat ∼ 10 s−1) operates in vivo at 38% of maximum velocity in L. lactis, at 12% in yeast, and at 1.8% in Arabidopsis. (B) Cumulative distribution plots of the kapp/kcat ratio (expressed as a percentage) for the enzymes from each organism. Values >100% were scored as 100%. Median values are boxed and marked by vertical dashed lines.
Fig. 4.
Fig. 4.
Distributions of CCR values for L. lactis, yeast, and Arabidopsis enzymes and their relationship to the chemistry of the reaction catalyzed. (A) Distribution of CCR values for each organism. The Arabidopsis distribution is significantly different from those of L. lactis and yeast with P values of <10−6 (Kolmogorov–Smirnov test) and <10−4 (Mann–Whitney U test). (BD) Distributions of CCR values for enzymes in each organism scored as being at no, low, and medium or high risk of damage from the reaction catalyzed. In each organism, the distributions of medium- plus high-risk and no-risk enzymes are significantly different with values of P < 0.005, and the distributions of medium- plus high-risk and pooled no-risk plus low-risk enzymes are significantly different with values of P < 0.01 (Kolmogorov–Smirnov test and Mann–Whitney U test). Numbers of enzymes are in parentheses. Median values are boxed and marked by dashed lines.
Fig. 5.
Fig. 5.
Relationships between enzyme risk class and each of the variables on which CCR values depend. Cumulative distributions (log scale) are plotted for L. lactis (A), yeast (B), and Arabidopsis (C) enzymes assigned to the medium- plus high-risk class (red lines) or to the pooled no-risk plus low-risk class (blue lines). The kapp units are per second. Flux units are millimoles per second per gram dry weight, enzyme abundances are molecules per gram dry weight, and Kd values are per hour. P values for Kolmogorov–Smirnov (KS) and Mann–Whitney U (MW) tests for significant differences between the distributions are shown in each frame.
Fig. 6.
Fig. 6.
Damage mechanisms of high-risk, low-CCR enzymes vulnerable to catalysis-related inactivation. Images show the active-site region with the inactivating structure and alignments show the extent of sequence conservation in this region. Residues are numbered according to the top species in each alignment. Carbon skeletons of inactivating structures are colored red, and carbon skeletons of residues are colored as in the alignments below. (A) L. lactis DeoC homology model generated using E. coli DeoC crystallized in inactivated form with K167 and C47 linked via an acetaldehyde derivative (Protein Data Bank [PDB]: 5EL1). (B) Arabidopsis FBA3 homology model generated using rabbit muscle FBA (PDB: 1ZAI); the inactivating cross-linked dihydroxyacetone phosphate molecule was added manually using PyMOL. (C) Yeast TAL1 homology model generated using Francisella tularensis TalA with bound sedoheptulose-7-phosphate (PDB: 3TNO); black dashes mark substrate atoms within 3 Å of the active-site arginines. Homology models and images were generated using SWISS-MODEL and PyMOL 2.3.5. Residue conservation was determined by BLASTp against the National Center for Biotechnology Information nonredundant sequence database. Query and structural template sequences were aligned with orthologs using ClustalO. TAL R184 and R230 are strictly conserved. Species names: Streptococcus pneumoniae, Pediococcus acidilactici, Lactobacillus nodensis, Oryctolagus cuniculus, Oryza sativa, Macaca nemestrina, Cyphomyrmex costatus, and Candida utilis.

Similar articles

Cited by

References

    1. Church G. M., Elowitz M. B., Smolke C. D., Voigt C. A., Weiss R., Realizing the potential of synthetic biology. Nat. Rev. Mol. Cell Biol. 15, 289–294 (2014). - PMC - PubMed
    1. Way J. C., Collins J. J., Keasling J. D., Silver P. A., Integrating biological redesign: Where synthetic biology came from and where it needs to go. Cell 157, 151–161 (2014). - PubMed
    1. Erb T. J., Jones P. R., Bar-Even A., Synthetic metabolism: Metabolic engineering meets enzyme design. Curr. Opin. Chem. Biol. 37, 56–62 (2017). - PMC - PubMed
    1. Silver P. A., Way J. C., Arnold F. H., Meyerowitz J. T., Synthetic biology: Engineering explored. Nature 509, 166–167 (2014). - PubMed
    1. Amadi-Echendu J. E., et al. ., “What is engineering asset management?” in Definitions, Concepts and Scope of Engineering Asset Management, Amadi-Echendu J. E., Brown K., Willett R., Mathew J., Eds. (Springer, 2010), pp. 3–16.

Publication types

MeSH terms