

PPARγ marks splenic precursors of multiple nonlymphoid-tissue Treg compartments
- PMID: 33753509
- PMCID: PMC8020779
- DOI: 10.1073/pnas.2025197118
PPARγ marks splenic precursors of multiple nonlymphoid-tissue Treg compartments
Abstract
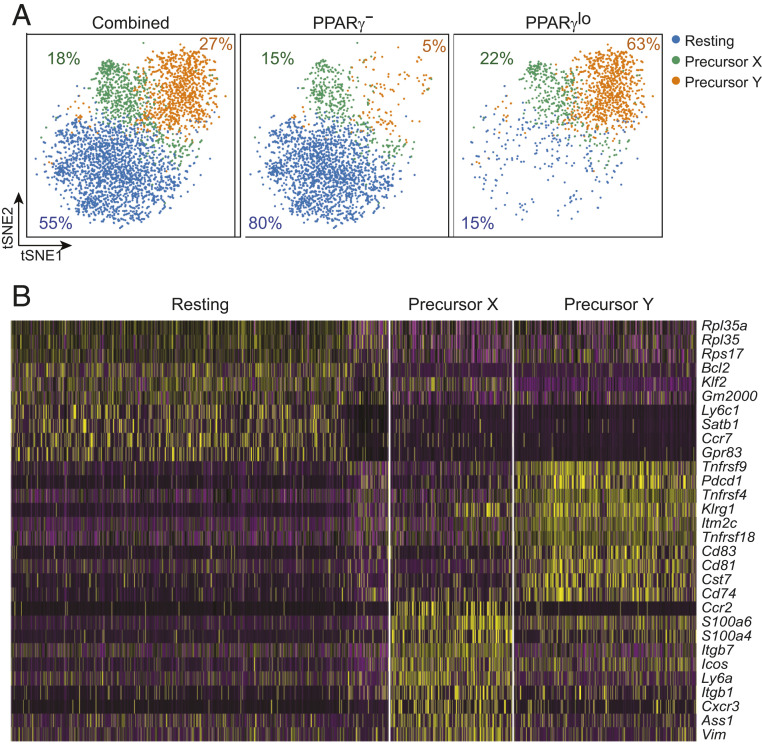
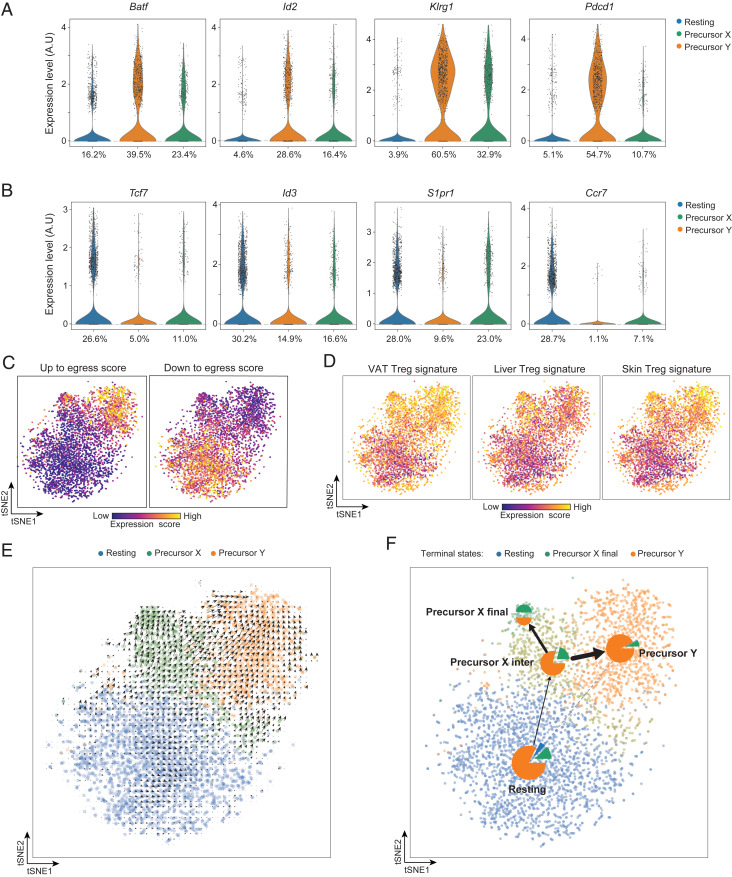
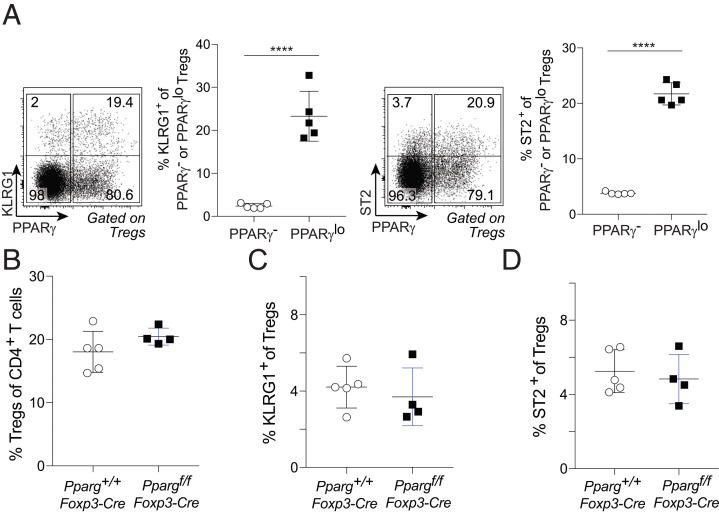
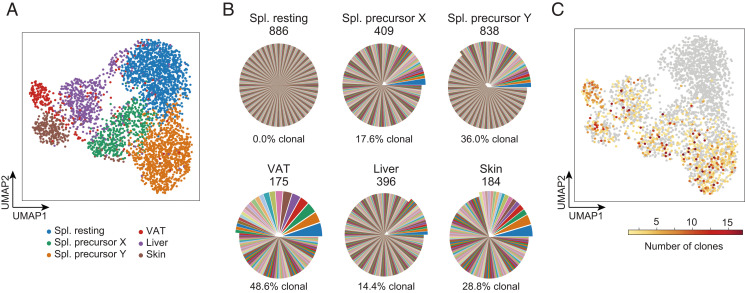
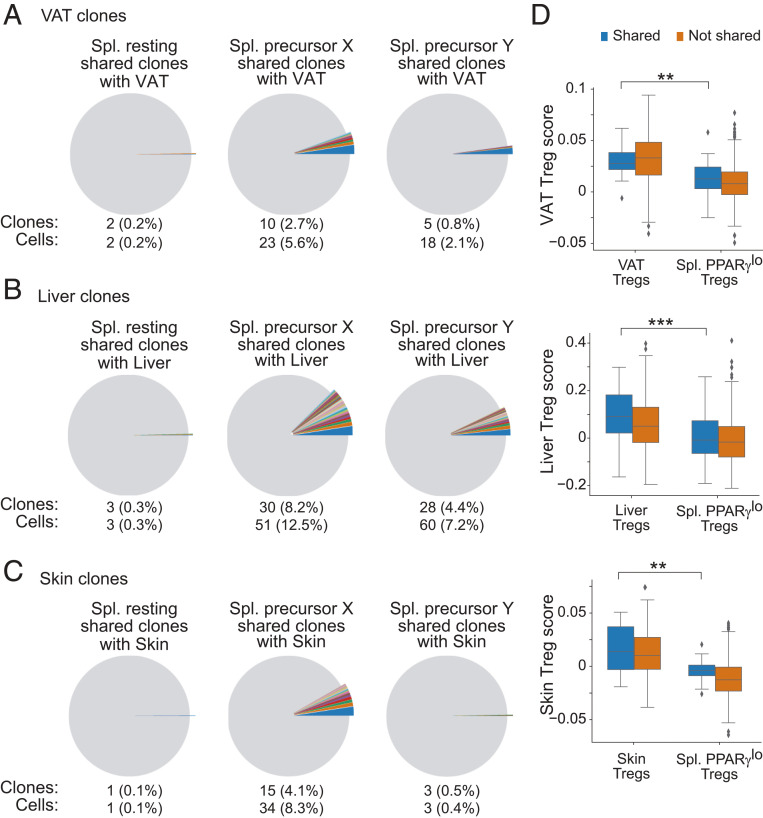
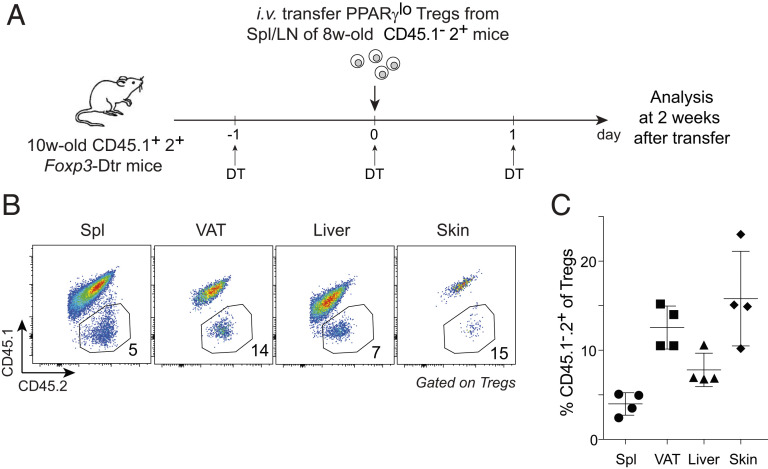
Foxp3+CD4+ regulatory T cells (Tregs) regulate most types of immune response as well as several processes important for tissue homeostasis, for example, metabolism and repair. Dedicated Treg compartments-with distinct transcriptomes, T cell receptor repertoires, and growth/survival factor dependencies-have been identified in several nonlymphoid tissues. These Tregs are specifically adapted to function and operate in their home tissue-When, where, and how do they take on their specialized characteristics? We recently reported that a splenic Treg population expressing low levels of the transcription factor PPARγ (peroxisome proliferator-activated receptor gamma) contains precursors of Tregs residing in visceral adipose tissue. This finding made sense given that PPARγ, the "master regulator" of adipocyte differentiation, is required for the accumulation and function of Tregs in visceral adipose tissue but not in lymphoid tissues. Here we use single-cell RNA sequencing, single-cell Tcra and Tcrb sequencing, and adoptive-transfer experiments to show that, unexpectedly, the splenic PPARγlo Treg population is transcriptionally heterogeneous and engenders Tregs in multiple nonlymphoid tissues beyond visceral adipose tissue, such as skin and liver. The existence of a general pool of splenic precursors for nonlymphoid-tissue Tregs opens possibilities for regulating their emergence experimentally or therapeutically.
Keywords: immunoregulation; precursor; single-cell RNA-seq; tissue Treg cell.
Conflict of interest statement
The authors declare no competing interest.
Figures
Similar articles
-
TCR Transgenic Mice Reveal Stepwise, Multi-site Acquisition of the Distinctive Fat-Treg Phenotype.Cell. 2018 Jul 12;174(2):285-299.e12. doi: 10.1016/j.cell.2018.05.004. Epub 2018 Jun 7. Cell. 2018. PMID: 29887374 Free PMC article.
-
Molecular diversification of regulatory T cells in nonlymphoid tissues.Sci Immunol. 2018 Sep 14;3(27):eaat5861. doi: 10.1126/sciimmunol.aat5861. Sci Immunol. 2018. PMID: 30217811 Free PMC article.
-
Appearance and disappearance of the mRNA signature characteristic of Treg cells in visceral adipose tissue: age, diet, and PPARγ effects.Proc Natl Acad Sci U S A. 2015 Jan 13;112(2):482-7. doi: 10.1073/pnas.1423486112. Epub 2014 Dec 30. Proc Natl Acad Sci U S A. 2015. PMID: 25550516 Free PMC article.
-
Tissue regulatory T cells: regulatory chameleons.Nat Rev Immunol. 2021 Sep;21(9):597-611. doi: 10.1038/s41577-021-00519-w. Epub 2021 Mar 26. Nat Rev Immunol. 2021. PMID: 33772242 Free PMC article. Review.
-
Derivation and Differentiation of Adipose-Tissue Regulatory T Cells: A Stepwise, Multi-Site Process.Front Immunol. 2020 Oct 29;11:599277. doi: 10.3389/fimmu.2020.599277. eCollection 2020. Front Immunol. 2020. PMID: 33193452 Free PMC article. Review.
Cited by
-
Regulatory T cells in the face of the intestinal microbiota.Nat Rev Immunol. 2023 Nov;23(11):749-762. doi: 10.1038/s41577-023-00890-w. Epub 2023 Jun 14. Nat Rev Immunol. 2023. PMID: 37316560 Review.
-
Inflammatory perturbations in early life long-lastingly shape the transcriptome and TCR repertoire of the first wave of regulatory T cells.Front Immunol. 2022 Aug 31;13:991671. doi: 10.3389/fimmu.2022.991671. eCollection 2022. Front Immunol. 2022. PMID: 36119090 Free PMC article.
-
Lespedeza homoloba enhances the immunosuppressive milieu of adipose tissue and suppresses fasting blood glucose.Biomed Rep. 2024 Sep 3;21(5):164. doi: 10.3892/br.2024.1852. eCollection 2024 Nov. Biomed Rep. 2024. PMID: 39268403 Free PMC article.
-
Deciphering visceral adipose tissue regulatory T cells: Key contributors to metabolic health.Immunol Rev. 2024 Jul;324(1):52-67. doi: 10.1111/imr.13336. Epub 2024 Apr 26. Immunol Rev. 2024. PMID: 38666618 Free PMC article. Review.
-
Adipose-tissue regulatory T cells are a consortium of subtypes that evolves with age and diet.Proc Natl Acad Sci U S A. 2024 Jan 23;121(4):e2320602121. doi: 10.1073/pnas.2320602121. Epub 2024 Jan 16. Proc Natl Acad Sci U S A. 2024. PMID: 38227656 Free PMC article.
References
Publication types
MeSH terms
Substances
Grants and funding
LinkOut - more resources
Full Text Sources
Other Literature Sources
Molecular Biology Databases
Research Materials
