. 2021 Mar 22;12(1):1806.
doi: 10.1038/s41467-021-22102-6.

A homogeneous split-luciferase assay for rapid and sensitive detection of anti-SARS CoV-2 antibodies

Affiliations

A homogeneous split-luciferase assay for rapid and sensitive detection of anti-SARS CoV-2 antibodies

Zhong Yao et al. Nat Commun. .

Abstract

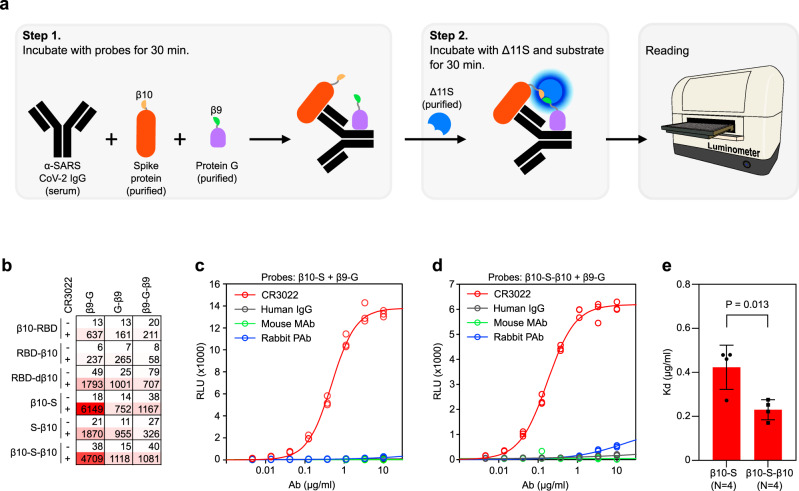
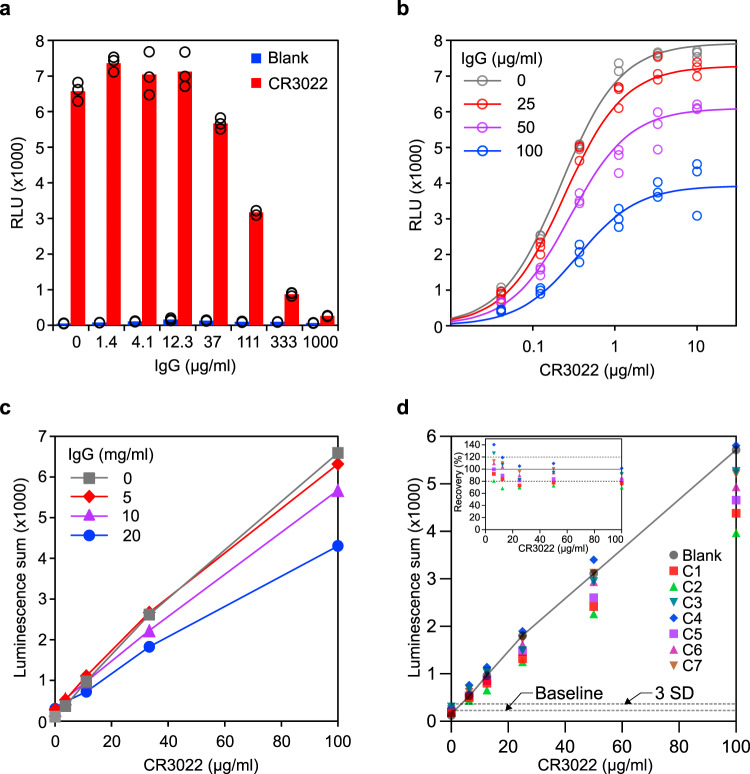
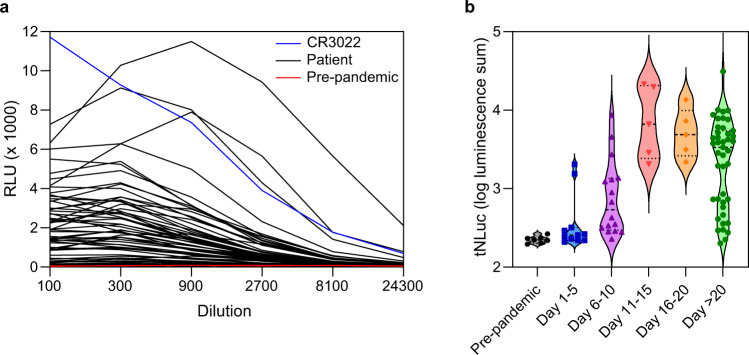
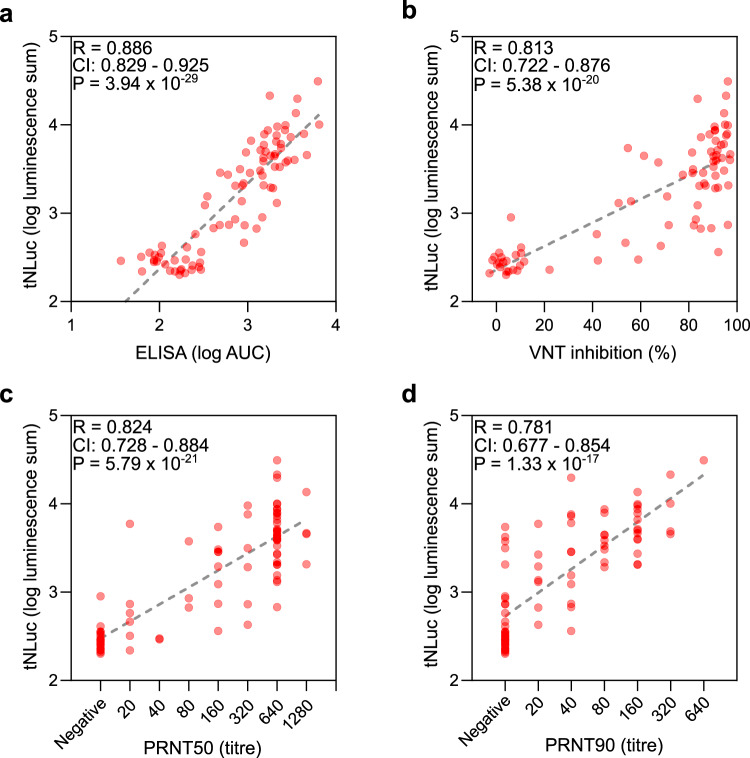
Better diagnostic tools are needed to combat the ongoing COVID-19 pandemic. Here, to meet this urgent demand, we report a homogeneous immunoassay to detect IgG antibodies against SARS-CoV-2. This serological assay, called SATiN, is based on a tri-part Nanoluciferase (tNLuc) approach, in which the spike protein of SARS-CoV-2 and protein G, fused respectively to two different tNLuc tags, are used as antibody probes. Target engagement of the probes allows reconstitution of a functional luciferase in the presence of the third tNLuc component. The assay is performed directly in the liquid phase of patient sera and enables rapid, quantitative and low-cost detection. We show that SATiN has a similar sensitivity to ELISA, and its readouts are consistent with various neutralizing antibody assays. This proof-of-principle study suggests potential applications in diagnostics, as well as disease and vaccination management.


Conflict of interest statement

A patent covering all of the main aspects/key elements of SATiN has been filed by the governing council of the University of Toronto (application number: US PROVISIONAL 63/121,689). The application is currently pending. I.S. and Z.Y. are named as co-inventors on the patent application. The remaining authors declare no competing interests.

Figures

Fig. 1
Fig. 1. tNLuc-based SATiN assay for detecting α-SARS-CoV-2 antibody.
a Schematic workflow of the SATiN assay. b Scan of all probe formats/combinations in the SATiN assay using CR3022 Ab (2 µg/mL). Results are presented as a heatmap showing RLU values. Data shown here are a representative result of three independent experiments with similar results. c, d CR3022 (red) at different concentrations was tested with β9-G together with β10-S (c) or β10-S-β10 (d) probes. Human IgG (gray), a mouse monoclonal Ab (green), and rabbit polyclonal Abs (blue) were used as controls. Data shown here are a representative result of four independent experiments for each probe with similar results. e Comparison of β10-S and β10-S-β10 affinities in the SATiN system. The average Kd values of four independent experiments for each probe are presented as mean ± SD. P-value was calculated using a two-tailed t-test. Source data are available in the Source Data file.
Fig. 2
Fig. 2. Characterization of SATiN assay.
a Inhibitory effect of additional IgG was examined using dose response. Different amounts of human IgG (as indicated) were applied to samples containing 2 µg/mL CR3022 (red) followed by analysis with the SATiN assay. Samples without CR3022 (blue) were used as negative control. Data shown here are a representative result of three independent experiments with similar results. b Inhibition kinetics of IgG in the assay were examined with different doses of CR3022, without IgG (gray) or in presence of human IgG at 25 (red), 50 (purple), or 100 (blue) µg/mL, roughly the amounts in human serum at a 1:200 dilution. Data shown here are a representative result of two independent experiments with similar results. c To mimic serum samples, different amounts of CR3022 (100, 33, 11, or 3.7 µg/mL) were spiked into buffer containing background human IgG at concentrations of 5 (red diamond), 10 (purple triangle), or 20 (blue circle) mg/mL, or without IgG (gray square). Each sample was serially diluted and then analyzed with the SATiN assay. Sums of luminescence readings at 1:300, 1:900, and 1:2700 for each sample are presented. Data shown here are a representative result of two independent experiments with similar results. d Serially diluted CR3022 (100, 50, 25, 12.5, and 6.25 µg/mL) was spiked into serum samples (n = 7, C1–C7 labeled with different colors and shapes) collected before the pandemic. In blank samples (gray circle), CR3022 was tested in buffer without mixing with serum. Each sample was tested and analyzed as in c. Basal value (baseline) was calculated as the mean of the seven serum samples without CR3022 spiking. The line of standard deviation (SD) × 3 is highlighted as the limit of detection. Recovery is calculated as the percentage signal of a sample divided by the corresponding blank sample and is plotted in the inset. Data shown here are a representative result of two independent experiments with similar results. Source data are available in the Source Data file.
Fig. 3
Fig. 3. Detection of α-SARS CoV-2 antibody in serum samples with the SATiN assay.
a Samples included 7 (red) collected before the pandemic and 82 (black) from verified active or convalescent COVID-19 patients collected at different times after symptom onset. These were serially diluted as indicated and subjected to SATiN testing. CR3022 (0.4 mg/mL in stock, red) was used as positive control. The level of anti-SARS CoV-2 antibodies at each dilution measured using SATiN. Data shown here are a representative result of two independent experiments with similar results. b. The overall antibody signal in each sample was calculated by summation of luminescence signals at dilutions 1:300, 1:900, and 1:2700. Samples are categorized in groups based on time elapsed between symptom onset and sample collection, and their distribution is presented in violin plots. The central dashed lines represent medians. Source data are available in the Source Data file.
Fig. 4
Fig. 4. Comparison of SATiN assay with ELISA and neutralizing antibody assays.
a The 84 serum samples described in Fig. 3 were tested using ELISA and the results are compared with SATiN using a scatter plot. bd Eighty sera were subjected to neutralizing antibody tests: sVNT (b), PRNT50 (c), and PRNT90 (d). R and P-values were obtained from two-tailed Pearson correlation analysis. Source data are available in the Source Data file.

Similar articles

Cited by

References

    1. Weissleder, R., Lee, H., Ko, J. & Pittet, M. J. COVID-19 diagnostics in context. Sci. Transl. Med. 12, eabc1931 (2020). - PubMed
    1. Tang Y, Schmitz JE, Persing DH, Stratton CW. Laboratory diagnosis of COVID-19: current issues and challenges. J. Clin. Microbiol. 2020;58:e00512–e00520. doi: 10.1128/JCM.00512-20. - DOI - PMC - PubMed
    1. Peeling RW, et al. Serology testing in the COVID-19 pandemic response. Lancet Infect. Dis. 2020;20:e245–e249. doi: 10.1016/S1473-3099(20)30517-X. - DOI - PMC - PubMed
    1. Huang AT, et al. A systematic review of antibody mediated immunity to coronaviruses: kinetics, correlates of protection, and association with severity. Nat. Commun. 2020;11:4704. doi: 10.1038/s41467-020-18450-4. - DOI - PMC - PubMed
    1. Lisboa Bastos M, et al. Diagnostic accuracy of serological tests for covid-19: systematic review and meta-analysis. BMJ. 2020;370:m2516. doi: 10.1136/bmj.m2516. - DOI - PMC - PubMed

Publication types