. 2021 Mar 22;12(1):1813.
doi: 10.1038/s41467-021-22034-1.

SARS-CoV-2 infection induces sustained humoral immune responses in convalescent patients following symptomatic COVID-19

Affiliations

SARS-CoV-2 infection induces sustained humoral immune responses in convalescent patients following symptomatic COVID-19

Jun Wu et al. Nat Commun. .

Abstract

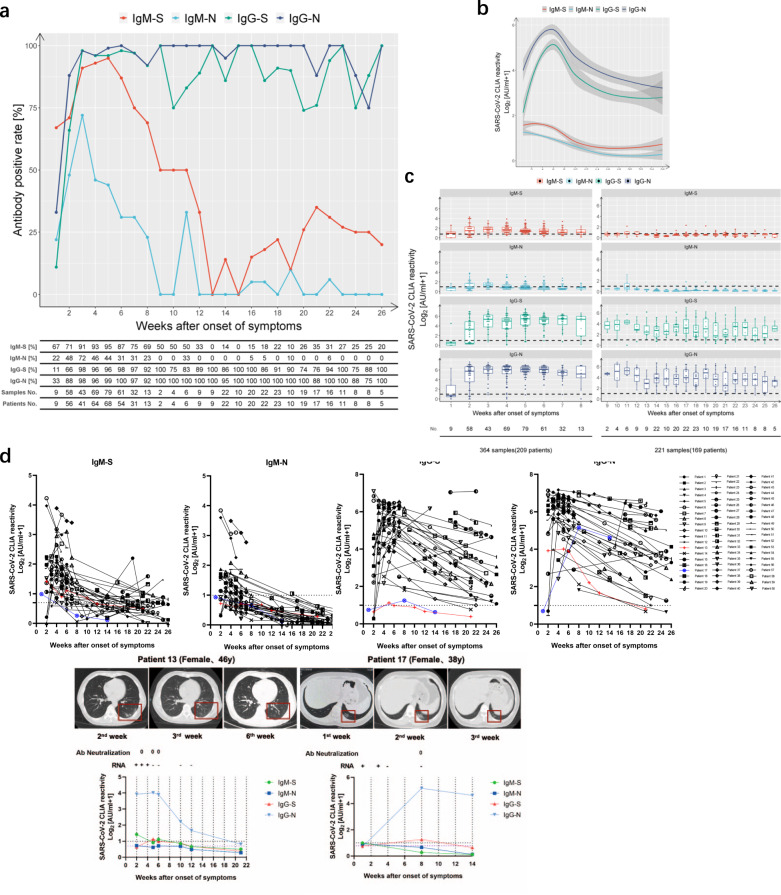
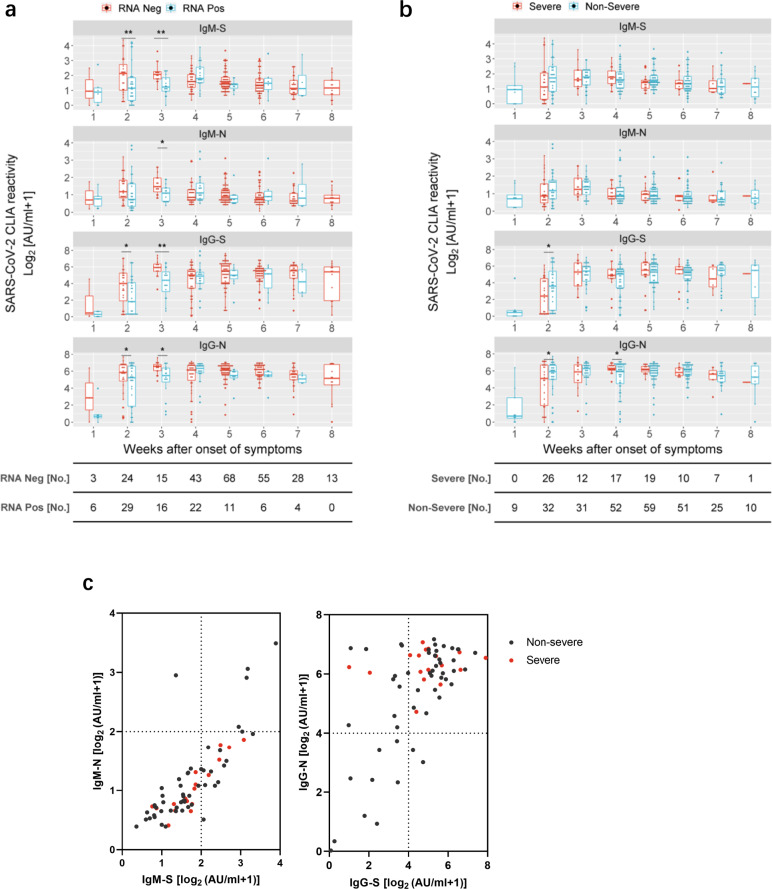
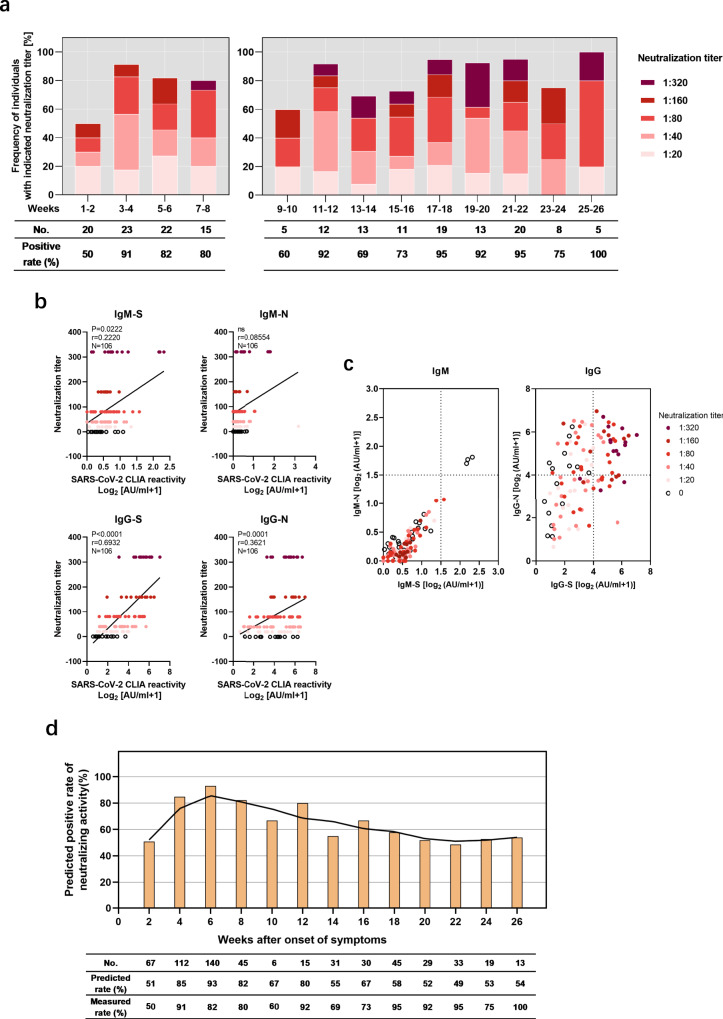
Long-term antibody responses and neutralizing activities in response to SARS-CoV-2 infection are not yet clear. Here we quantify immunoglobulin M (IgM) and G (IgG) antibodies recognizing the SARS-CoV-2 receptor-binding domain (RBD) of the spike (S) or the nucleocapsid (N) protein, and neutralizing antibodies during a period of 6 months from COVID-19 disease onset in 349 symptomatic COVID-19 patients who were among the first be infected world-wide. The positivity rate and magnitude of IgM-S and IgG-N responses increase rapidly. High levels of IgM-S/N and IgG-S/N at 2-3 weeks after disease onset are associated with virus control and IgG-S titers correlate closely with the capacity to neutralize SARS-CoV-2. Although specific IgM-S/N become undetectable 12 weeks after disease onset in most patients, IgG-S/N titers have an intermediate contraction phase, but stabilize at relatively high levels over the 6 month observation period. At late time points, the positivity rates for binding and neutralizing SARS-CoV-2-specific antibodies are still >70%. These data indicate sustained humoral immunity in recovered patients who had symptomatic COVID-19, suggesting prolonged immunity.


Conflict of interest statement

The authors declare no competing interests.

Figures

Fig. 1
Fig. 1. Longitudinal analyses of IgM and IgG against SARS-CoV-2 S/N in COVID-19 patients.
IgM and IgG against the RBD of the spike protein (“S”) and the nucleoprotein (“N”) of SARS-CoV-2 of 585 samples obtained from 349 patients were detected by capture chemiluminescence immunoassays (CLIA). a Positive rate of individual antibodies tested at the indicated dates following onset of symptoms. b, c The plasma antibody levels of IgM-S (red), IgM-N (light blue), IgG-S (green), and IgG-N (dark blue) in patients with different disease courses are presented. The line shows the mean value expected from a Lowess regression model, with shaded area representing 95% confidence interval in b. The boxes in c show medians (middle line), 75% quartiles (upper bound) and 25% quartiles (lower bound), and the whiskers show 1.5× the IQR above and below the box. The table below the figure represents the number of samples at each time point. d Sequential sampling and analyses of antibody titers in 60 COVID-19 cases. Characteristics of two patients with low IgG antibody levels. Patient 13: a 46-year-old female with fever, cough, dizziness, and fatigue for 6 days; patient 17: a 38-year-old female with fever and chest tightness for 4 days. The cutoff value for IgM-S detection was 0.7 AU/ml. The cutoff value for IgM-N, IgG-S, and IgG-N was 1 (shown on the left Y axis).
Fig. 2
Fig. 2. Correlation of antibody titers with virus control and severity of illness in COVID-19 patients.
a S- and N-specific CLIA-reactive IgM/IgG were compared in COVID-19 patients who were virus RNA-negative (red) versus those who were virus RNA-positive (blue) at the time point of sampling at different periods after the disease onset. A total of 343 results were acquired for this analysis. Each antibody detection value is either classified into the RNA-negative group or the RNA-positive group according to the simultaneous RNA detection result. Adjusted p values are as follows: second week after onset: IgM-S (p = 0.008); IgG-S (p = 0.012); IgG-N (p = 0.042); third week after onset: IgM-S (p = 0.007); IgM-N (p = 0.023); IgG-S (p = 0.005); IgG-N (p = 0.014). b Comparison of S- and N-specific CLIA-reactive IgM/IgG titers between severe (n = 60, red) and nonsevere (n = 149, blue) patients at different periods after the disease onset. Adjusted p values are as follows: second week after onset: IgG-S (p = 0.028); IgG-N (p = 0.028); third week after onset: IgG-N (p = 0.019). The boxes in a and b show medians (middle line), 75% quartiles (upper bound) and 25% quartiles (lower bound), and the whiskers show 1.5× the IQR above and below the box. Repeated measures (mixed model) ANOVA was used for statistical analysis. *p < 0.05; **p < 0.01; ***p < 0.001, two-sided. The table below the figure represents the number of samples at each time point. c Comparison of 64 severe and nonsevere patients (69 samples) at different S- and N-specific CLIA-reactive IgM/IgG levels at the fourth week after symptoms onset.
Fig. 3
Fig. 3. N-specific and S-specific IgG responses have different predictive values for neutralization.
A total of 186 samples from 137 symptomatic COVID-19 patients were assessed concerning SARS-CoV-2 neutralization titers and grouped according to the weeks after symptom onset. a Proportions of plasma neutralization activity were stratified in 2-week intervals. b Correlation analysis of neutralization titer with S- and N-specific CLIA-reactive IgM/IgG in COVID-19 patients. A nonparametric Spearman’s correlation test was used for the statistical analyses. In the graphs, p, r, and n indicate the p value, correlation coefficient, and sample size, respectively. c Distribution of neutralizing activity at different S- and N-specific CLIA-reactive IgM/IgG. d based on the predicted cutoff value and IgG-S titer, the neutralizing activity of all confirmed patients at different time points was calculated.

References

    1. WHO. Coronavirus Disease (COVID-19) Situation Dashboard (WHO, accessed 18 Jan 2021). https://covid19.who.int.
    1. Li K, et al. Dynamic changes in anti-SARS-CoV-2 antibodies during SARS-CoV-2 infection and recovery from COVID-19. Nat. Commun. 2020;11:6044. doi: 10.1038/s41467-020-19943-y. - DOI - PMC - PubMed
    1. Long QX, et al. Antibody responses to SARS-CoV-2 in patients with COVID-19. Nat. Med. 2020;26:845–848. doi: 10.1038/s41591-020-0897-1. - DOI - PubMed
    1. Jin Y, et al. Diagnostic value and dynamic variance of serum antibody in coronavirus disease 2019. Int J. Infect. Dis. 2020;94:49–52. doi: 10.1016/j.ijid.2020.03.065. - DOI - PMC - PubMed
    1. Liu W, et al. Evaluation of nucleocapsid and spike protein-based enzyme-linked immunosorbent assays for detecting antibodies against SARS-CoV-2. J. Clin. Microbiol. 2020;58:e00461–00420. - PMC - PubMed

Publication types