. 2021 Mar 22;11(1):6562.
doi: 10.1038/s41598-021-85659-8.

Islet sympathetic innervation and islet neuropathology in patients with type 1 diabetes

Affiliations

Islet sympathetic innervation and islet neuropathology in patients with type 1 diabetes

Martha Campbell-Thompson et al. Sci Rep. .

Abstract

Dysregulation of glucagon secretion in type 1 diabetes (T1D) involves hypersecretion during postprandial states, but insufficient secretion during hypoglycemia. The sympathetic nervous system regulates glucagon secretion. To investigate islet sympathetic innervation in T1D, sympathetic tyrosine hydroxylase (TH) axons were analyzed in control non-diabetic organ donors, non-diabetic islet autoantibody-positive individuals (AAb), and age-matched persons with T1D. Islet TH axon numbers and density were significantly decreased in AAb compared to T1D with no significant differences observed in exocrine TH axon volume or lengths between groups. TH axons were in close approximation to islet α-cells in T1D individuals with long-standing diabetes. Islet RNA-sequencing and qRT-PCR analyses identified significant alterations in noradrenalin degradation, α-adrenergic signaling, cardiac β-adrenergic signaling, catecholamine biosynthesis, and additional neuropathology pathways. The close approximation of TH axons at islet α-cells supports a model for sympathetic efferent neurons directly regulating glucagon secretion. Sympathetic islet innervation and intrinsic adrenergic signaling pathways could be novel targets for improving glucagon secretion in T1D.


Conflict of interest statement

The authors declare no competing interests.

Figures
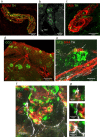
Figure 1
Figure 1
3D human pancreas islet sympathetic neuroanatomy in control donors. (a) Maximum project of confocal image for TH axons (red) and NCAM axons (green) in fixed frozen sections showing TH axons with the NCAM bundle. Scale bar 100 µm. (b) Two interlobular arteries (asterisks) are shown in cross-section surrounded by numerous TH axons (red). An adjacent vein shows few adjacent TH axons. Scale bar 20 µm. (c) Maximum project of confocal image for smooth muscle cells (SMA, red) enveloping an intralobular artery. Surrounding TH axons (green) contain numerous varicosities (see also Supplementary Video 1 for complete z-stack). Scale bar 25 µm. (d) Maximum project of confocal image for the pancreatic arterial network outlined with TH (red) axons with branching to islet α-cells (glucagon (GCG), green, iDISCO cleared sample). Scale bar 200 µm. See also Fig. 5. (e) Maximum project of confocal image for TH axons and varicosities (white) shown wrapping and coursing from an intralobular artery (SMA, red) and a smaller islet arteriole (white arrow) with adjacent islet α-cells (GCG, green). Scale bar 50 µm. (f) Maximum project of confocal image for TH axons and varicosities (white) at a control donor islet stained for insulin (INS, orange) and glucagon (GCG, green). Fibers are observed entering the islet at one pole indicative of the feeding arteriole region with white arrows indicating points of potential contact with endocrine cells. Scale bar 25 µm. (g) Points of TH axon contacts with β-cells and α- cells from (f) at higher resolutions. Scale bars 10 µm.
Figure 2
Figure 2
Islet NCAM and TH axon image analysis by confocal microscopy and ImageJ in control donors. Frozen sections (40 µm thick) were fixed and stained for neural cell adhesion marker (NCAM), tyrosine hydroxylase (TH) and glucagon (α-cells, see Fig. 3a) to define total and sympathetic innervation and islets, respectively, as described in Methods. Islets were contoured on maximum intensity projects as demonstrated in (a). (a) The z-stack confocal images of 40 µm thick sections stained for NCAM and TH were converted into MIP images (A) NCAM in red, (B) TH in green and (C) merged image representing colocalization NCAM and TH. The images D, E, F are the corresponding threshold images to (A), (B) and (C) respectively. These raw threshold images were quantified for % density per unit area for NCAM and TH within islets. (b) The thresholded images were quantified for NCAM and TH density (%). (c) The thresholded images were quantified for TH/NCAM overlap (%). Data are scatterplots with bars representing mean ± SD for 7 islets/donor in 7 control donors, aged 9–21.8 years old. See also Supplementary Fig. S2.
Figure 3
Figure 3
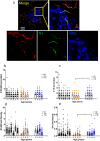
Islet NCAM and TH axon counts and morphometry in T1D. (a) Maximum intensity projection of a confocal islet image from a control donor stained by NCAM (red), TH (green), and glucagon (GCG, blue) in a fixed frozen section. A merged image (left upper) with boxed inset for higher detail of intra-islet axons. Single channel images for NCAM and TH show TH axons traveling with NCAM axons into an islet. Scale bar 50 µm. (b) NCAM axons per islet were counted (n = 185 islets in 6 ND donors, n = 93 islets in 4 AAb donors, n = 118 islets in 4 T1D donors). (c) TH axons per islet were counted (n = 185 islets in 6 ND donors, n = 93 islets in 4 AAb donors, n = 118 islets in 4 T1D donors). *p = 0.05 AAb vs. T1D. (d) NCAM axon density within islets was analyzed using ImageJ (n = 167 islets in 6 ND donors, n = 85 islets in 4 AAb donors, n = 93 islets in 4 T1D donors). (e) TH axon density within islets was analyzed using ImageJ (n = 167 islets in 6 ND donors, n = 85 islets in 4 AAb donors, n = 93 islets in 4 T1D donors). *p = 0.05 AAb vs. T1D. Data are presented as mean ± SD per donor. All statistical significance values were determined using nested 1-way ANOVA with multiple comparisons. See also Supplementary Fig. S2.
Figure 4
Figure 4
Islet α-cell and δ-cell proximity to TH varicosities in T1D. (a) Maximum project for human islet stained for TH (white) and GCG (green) in a T1D individual. TH axons in close proximity to α-cells are indicated by white arrows. Scale bar 25 µm. Insets for maximum intensity project (MIP, 58 µm stack) and single z slices for three regions in (a) are shown in higher detail. Scale bars 10 µm. (b) Maximum project for human islet stained for TH (white) and somatostatin (SST, red) in a T1D individual. A TH fiber coursing in close proximity to δ-cells (white arrows) is shown by merged and single channels. Scale bar 10 µm. See also Supplementary Videos 2–3.
Figure 5
Figure 5
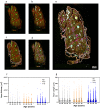
Exocrine pancreas iDISCO image analysis pipeline and TH axon volume and length. (a) Maximum intensity projection of a control pancreas slice is shown depicting key image analysis steps with Neurolucida360. TH axons (red) and α-cells (GCG, green) delineate sympathetic axons and islets, respectively. (b) Islets are contoured (white) based on GCG signal. (c) Slice outlines are shown contoured in white and orange for the first and last slices, respectively, and all slice outlines were used to determine total sample volume (µm3). (d) TH axons were automatically traced following thresholding and individual axons were displayed in separate colors. (e) Merged image showing overlays of TH axons and islet and slice contours. Scale bar: 500 µm. (f) Exocrine TH axon volumes (µm3) were not significantly different between groups. (g) Exocrine TH axon lengths (µm) volumes were not significantly different between groups. Data were plotted for all TH axon volumes and lengths per donor (n = 1381–8197 axons/donor) for 4 donors in each group. Statistical significance was tested using 1-way ANOVA for nested tables.
Figure 6
Figure 6
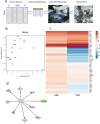
Laser microdissection assay pipeline and RNAseq analysis. (a) Experimental RNA-seq pipeline. Fresh frozen pancreas sections were placed onto slides and following fixation and dehydration, islets were microdissected using a Leica LMD7000 microscope. Microdissected islets were visualized in the microvial cap (far right). (b) Multi-dimensional scaling (MDS) plot shows grouping of donors within groups (n = 8 ND, n = 3 AAb, n = 7 T1D). One T1D donor (lower right) was not excluded though appearing as an outlier due to additional QC (see Supplementary Fig. S4). (c) Heatmap of top 50 differentially expressed genes between AAb versus ND (AAb) and T1D versus ND (T1D) (blue, down-regulated; red, upregulated). (d) Network interaction plot shows the transcription factor PDX-1 with other gene interactions including SLC2A2 (GLUT2), MAFA and TGFBR3 (green, down regulated; red, upregulated). See Supplementary Tables 4–5 for gene lists.
Figure 7
Figure 7
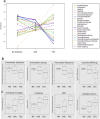
Islet neuropathology pathways in AAb and T1D donors. (a) Nanostring neuropathology pathways with significantly different gene regulation between the donor groups are shown by colored line plots with pathways listed in the side-box (n = 4 no diabetes, n = 4 Autoab Pos (AAb), n = 4 T1D donors). (b) Bar and whisker plots (median, range) of relative gene expression levels for transmitter synthesis and storage, transmitter release, transmitter response and update, and vesicle trafficking that were significantly downregulated in T1D donors. Donor types are ordered as in (a) (c) Bar and whisker plots (median, range) of relative gene expression levels for activated microglia, cytokines, unfolded protein response (UPR) and oxidative stress pathways that were significantly upregulated in T1D donors. See Supplementary Tables S6–7 for additional details.

Similar articles

Cited by

References

    1. Cryer PE. Minireview: Glucagon in the pathogenesis of hypoglycemia and hyperglycemia in diabetes. Endocrinology. 2012;153:1039–1048. doi: 10.1210/en.2011-1499. - DOI - PMC - PubMed
    1. Yosten GLC. Alpha cell dysfunction in type 1 diabetes. Peptides. 2018;100:54–60. doi: 10.1016/j.peptides.2017.12.001. - DOI - PubMed
    1. Bolli GB, et al. Abnormal glucose counterregulation after subcutaneous insulin in insulin-dependent diabetes mellitus. N. Engl. J. Med. 1984;310:1706–1711. doi: 10.1056/NEJM198406283102605. - DOI - PubMed
    1. Rickels MR. Hypoglycemia-associated autonomic failure, counterregulatory responses, and therapeutic options in type 1 diabetes. Ann. N. Y. Acad. Sci. 2019 doi: 10.1111/nyas.14214. - DOI - PMC - PubMed
    1. Lee YH, Wang MY, Yu XX, Unger RH. Glucagon is the key factor in the development of diabetes. Diabetologia. 2016;59:1372–1375. doi: 10.1007/s00125-016-3965-9. - DOI - PubMed

Publication types

MeSH terms